Embed Size (px)
Citation preview

“As a media buyer, I know thatcommunity newspapers areprobably the best media todrive home a message to anaudience at a grassroots level.Market Analyzer instantlyplugs me into quantifiable,justifiable research onHUNDREDS of Canadianmarkets from coast-to-coast…Markets I hadn’t even heardof. A truly targeted, nationalmass media plan that marketsto local communities? Inminutes? Market Analyzermakes it easy.”
Emily Ouellette, Media Planning Buyer, BosToronto, Ontario
Market Analyzer
Your guide to the most powerful planning application for community newspapers.
Unique ▼ Powerful ▼ Easy to use
Welcome to Market Analyzer.
Here, you’ll find hundreds of communitynewspapers, meticulously mapped toagriculture, demographic, socio-economicand consumer spending data. Deliversingle buys or campaign plans in a fewclicks of your mouse.
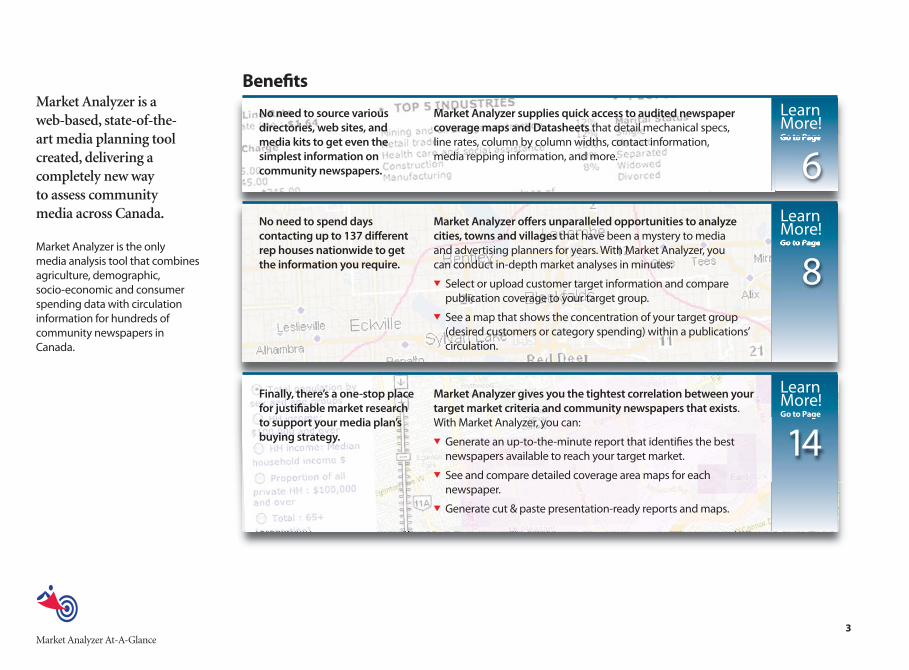
Market Analyzer is a web-based, state-of-the-art media planning toolcreated, delivering acompletely new way to assess community media across Canada.
Market Analyzer is the only media analysis tool that combinesagriculture, demographic, socio-economic and consumerspending data with circulationinformation for hundreds ofcommunity newspapers inCanada.
No need to source variousdirectories, web sites, andmedia kits to get even thesimplest information oncommunity newspapers.
Market Analyzer supplies quick access to audited newspapercoverage maps and Datasheets that detail mechanical specs,line rates, column by column widths, contact information, media repping information, and more.
Learn More!Go to Page
6No need to spend dayscontacting up to 137 differentrep houses nationwide to getthe information you require.
Market Analyzer offers unparalleled opportunities to analyzecities, towns and villages that have been a mystery to media and advertising planners for years. With Market Analyzer, you can conduct in-depth market analyses in minutes:▼ Select or upload customer target information and compare
publication coverage to your target group.▼ See a map that shows the concentration of your target group
(desired customers or category spending) within a publications’circulation.
Finally, there’s a one-stop placefor justifiable market researchto support your media plan’sbuying strategy.
Market Analyzer gives you the tightest correlation between yourtarget market criteria and community newspapers that exists.With Market Analyzer, you can:▼ Generate an up-to-the-minute report that identifies the best
newspapers available to reach your target market.▼ See and compare detailed coverage area maps for each
newspaper.▼ Generate cut & paste presentation-ready reports and maps.
Market Analyzer At-A-Glance
Learn More!Go to Page
8
Learn More!Go to Page
14
Benefits
3
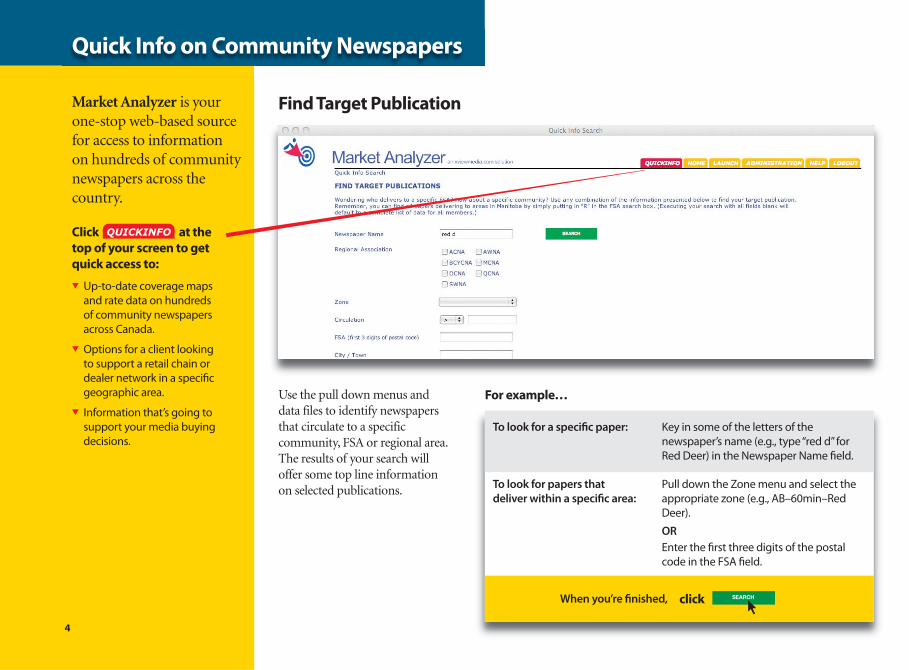
Use the pull down menus anddata files to identify newspapersthat circulate to a specificcommunity, FSA or regional area.The results of your search willoffer some top line informationon selected publications.
For example…
Key in some of the letters of thenewspaper’s name (e.g., type “red d” for Red Deer) in the Newspaper Name field.
To look for a specific paper:
Find Target Publication
Pull down the Zone menu and select theappropriate zone (e.g., AB–60min–RedDeer).
OREnter the first three digits of the postalcode in the FSA field.
To look for papers thatdeliver within a specific area:
When you’re finished, click
Market Analyzer is yourone-stop web-based sourcefor access to information on hundreds of communitynewspapers across thecountry.
Click at the
top of your screen to get
quick access to:
▼ Up-to-date coverage maps and rate data on hundreds of community newspapersacross Canada.
▼ Options for a client looking to support a retail chain ordealer network in a specificgeographic area.
▼ Information that’s going tosupport your media buyingdecisions.
4
Quick Info on Community Newspapers

Quick Info Results will appear as a list of community newspapersand information that defines theircoverage areas, with respect to:circulation, population, number of dwellings, line rate, format,publication days, and communitiesserved.
To pick a few of the communitynewspapers, uncheck the boxnext to Distribution. Now check
the box next to thecommunity newspapers you wish to learn more about.
Click to export thisdata into Microsoft Excel and thenuse it in other software, if you like.
Click the M icon (Map Datasheet)to view or download auditednewspaper coverage maps,illustrating postal code boundaries,major roadways/waterways andtown-by-town circulationbreakdowns.
Click the DS icon (Datasheet RateCard) to access comprehensivenewspaper and marketinformation. The market datacontained in the Datasheet includescomprehensive census-baseddemographic and agriculture data,as well as Consumer Spending data.
Download Info
Find Details on Selected Publications
5Market Analyzer At-A-Glance
Quick Info on Community Newspapers
6
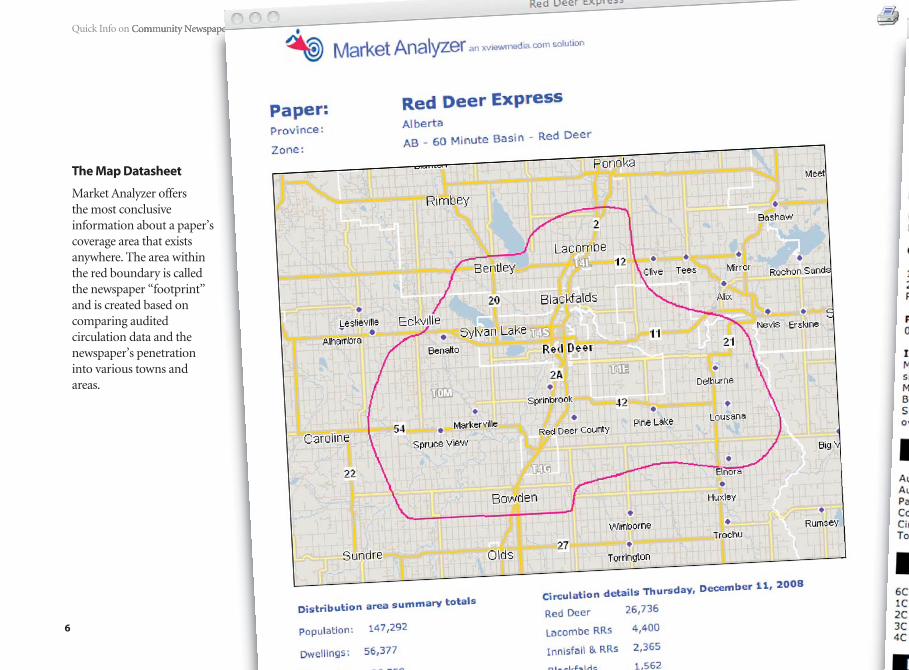
The Map Datasheet
Market Analyzer offers the most conclusiveinformation about a paper’scoverage area that existsanywhere. The area withinthe red boundary is calledthe newspaper “footprint”and is created based oncomparing auditedcirculation data and thenewspaper’s penetrationinto various towns andareas.
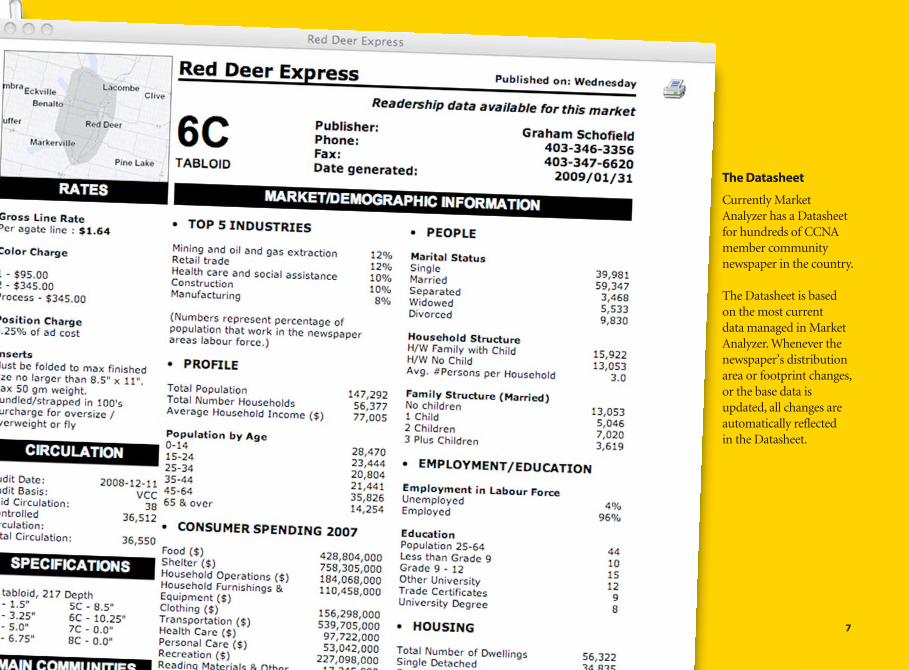
The Datasheet
Currently MarketAnalyzer has a Datasheetfor hundreds of CCNAmember communitynewspaper in the country.
The Datasheet is based on the most current data managed in MarketAnalyzer. Whenever thenewspaper’s distributionarea or footprint changes,or the base data isupdated, all changes areautomatically reflected in the Datasheet.
7

“I am a marketing analyst at Canola Seed Company and I want to define mymarket across WesternCanada. Where are the canola growers?”
Use Market Analyzer to choose the criteria that defines the targetmarket, and then quickly match the right community newspapers.
In our example, the ideal targetmarket would be where:
1. There are prosperous households;and
2. A lot of canola is being produced.
Use Market Analyzer to getjustifiable and quantifiableresearch on markets andnewspapers you’ve likelynever heard of.
Click when you:
▼ Have an idea about the type ofconsumer or market you want to target, but don’t know exactlywhere your market is or whichcommunity newspaper reachesit best.
▼ Want to use spending, incomeand other demographic data to show your client that yourmedia plan makes sense.
▼ Need to assemble a media plan for your client proposal—including cost and/orpenetration data.
▼ Want to use the best availablenewspaper industry and mediabuying data to sell your mediaplan.
Case Study
8
Launch Into a More Detailed Analysis
Click Launch to put MarketAnalyzer to work.
LAUNCH ADMINISTRHOME
LAUNCH
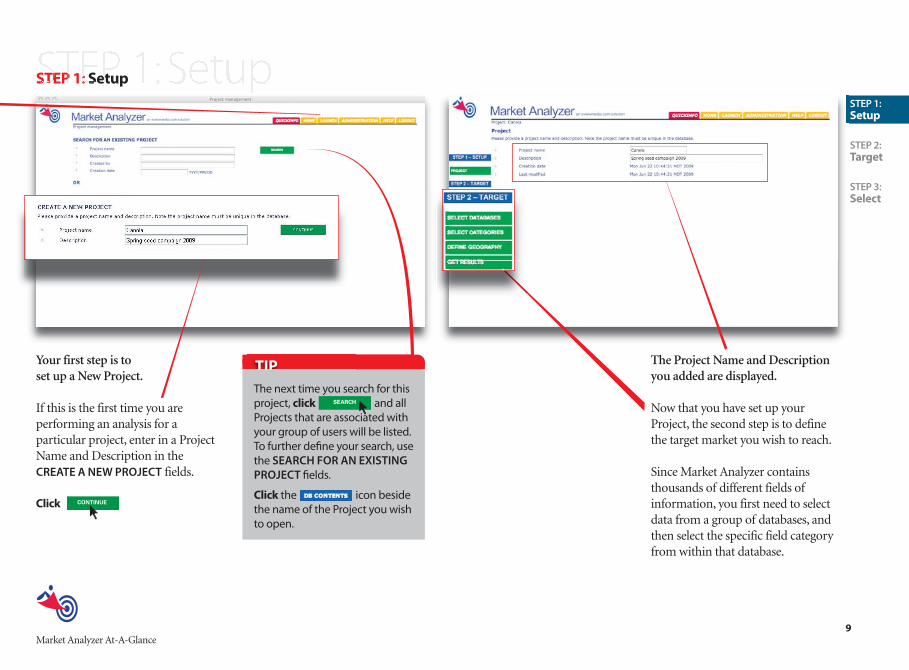
Your first step is to set up a New Project.
If this is the first time you areperforming an analysis for aparticular project, enter in a ProjectName and Description in theCREATE A NEW PROJECT fields.
Click
The Project Name and Descriptionyou added are displayed.
Now that you have set up yourProject, the second step is to definethe target market you wish to reach.
Since Market Analyzer containsthousands of different fields ofinformation, you first need to selectdata from a group of databases, andthen select the specific field categoryfrom within that database.
TIP
The next time you search for thisproject, click and allProjects that are associated withyour group of users will be listed.To further define your search, use the SEARCH FOR AN EXISTINGPROJECT fields.
Click the icon besidethe name of the Project you wishto open.
STEP 1: Setup
STEP 1:Setup
STEP 2:Target
STEP 3:Select
SEARCH
CONTINUE
9Market Analyzer At-A-Glance
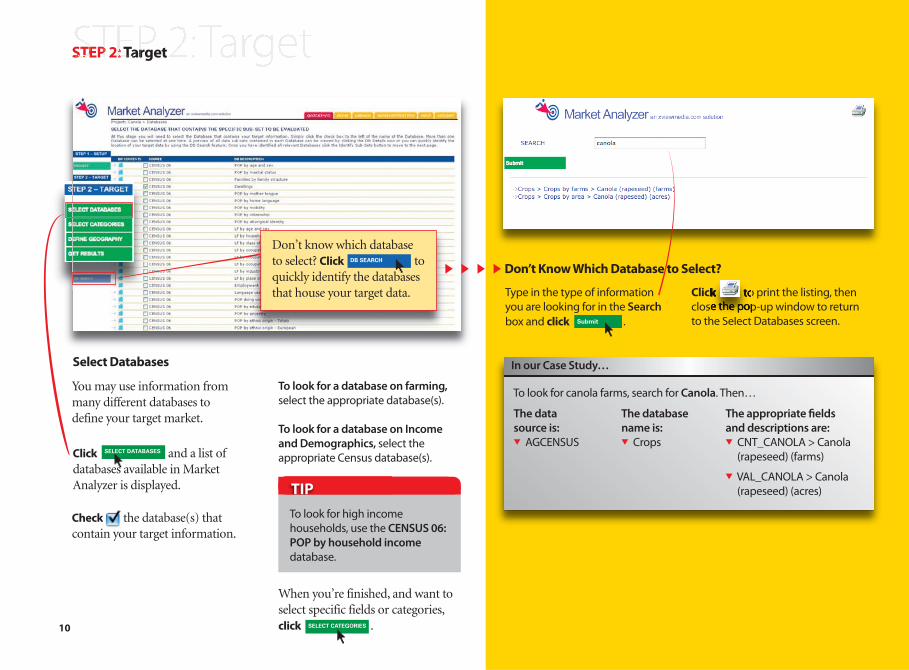
Click and a list ofdatabases available in MarketAnalyzer is displayed.
Check the database(s) thatcontain your target information.
Select Databases
Don’t Know Which Database to Select?
Type in the type of informationyou are looking for in the Searchbox and click .
Click to print the listing, thenclose the pop-up window to returnto the Select Databases screen.
STEP 2: Target
SELECT DATABASES
Submit
Don’t know which databaseto select? Click toquickly identify the databasesthat house your target data.
DB SEARCH
To look for a database on farming,select the appropriate database(s).
To look for a database on Incomeand Demographics, select theappropriate Census database(s).
When you’re finished, and want toselect specific fields or categories,click .SELECT CATEGORIES
In our Case Study…
To look for canola farms, search for Canola. Then…
The data source is:▼ AGCENSUS
The databasename is:▼ Crops
The appropriate fields and descriptions are:▼ CNT_CANOLA > Canola
(rapeseed) (farms)
▼ VAL_CANOLA > Canola(rapeseed) (acres)
10
You may use information frommany different databases todefine your target market.
TIP
To look for high incomehouseholds, use the CENSUS 06:POP by household incomedatabase.
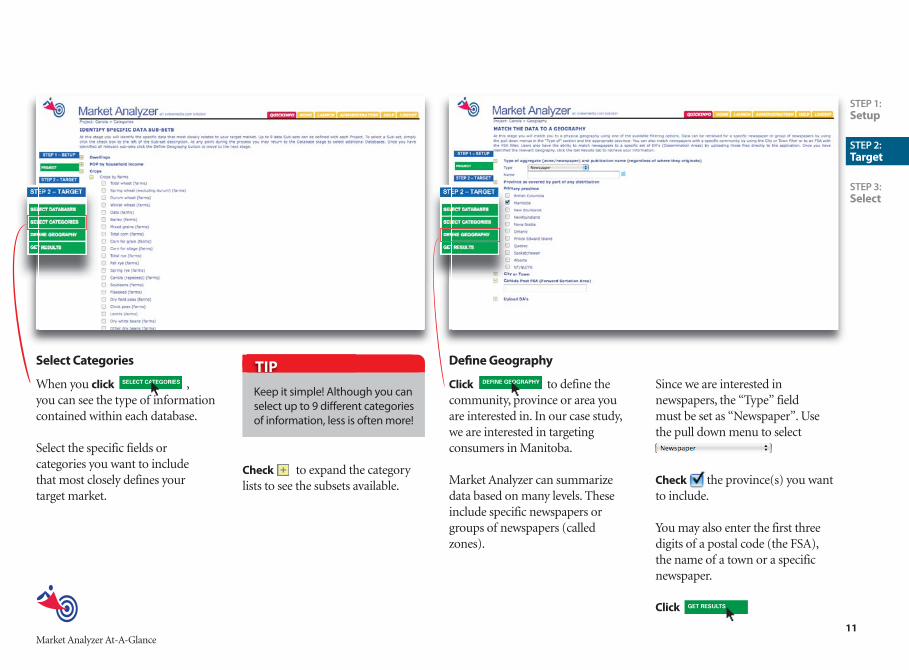
When you click , you can see the type of informationcontained within each database.
Select the specific fields orcategories you want to include that most closely defines your target market.
Check to expand the categorylists to see the subsets available.
Select Categories
Click to define thecommunity, province or area youare interested in. In our case study,we are interested in targetingconsumers in Manitoba.
Market Analyzer can summarizedata based on many levels. Theseinclude specific newspapers orgroups of newspapers (calledzones).
Since we are interested innewspapers, the “Type” field must be set as “Newspaper”. Usethe pull down menu to select
Check the province(s) you want to include.
You may also enter the first threedigits of a postal code (the FSA), the name of a town or a specificnewspaper.
Click
Define Geography
DEFINE GEOGRAPHY
GET RESULTS
11
STEP 1:Setup
STEP 2:Target
STEP 3:Select
SELECT CATEGORIES
TIP
Keep it simple! Although you canselect up to 9 different categoriesof information, less is often more!
Market Analyzer At-A-Glance

In our Case Study…
Get Results
The results will appear as a list ofpublications that match your targetcriteria and the specific fields orcategories of information you haveselected.
The code shown at the top of eachcolumn matches those in the legendat the top of the screen.
Click the column heading if you wishto sort the list of records presented.
We can click the VAL_CANOLAheading to find the communitynewspapers that cover the areas with the greatest canolaproduction (as measured by thetotal number of acres of canola).
Click the DS icon to access the Rate Card/Datasheet associated with the specific record.
Click the MAP icon to view athematic map that shows you exactly where your target occurswithin the coverage area.
STEP 2: Target (cont’d)
12

Selection of the MAP icon willcreate a new window that shows the distribution of the target datawithin the newspaper footprint. This footprint is defined as acollection of squares.
Each of the categories you selectedcan be selected again. This willallow them to be mapped out.
Click the radio button of thecategory you wish to map. In ourexample, select “Proportion of allprivate HH: $80,000 and over”, and click . The map will re-draw with the new target dataplotted.
You can use each square grid to get a sense of the size of thecoverage area. In this case, eachsquare represents an area of 2,500m x 2,500m.
You can also move around the map,and zoom in and out of the map, by using the navigational arrows.
Show
STEP 1:Setup
STEP 2:Target
STEP 3:Select
13
TIP
If you are interested in a larger area or collectionof newspapers, try selecting “zone” as anaggregation type and see what happens.
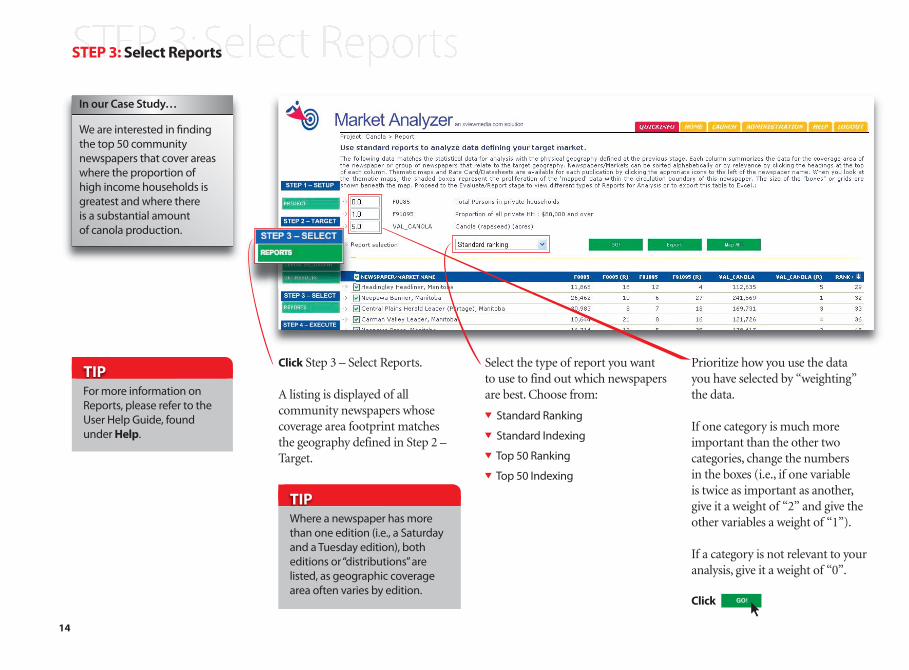
Click Step 3 – Select Reports.
A listing is displayed of allcommunity newspapers whosecoverage area footprint matches the geography defined in Step 2 –Target.
Select the type of report you wantto use to find out which newspapersare best. Choose from:
▼ Standard Ranking
▼ Standard Indexing
▼ Top 50 Ranking
▼ Top 50 Indexing
Prioritize how you use the data you have selected by “weighting”the data.
If one category is much moreimportant than the other twocategories, change the numbers in the boxes (i.e., if one variable is twice as important as another,give it a weight of “2” and give theother variables a weight of “1”).
If a category is not relevant to youranalysis, give it a weight of “0”.
Click GO!
14
STEP 3: Select Reports
In our Case Study…
We are interested in findingthe top 50 communitynewspapers that cover areaswhere the proportion of high income households isgreatest and where there is a substantial amount of canola production.
TIPWhere a newspaper has morethan one edition (i.e., a Saturdayand a Tuesday edition), botheditions or “distributions” arelisted, as geographic coveragearea often varies by edition.
TIPFor more information onReports, please refer to theUser Help Guide, foundunder Help.

Market Analyzer At-A-Glance
Select the Rank+ column to sort thepapers and get the top communitynewspapers. All papers are orderedor ranked from best to worst.
Check the box(es) next to eachNewspaper/Market Name you youwish to include.
Click to go to the next step.
Do you want to see other fields or categories of information? Click the radio button to select the data you are interested in, and then click .
STEP 1:Setup
STEP 2:Target
STEP 3:Select
Click to export this datainto Microsoft Excel and then useit in other software, if you like.
Click to see a map of all the areas covered by allnewspapers you have selected.
Export
Map All
GO!
Show
15
In our Case Study…
You can see where the amountof canola is higher or lower,based on the colour intensity of the grid squares.

Want to get even more details?
If you have any questions, requirehelp, or would like the reports andmaps done for you, please contact:
Jeff Beardsworth, Advertising Director AdWest Marketing Inc.Market Analyzer Project Manager