Embed Size (px)
Citation preview

Heap & Thread Dump

In this session
• What is Thread/Heap dump?
• When to generate ?
• How to generate ?
• Best Practices and JVM Options
• Ref and suggestion links to understand more this topic

What is Thread dump?
• A Thread Dump is a snapshot taken at a given time which provides you with a complete listing of all created Java Threads.
• Like:
• Servlet Request
• Job (scheduler) etc.
• Each Thread found gives you information such as:

• Thread name: Name of the Thread we/vendor can specify thread name at a time of the creating. E.g: we can configure quartz-scheduler thread or by default quartz scheduler name looks like “instanceName+ ‘_QuartzSchedulerThread’ ”
• Thread type & priority ex: daemon prio=3 where daemon meaning their Threads are running in background
• Java Thread ID ex: tid=0x000001111a51a811 ** This is the Java Thread Id obtained via java.lang.Thread.getId() and usually implemented as an auto-incrementing long 1..n**
• Java Thread State and detail ex: waiting for monitor entry [0xfffffffea5afb000] java.lang.Thread.State: BLOCKED (on object monitor)
• And lot more…
What is Heap dump?
• A heapdump is a snapshot of JVM memory. it shows the live objects on the heap along with references between objects. It is used to determine memory usage patterns and memory leak suspects.
• Java Heap can be categorized into three generations: -
• Young
• Tenured
• Permanent.

• Young generation has Eden Space and two survivor spaces. All newly created objects are kept in Eden Space and moved to one of the survivor space after it survives few gc’s. From one survivor space it moves to another. At an instant one of the survivor space is completely free. From the survivor space, objects are moved to the tenured generations. Permanent holds class data, such as describing classes and methods
• What is a Memory Leak Memory leak.
When objects are not removed from the heap even when they are not required to be present in the heap. This can be due to application code, application server code, database driver or third party jar files.

When to generate Thread/Heap Dump ?
• Very frequent FULL GC
• Lesser memory is reclaimed on each Full GC
• Available free heap keeps on decreasing over time
• Response time decreases
Troubleshoot
• Gather GC Information by adding the following JVM flags -Xloggc=filename -XX:+PrintGCTimeStamps -XX:+PrintGCDetails XX:-HeapDumpOnOutOfMemoryError

How to generate Thread/Heap Dump?
• Generate Thread Dump
• By using jstack
•Ex: jstack {pid} > stack-trace.log(Ref: http://docs.oracle.com/javase/7/docs/technotes/tools/share/jstack.html#options)
• By using jvisualvm
•After connecting to the java process one can find Threads tab -> Thread Dump button
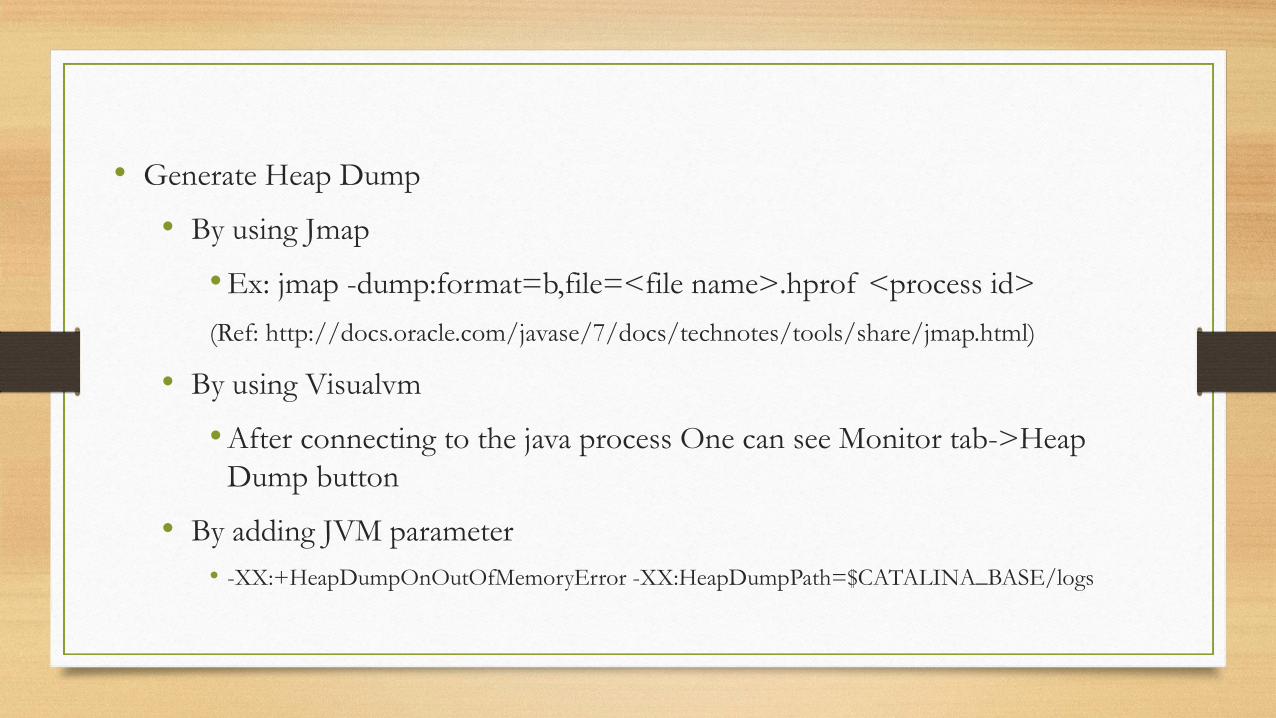
• Generate Heap Dump
• By using Jmap
•Ex: jmap -dump:format=b,file=<file name>.hprof <process id>
(Ref: http://docs.oracle.com/javase/7/docs/technotes/tools/share/jmap.html)
• By using Visualvm
•After connecting to the java process One can see Monitor tab->Heap Dump button
• By adding JVM parameter• -XX:+HeapDumpOnOutOfMemoryError -XX:HeapDumpPath=$CATALINA_BASE/logs

Best Practices and JVM Options
• Keep a watch on heap usage and use alert mechanisms.
• Keep a watch on production logs
• Free up unnecessary objects.
• Close all connections in the finally block
• Don’t keep too much data in session.
• Exception handling
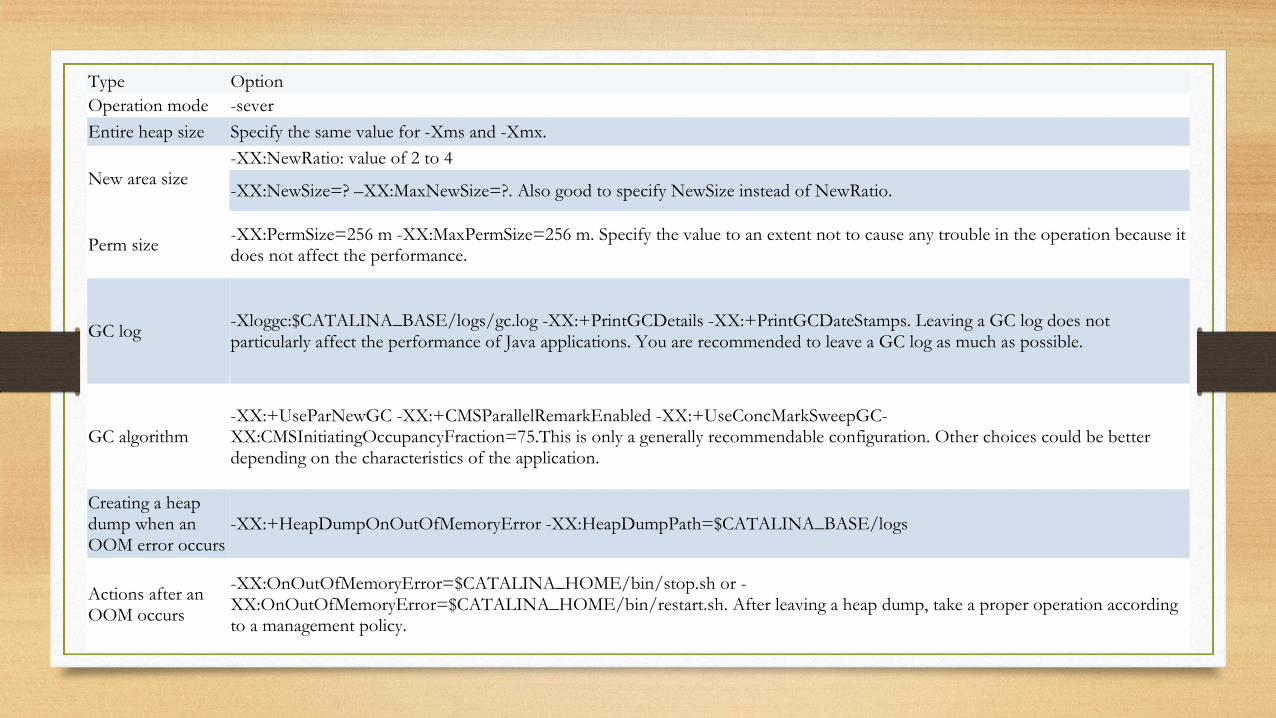
Type OptionOperation mode -sever
Entire heap size Specify the same value for -Xms and -Xmx.
New area size-XX:NewRatio: value of 2 to 4
-XX:NewSize=? –XX:MaxNewSize=?. Also good to specify NewSize instead of NewRatio.
Perm size-XX:PermSize=256 m -XX:MaxPermSize=256 m. Specify the value to an extent not to cause any trouble in the operation because it does not affect the performance.
GC log-Xloggc:$CATALINA_BASE/logs/gc.log -XX:+PrintGCDetails -XX:+PrintGCDateStamps. Leaving a GC log does not particularly affect the performance of Java applications. You are recommended to leave a GC log as much as possible.
GC algorithm-XX:+UseParNewGC -XX:+CMSParallelRemarkEnabled -XX:+UseConcMarkSweepGC-XX:CMSInitiatingOccupancyFraction=75.This is only a generally recommendable configuration. Other choices could be better depending on the characteristics of the application.
Creating a heap dump when an OOM error occurs
-XX:+HeapDumpOnOutOfMemoryError -XX:HeapDumpPath=$CATALINA_BASE/logs
Actions after an OOM occurs
-XX:OnOutOfMemoryError=$CATALINA_HOME/bin/stop.sh or -XX:OnOutOfMemoryError=$CATALINA_HOME/bin/restart.sh. After leaving a heap dump, take a proper operation according to a management policy.

Ref and suggestion links to understand more this topic
•http://www.cubrid.org/blog/dev-platform/understanding-java-garbage-collection/ - To understand garbage collection
•http://www.cubrid.org/blog/dev-platform/how-to-monitor-java-garbage-collection/ - To Monitor Garbage Collection
•https://blog.codecentric.de/en/2011/08/create-and-understand-java-heapdumps-act-4/
•http://www.cubrid.org/blog/dev-platform/the-principles-of-java-application-performance-tuning/
•http://javabook.compuware.com/content/memory/how-garbage-collection-works.aspx

MemoryAndThreadExample.zip
Find attached zip project, I have added MemoryLeak and Deadlock example. That we will analysed using jvisualVM

Suggestion and
Question / Answer

Thank You!!!


![장애처리와튜닝프로세스(Thread Dump 분석 - Opennaru, Inc.opennaru.com/wp-content/uploads/2018/02/KHAN_Thread_Dump... · 2018-02-27 · KHAN [apm] 스레드덤프분석예시](https://img.dokumen.tips/doc/110x75/5f15e71393c9b830ad4e49f1/eoeeeoethread-dump-e-opennaru-inc-2018-02-27.jpg)