Embed Size (px)
Citation preview

App/Server MonitoringJaemok Jeong
2016. July.
©jmjeong 2016 1

It's not in produc.on unless it’s monitored”.
— Theo Schlossnagle
©jmjeong 2016 2

If you can not measure it, you can not improve it.”
— Lord Kelvin
©jmjeong 2016 3

What is measured improves— Peter Drucker
©jmjeong 2016 4
Ques%on to answer
• How fast is my system?
• Is it faster than last month?
• Did our last deploy affect database performance?
• How much ;me do we spend calling external web services?
©jmjeong 2016 5

More ques)ons
• How many errors do we have a day?
• How many failed logins?
• How many successful logins?
©jmjeong 2016 6

And more ques,ons!
• How many orders did we have today?
• How many orders did we have today from Android version 2.0.56?
• How many rejected orders did we have?
©jmjeong 2016 7

To answer all of this, you need a wayto track difference numbers
©jmjeong 2016 8
©jmjeong 2016 9

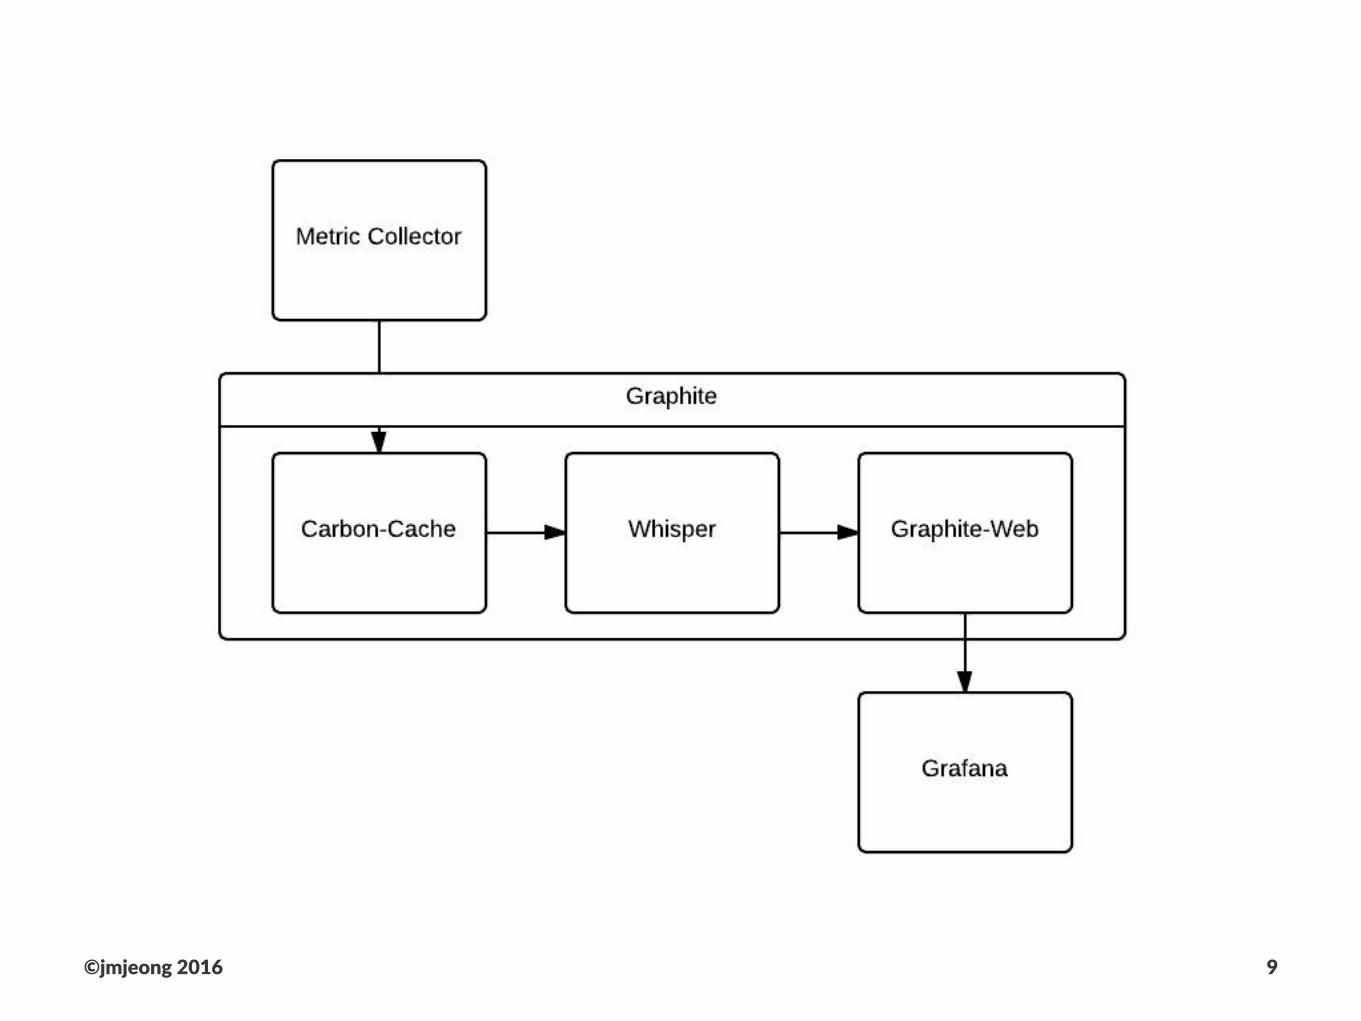
Graphite
• A Highly Scalable Real-1me Graphing System
• h9p://graphite.wikidot.com/
• Components
• carbon - a daemon that listens for 1me-series data.
• whisper - a simple database library for storing 1me-series data.
• webapp - a (Django) webapp that renders graphs on demand.
©jmjeong 2016 10

©jmjeong 2016 11

Data Reten(on
• Default se+ngs
• 6 hours of 10 second data
• 1 week of 1 minute data
• 5 years of 10 minute data
• That's amounts to ~3.2MB per metric
• Configurable
[server_load]priority=100pattern- ^servers\.retentions = 60:43200,900:350400
©jmjeong 2016 12
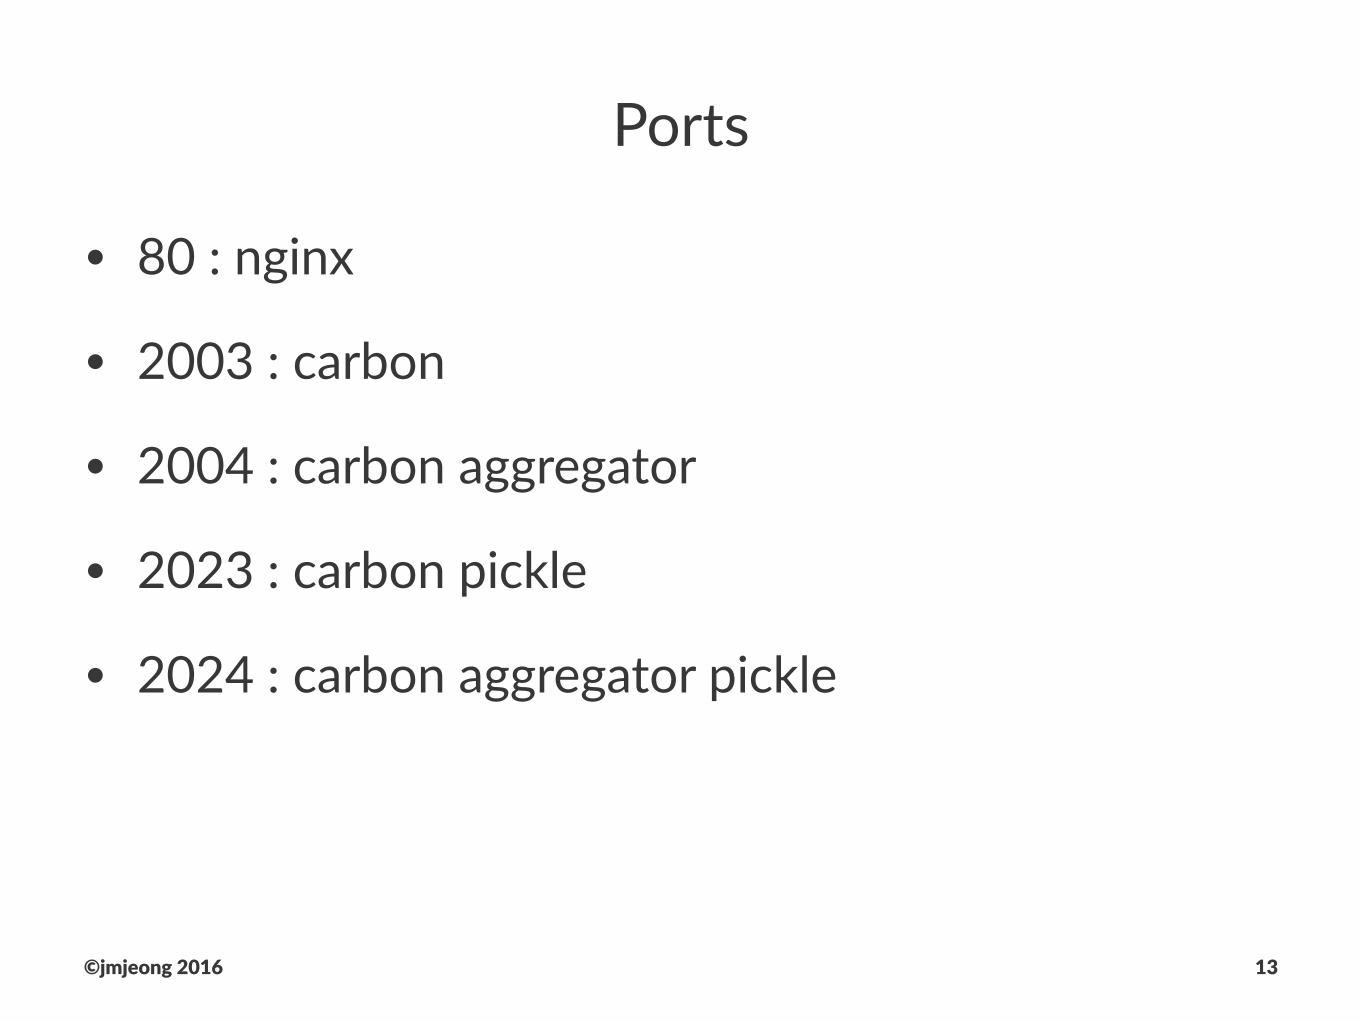
Ports
• 80 : nginx
• 2003 : carbon
• 2004 : carbon aggregator
• 2023 : carbon pickle
• 2024 : carbon aggregator pickle
©jmjeong 2016 13

The Graphite Message Format
metric_patch value timestamp(UNIX epoch time)\n
ex) foo.bar.baz 42 74857843
©jmjeong 2016 14

Populate Data
PORT=2003SERVER=graphite.your.orgecho "local.random.diceroll 4 `date +%s`" | nc -c ${SERVER} ${PORT}
©jmjeong 2016 15

node.js
var graphite=require('graphite')
var client = graphite.createClient('plaintext://server:2003/');var metrics = { foo.bar.baz : 72, foo.bar.test : 100 foo.bar.size : 1024 };client.write(metrics, Date.now(), function(err) { if (err) console.error(err);})
another nota)on:
var metrics = { foo.bar : {baz : 72, test : 100, size : 1024 }};
©jmjeong 2016 16

Grafana
• Beau&ful metric & analy&c dashboards
• Use graphite as backend storage
• h;p://grafana.org/
• Live Demo
©jmjeong 2016 17

©jmjeong 2016 18

Statsd
• A simple NodeJS daemon that listens for messages on a UDP port
• It parses the messages, extracts metrics data, and periodically flushes the data to graphite
Your app send data to StatsD
©jmjeong 2016 19

Usage
<metricname>:<value>|<type>
echo "foo:1|c" | nc -u -w0 127.0.0.1 8125
©jmjeong 2016 20

StatsD Metric Types
• Coun&ng - number of orders per sec
• gorets:c|c
• At each flush the current count is sent and reset to 0
• Sampling
• gorets:1|c|@0.1
• Sent sampled every 1/10th of the &me
©jmjeong 2016 21
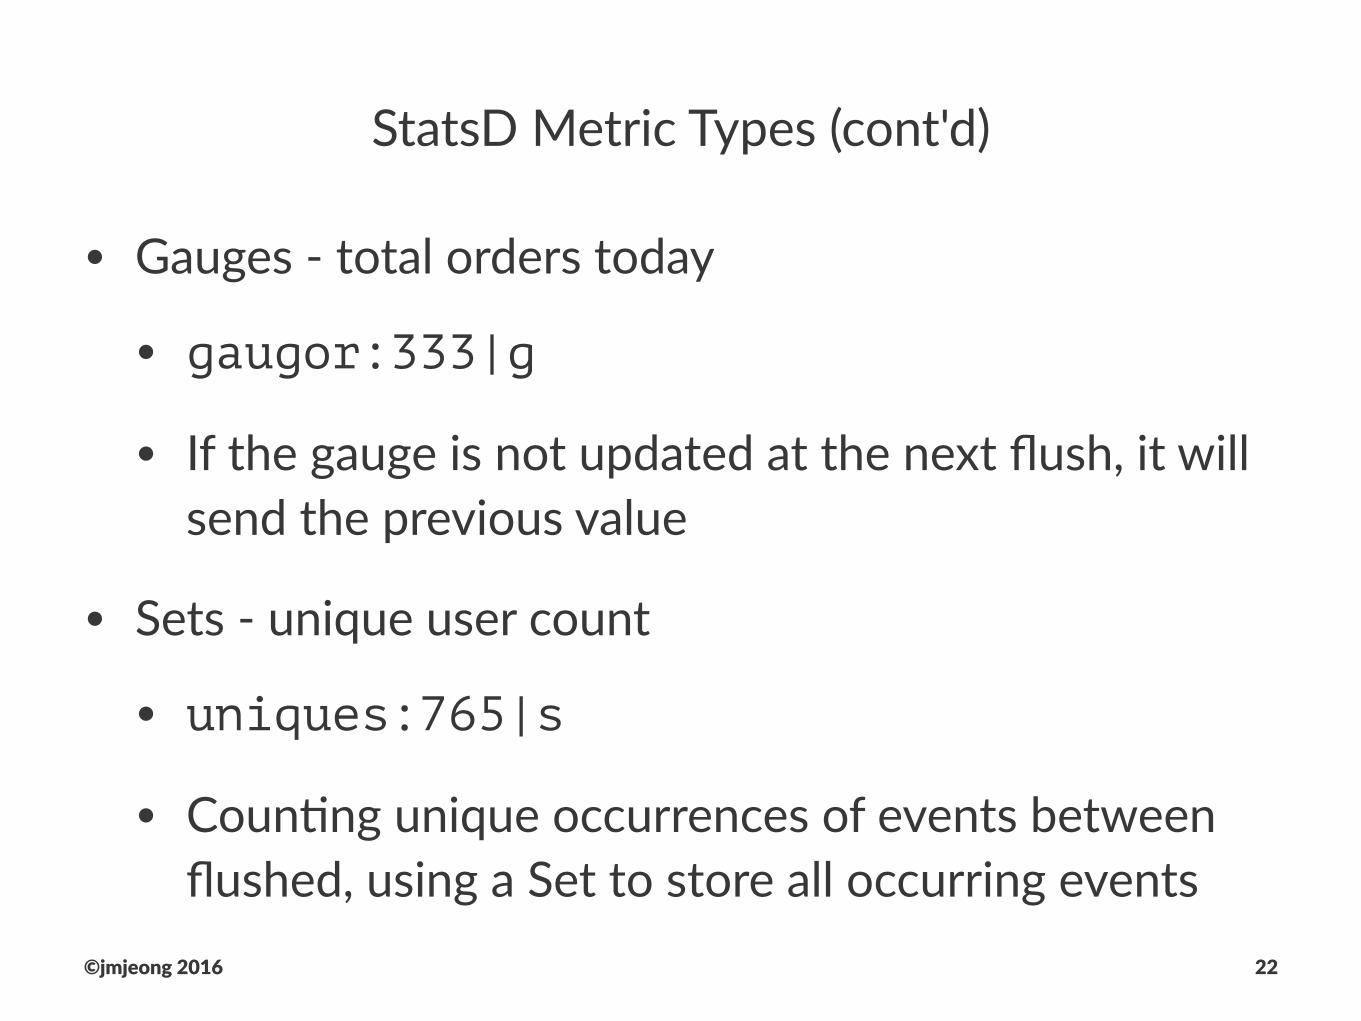
StatsD Metric Types (cont'd)
• Gauges - total orders today
• gaugor:333|g
• If the gauge is not updated at the next flush, it will send the previous value
• Sets - unique user count
• uniques:765|s
• Coun?ng unique occurrences of events between flushed, using a Set to store all occurring events
©jmjeong 2016 22

StatsD Metric Types (cont'd)
• Timing - )me to make an order
• glork|320|ms|@0.1
©jmjeong 2016 23

node-statsd-client
var SDC = require('statsd-client');var sdc = new SDC({host:host,port:port,prefix:prefix});
sdc.increment('sample.counter');sdc.increment('sample.mycounter',10);sdc.gauge('sample,gauge', randomInteger(100));
var timer=new Date();sdc.timing('sample.timer',timer);
sdc && sdc.close();
©jmjeong 2016 24

For log & crash search
©jmjeong 2016 25
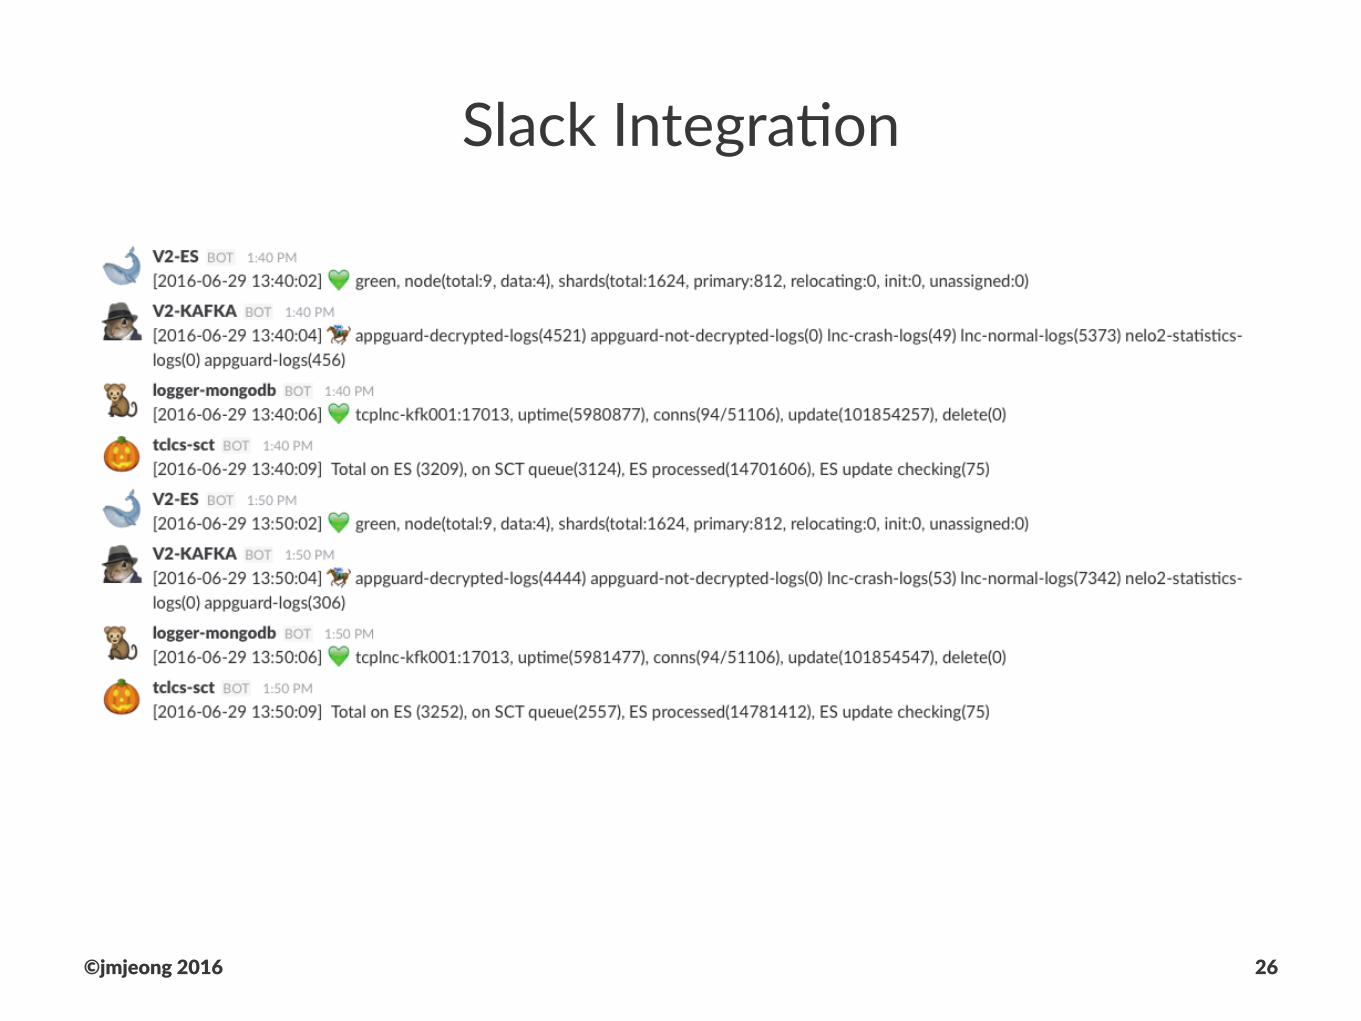
Slack Integra-on
©jmjeong 2016 26

var alarmUrl = conf.alarm.info.url;var payload = { "channel": "monitoring", "username": title.name, "text": ['[', moment().format('YYYY-MM-DD HH:mm:ss'), '] ', icon, ' ', data].join(''), "icon_emoji": title.icon};request({ url: alarmUrl, method: 'POST', json: payload}, function(err, resp, body) { if(err) { logger.error('[sendNoti] error;', err); } else { logger.debug('[sendNoti] result; '+body.toString()); }});
©jmjeong 2016 27

graphite naming conven/on
• {env}.{metric}.{region}.{hostname}
• lnc.summary.* - for All Projects
• count, size, totalsize
• denySize, denyCount, ...
• lnc.{group}.{appkey}.* - for each Projects
• lnc.internal.*
• lnc.internal.sct.stats.*
• lnc.internal.kaCa.lag.*
©jmjeong 2016 28

©jmjeong 2016 29

©jmjeong 2016 30
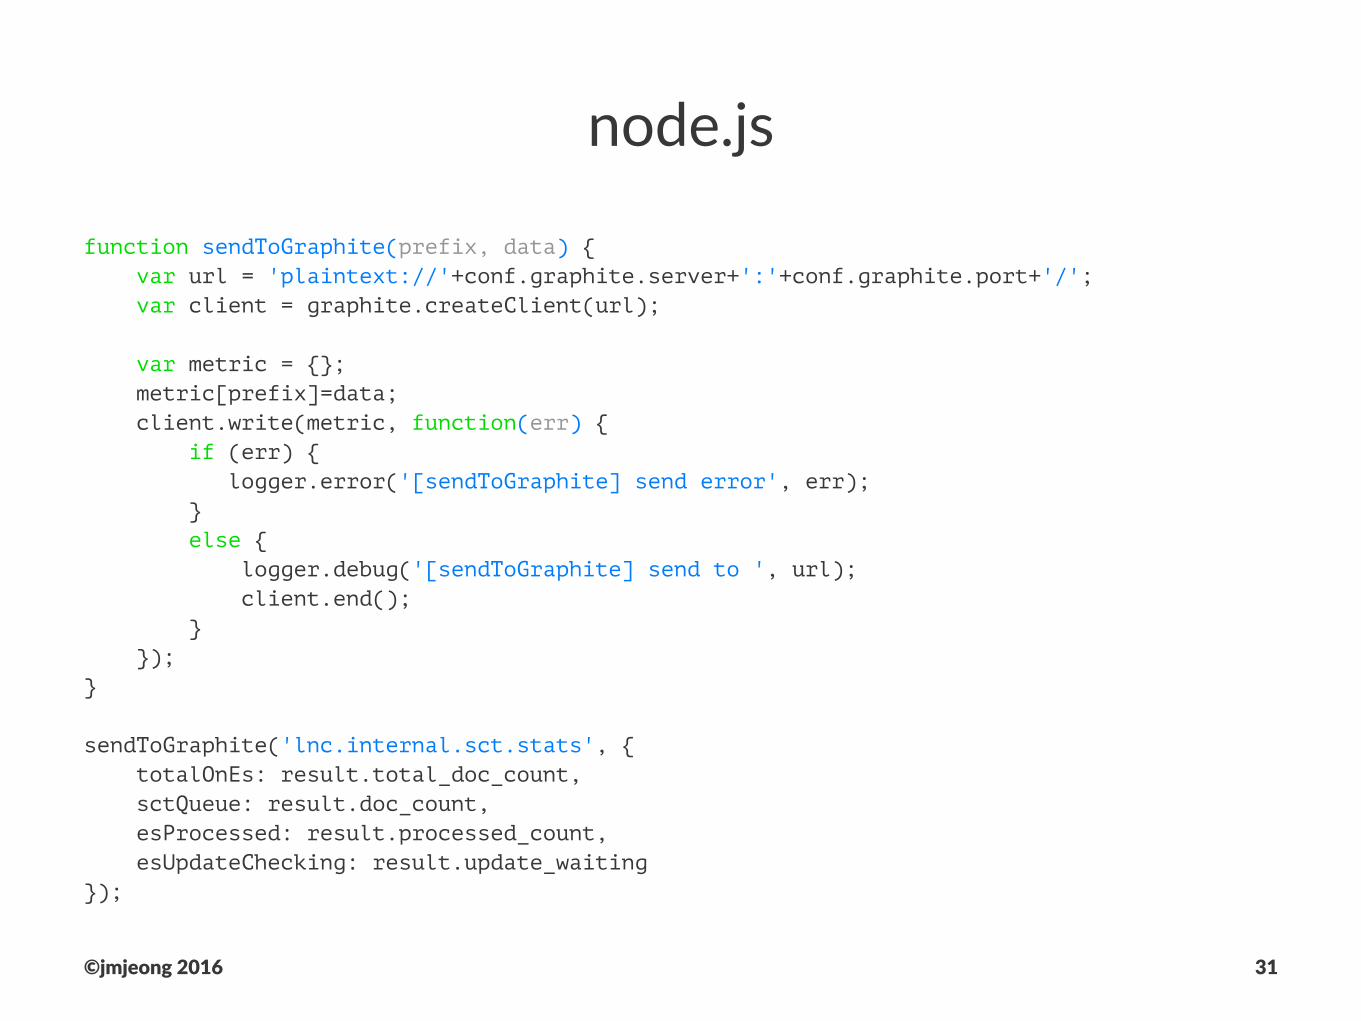
node.js
function sendToGraphite(prefix, data) { var url = 'plaintext://'+conf.graphite.server+':'+conf.graphite.port+'/'; var client = graphite.createClient(url);
var metric = {}; metric[prefix]=data; client.write(metric, function(err) { if (err) { logger.error('[sendToGraphite] send error', err); } else { logger.debug('[sendToGraphite] send to ', url); client.end(); } });}
sendToGraphite('lnc.internal.sct.stats', { totalOnEs: result.total_doc_count, sctQueue: result.doc_count, esProcessed: result.processed_count, esUpdateChecking: result.update_waiting});
©jmjeong 2016 31

Demo
©jmjeong 2016 32