Embed Size (px)
Citation preview

Using Reference Materials to Meet Validation and Verification Requirements

5
Bio-Specimens used in Molecular Diagnostics
Most clinical tissue samples are preserved in FFPE
FFPE samples are now being used for molecular diagnostic testing
FFPE based studies: every specimen is different in terms of % tumor contribution to the specimen and % mutation contribution to the tumor
• Therapeutic choices are made based upon these results• False positive and false negative results are detrimental to the patient
FFPE Sample
Cancer Patient
DNA Extraction Diagnosis

3
External Quality Assessment Proficiency Testing Scheme - 2014
Only 70% of laboratories passed the proficiency test.False -negatives and false-positives were the main sources of error.
0
5
10
15
20
25
30
35
40
Per
cen
tage
of
Inco
rrec
t R
esu
lts
EGFR Sample Tested
EGFR Genotyping ErrorsExternal Quality Assessment 2014

What is the impact of assay failure in your laboratory and how doyou monitor for it?
7

5
HDx™ Reference Standards - Precise Allelic FrequenciesR
efe
ren
ce
Slid
e
FFPE Reference Standards
IHC Reference Slides
FISH Reference Slides DNA Reference Standards
Tumor sample
Diagnosis
Therapy
DNA extraction
GenotypingCytogenetics
Histology
Validation:Cost, Risk and Technical Possibilities…

7
The Validation Balance
“Validation is always a balance between costs, risks and technical possibilities”.
(CAN-P-4E: clause 5.4.5.3- Note 3)

8
Verification and Validation Definitions
• Confirmation by examination and provision of objective evidence that the particular requirements for a specific intended use are fulfilled.
Verification (ISO 9000)
• Confirmation by examination and provision of objective evidence that specified requirements have been fulfilled.
Validation (ISO 9000)
• Safe and useful service to clinicians and patients.
• Validation is more than a one time activity and if used continually can improve the assessment of test accuracy and performance.
Purpose

9
General Validation Requirements
General Validation Requirements
Test development – protocols and pooling parameters
Test validation – establish performance parameters (sensitivity, specificity, reproducibility etc.)
Platform validation – performance and confidence intervals including software validation

10
Intent Comparison
US - CLIA
• Regulate Laboratories –limited scope.
• Test used that is not FDA cleared/approved establish performance characteristics before release of test results.
• No oversight of clinical validity.
• Oversight occurs through biennial survey – after testing has started.
• Test complexity framework.
US - FDA QSR (Potential)
• Regulate manufactures.
• Premarket clearance evaluates clinical validity.
• Clinical validity – accuracy with which the test identifies, measures or predicts the presence or absence of a clinical condition or predisposition in a patient.
• Risk based framework.

11
Requirements Comparison
• Regulates LDTs made and used within a single facility.
• Focus on accurate reproducible and reliable tests.
• Requirement for analytical validation prior to use.
• Requirements for proficiency testing.
US - CLIA
• Address clinical validity
• Risk based approach to implementation.
• Process validation.
• Design verification and validation.
• Adverse Event Reporting.
• Device Listing and Pre-market Approval (for some devices).
US - FDA QSR
(Proposed)

Canadian Regulations
• Accreditation of medical laboratories in Canada is regulated by provincial health authorities, five of them having accreditation bodies.
• Each of the bodies has developed its own standards implementing ISO documents which generally follows ISO 15189 (balance of business and technical assurance).
• Risk based scale to validation based on if the test is developed in house, uses nonstandard methods, originates from scientific literature or de novo.
• Requirements for proficiency testing.
• Importance of method validation.
Canada (CAN-P-4E)

13
FDA QSR Verification and Validation (Sec. 820.30 Design controls)
• Validate device design under standard operating parameters.
• Design input meets design output.
• Part of design history file.
Design Verification
• Validate device design through production units.
• Conform to intended use of product.
• Part of design history file.
Design Validation

14
Cost, Risk and Technical Possibilities…
• More regulation may mean more cost but there are still opportunities for innovation.
• There is opportunity for clinical laboratories to work with the FDA and CLIA to develop an appropriate regulatory framework.
Cost
• The FDA’s plans to regulate LDTs are both risk based and to reduce risk.
• Most accreditation programs logically consider risk in the level of validation required.
• Risks are changing, many LDT’s are moving beyond their traditional boundaries.
Risk
• Development of new technologies.
• Changes to the standard of care.
• Increasing availability of reference materials, including HDx reference materials.
Technical Possibilities

15
Final Thoughts
Final Thoughts
• Use of reference materials can assist in validation studies but there is still a strong focus on use of patient specimens, in spite of increasingly available reference materials.
• Where reference materials are mentioned, these focus on cell line DNA over plasmids.
• The future for FDA regulation of LDTs is being developed. The impact of this regulation remains for debate.

16
Key Resources
Key Resources
• http://www.nature.com/ejhg/journal/v18/n12/full/ejhg2010101a.html
• http://www.horizondx.com/applications/applying-our-formats/implementation-and-accreditation-of-iso-15189
• http://www.horizondx.com/applications/applying-our-formats/next-generation-sequencing-guidelines-new-york-state
• ISO 15189:2007
• ISO 17025:2005
• http://www.fda.gov/downloads/MedicalDevices/DeviceRegulationandGuidance/GuidanceDocuments/UCM416685.pdf

Case Study at Credit Valley Hospital
A Discussion About the Value of Including Low Positive DNA Control in Each Assay

18
Methodology
EGFR mutation status test: Entrogen commercially available kit
Instrument: Roche LC480 Real Time PCR
Allele discriminating assays rely upon the ability of the probes to bind correctly and the software setting to correctly set a crossing point baseline
Controls: HDx™ Reference Standards to
Validate assay and establish detection
Limits for each mutation

Assay Validation and Specific Crossing Points Cut-offs
20%
10%
5%
Percentage Control CP Mutation CP
L86
1Q
20% 30.35 29.66 30.37 30.58 30.66 30.4510% 29.58 30.17 31.16 31.63 32.08 32.075% 29.50 29.72 31.94 32.82 33.18 33.261% 30.22 29.65 29.55 37.48 37.29 36.120% 29.39 29.20 30.26 n/a n/a n/a
1%
LOD Validation Curve with HDx™ Reference Standards EGFR L861Q
19

Validation Issues: Background Amplification in the G719X Reaction
Mutation Positive Control
Noise band
Patient (Cp 37)
Negative control Cp can lead to a false positive result for the patient
Manually changing the baseline hides quality issues such as inefficient probe binding or PCR contamination in the blank
Mutation Negative Control
Mutation Negative Control
Noise band
20
Inefficient probe binding and background noise is seen most in G719X and T790M

Validation Issue: Separation from Background Amplification CP Values
T790M and G719X negative control and 1% Low Positive control values overlap
Crossing point value from 2.5% DNA HDx™ Reference Standard for each mutation provides best separation from background amplification
2.5% Crossing Point Value used as a cut off Low Positive Control now included in each assay to remove false positives
20.0
22.0
24.0
26.0
28.0
30.0
32.0
34.0
36.0
38.0
40.0
T790M Exon 19del L858R L861Q G719X
2.5%
1%
Neg Ctl
21
Cro
ssin
g P
oin
t
EGFR Variant

Low Positive Control helps identify and correct false positives from Non-Specific Probe Binding
EGFR G719X mutations were safely ruled out by use of the 2.5% cut-off value.
G719X ReactionKit PC (28.24)
2.5% Control (31.85)
Patient A (34.70)
Patient B
Negative Control
NTC

Added Value from Inclusion of a Low Positive Control
Inclusion of a 2.5% low positive control allows background amplification to be ruled out
Background amplification can lead to false positive diagnostic results
Big Picture
Cancer patients awaiting treatments from diagnostic results
False positives TKI therapy for true EGFR WT patients• Proven to be detrimental over first-line chemotherapy (Patton et al., 2014)
Diagnostic Test Issue: Low Mutation Content Below Cutoff
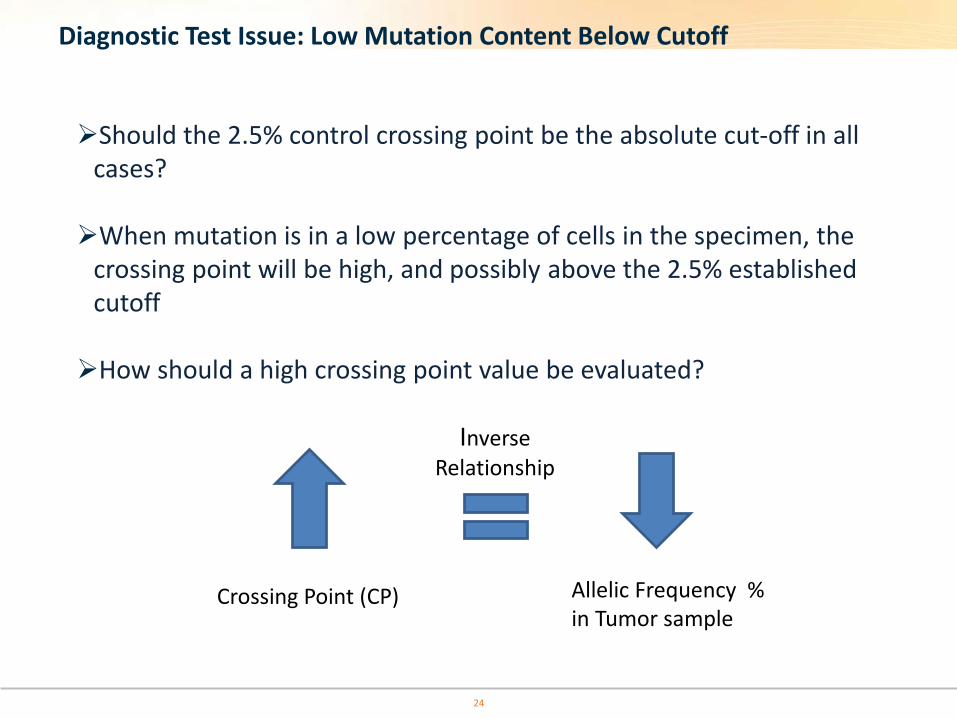
Should the 2.5% control crossing point be the absolute cut-off in all cases?
When mutation is in a low percentage of cells in the specimen, the crossing point will be high, and possibly above the 2.5% established cutoff
How should a high crossing point value be evaluated?
Inverse Relationship
24
Crossing Point (CP) Allelic Frequency % in Tumor sample

Low Positive Control as Absolute Cut Off?
Patient 1: 58 year old female Metastatic lung cancer• Mutation negative for all mutations except L858R• L858R crossing point slightly higher than 2.5% control• Qualitative assessment of amplification curve suggests true positive at about 1-2%
L858R Reaction
Kit PC (29.31)
Patient C (34.41)
2.5% Control (33.58)
Neg Ctl/NTC

Low Positive Control as Absolute Cut Off?
Patient 2: 58 Year old female with right lung adenocarcinoma • Mutation negative except for Exon 19del• Exon 19del crossing point slightly higher than 2.5% control • Qualitative assessment suggests this is a true positive, at about 1-2%
Exon 19del ReactionKit PC (28.39)
2.5% Control (30.71)
Patient D (33.30)
Neg Ctl/NTC
Conclusion – Qualitative and Quantitative QC for each run needed
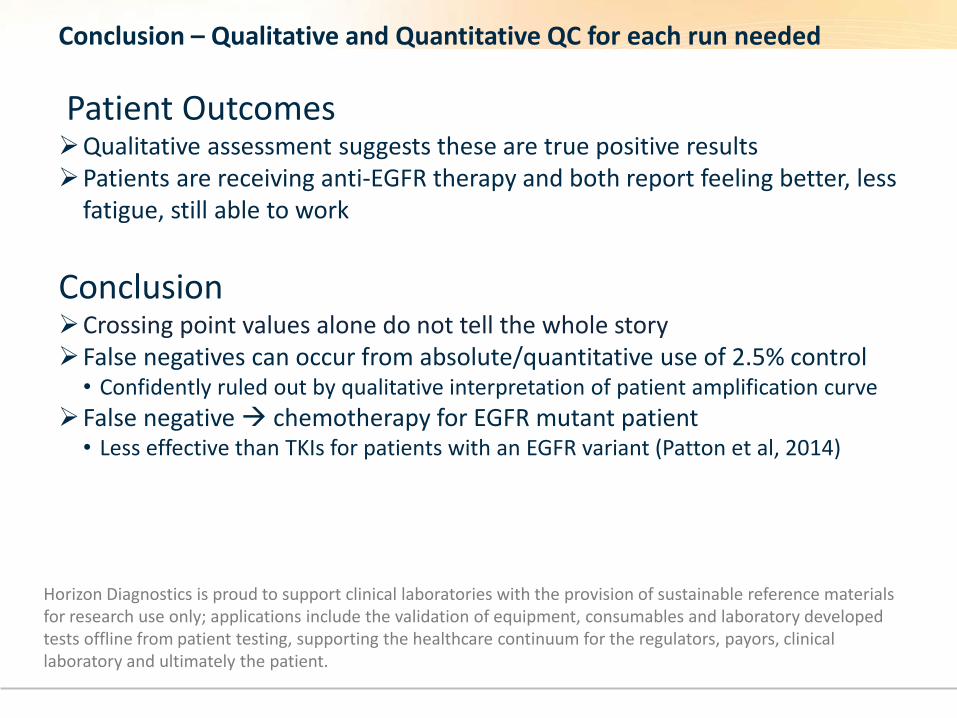
Patient OutcomesQualitative assessment suggests these are true positive resultsPatients are receiving anti-EGFR therapy and both report feeling better, less
fatigue, still able to work
ConclusionCrossing point values alone do not tell the whole storyFalse negatives can occur from absolute/quantitative use of 2.5% control • Confidently ruled out by qualitative interpretation of patient amplification curve
False negative chemotherapy for EGFR mutant patient • Less effective than TKIs for patients with an EGFR variant (Patton et al, 2014)
Horizon Diagnostics is proud to support clinical laboratories with the provision of sustainable reference materials for research use only; applications include the validation of equipment, consumables and laboratory developed tests offline from patient testing, supporting the healthcare continuum for the regulators, payors, clinical laboratory and ultimately the patient.

Analytical Utility of a Low Positive Control
Inclusion of a 2.5% low positive control allows elimination of false positives
Low positive controls supply a qualitative reference for true amplification so that low positive results can be reported with confidence
Reduce the risk of false negative reports
It a QC check for each run
Provide consistency between patient EGFR mutation status experiments
28
Reduction in False Negatives and False Positive Results is needed for better future PT results and diagnostic testing
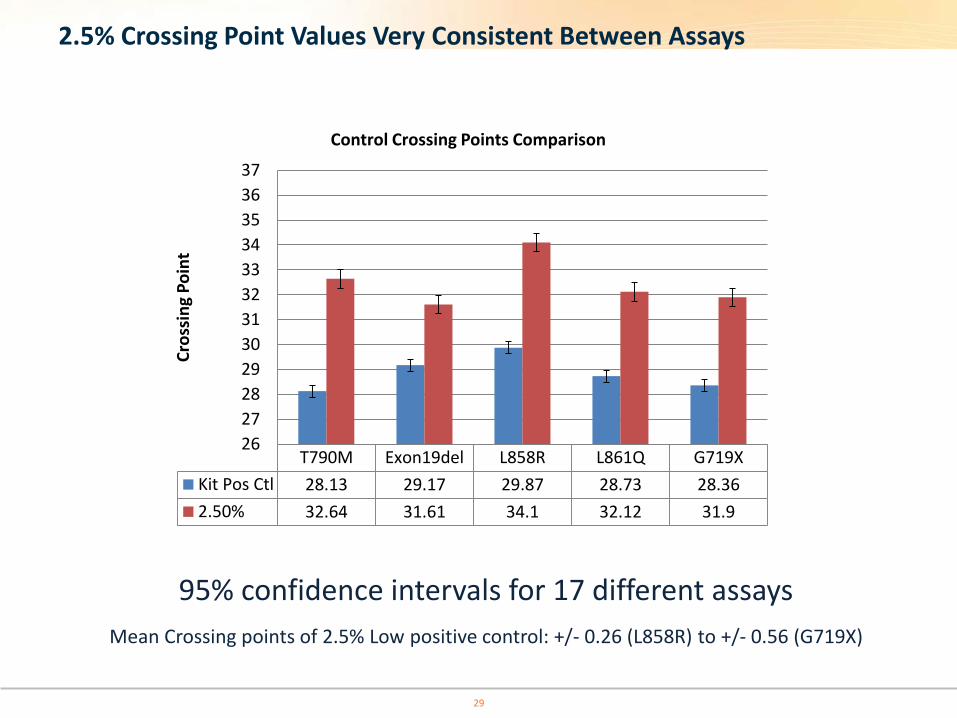
2.5% Crossing Point Values Very Consistent Between Assays
T790M Exon19del L858R L861Q G719X
Kit Pos Ctl 28.13 29.17 29.87 28.73 28.36
2.50% 32.64 31.61 34.1 32.12 31.9
26
27
28
29
30
31
32
33
34
35
36
37C
ross
ing
Po
int
Control Crossing Points Comparison
29
95% confidence intervals for 17 different assays
Mean Crossing points of 2.5% Low positive control: +/- 0.26 (L858R) to +/- 0.56 (G719X)

The Value of a Low Positive Control at Credit Valley Hospital
Case study of how a Canadian clinical laboratory used RUO products to validate their laboratory developed test
Credit Valley Hospital includes a 2.5% MAF reference standard for all their EGFR diagnostic tests
• Individual EGFR Base-Seq DNA HDx™ Reference Standards are ordered and pooled to a 2.5% mutant allelic frequency
• A Low Positive Control has also been implemented for the BRAF, KRAS and NRAS testing at this laboratory
This gives them the confidence that their assay is working today, and also a qualitative benchmark for true amplification when patient results are close to cut off CT values
30
EGFR Low Positive Control
KRAS Low Positive Control
BRAF Low Positive Control
NRAS Low Positive Control

7
“The low positive control is critical to my confidence in the lab’s diagnostic reporting and analytical results.”
Dr. Marsha Speevak, Discipline Lead Molecular Genetics and Cytogenetics, Credit Valley Hospital, Trillium Health Partners
What is the impact of assay failure in your laboratory and how doyou monitor for it?

Assay Plate Set Up – Supplemental Data
Credit Valley Uses 4 lanes of controls in their kit
1. Kit PC
2. Blank
3. Kit Negative
4. Horizon Dx pooled 2.5% Control