Embed Size (px)
Citation preview

Sunghyon Kyeong Severance Biomedical Science Institute,
Yonsei University College of Medicine
Topological Data Analysis-Methods and Examples-

Sunghyon Kyeong (Yonsei University) | [email protected] | Topological Data Analysis: Methods and Examples | p
Contents• Brief overview of topological data analysis • About Ayasdi
Startup company providing solutions for data analytics • Topological data analysis - Methods • Applications to medical science data • Applications to social science data
2

Brief Overview of Topological Data Analysis

Sunghyon Kyeong (Yonsei University) | [email protected] | Topological Data Analysis: Methods and Examples | p
Machine Learning
4
•Supervised Machine Learning → Classification of new input data (LDA, bayesian, support vector machine, neural network, and so on)
•Unsupervised Machine Learning → Clustering of given dataset / Community detection (k-means clustering, modularity optimisation, ICA, PCA, and so on)
•Topological Data Analysis→ partial clustering with allowing overlaps among clusters

Sunghyon Kyeong (Yonsei University) | [email protected] | Topological Data Analysis: Methods and Examples | p
World Interests for TDA
5
Heat map for viewers of my TDA slide at sliceshare (for 2500 viewers during 2015.2.14. - 2014.11.31.)

Data has Shape

Raw Data (diabetes related data)
An example

Shape has Meaning

Normal
Type II diabetes
Type I diabetes
An example

Meaning drives “Values”
Sunghyon Kyeong (Yonsei University) | [email protected] | Topological Data Analysis: Methods and Examples | p
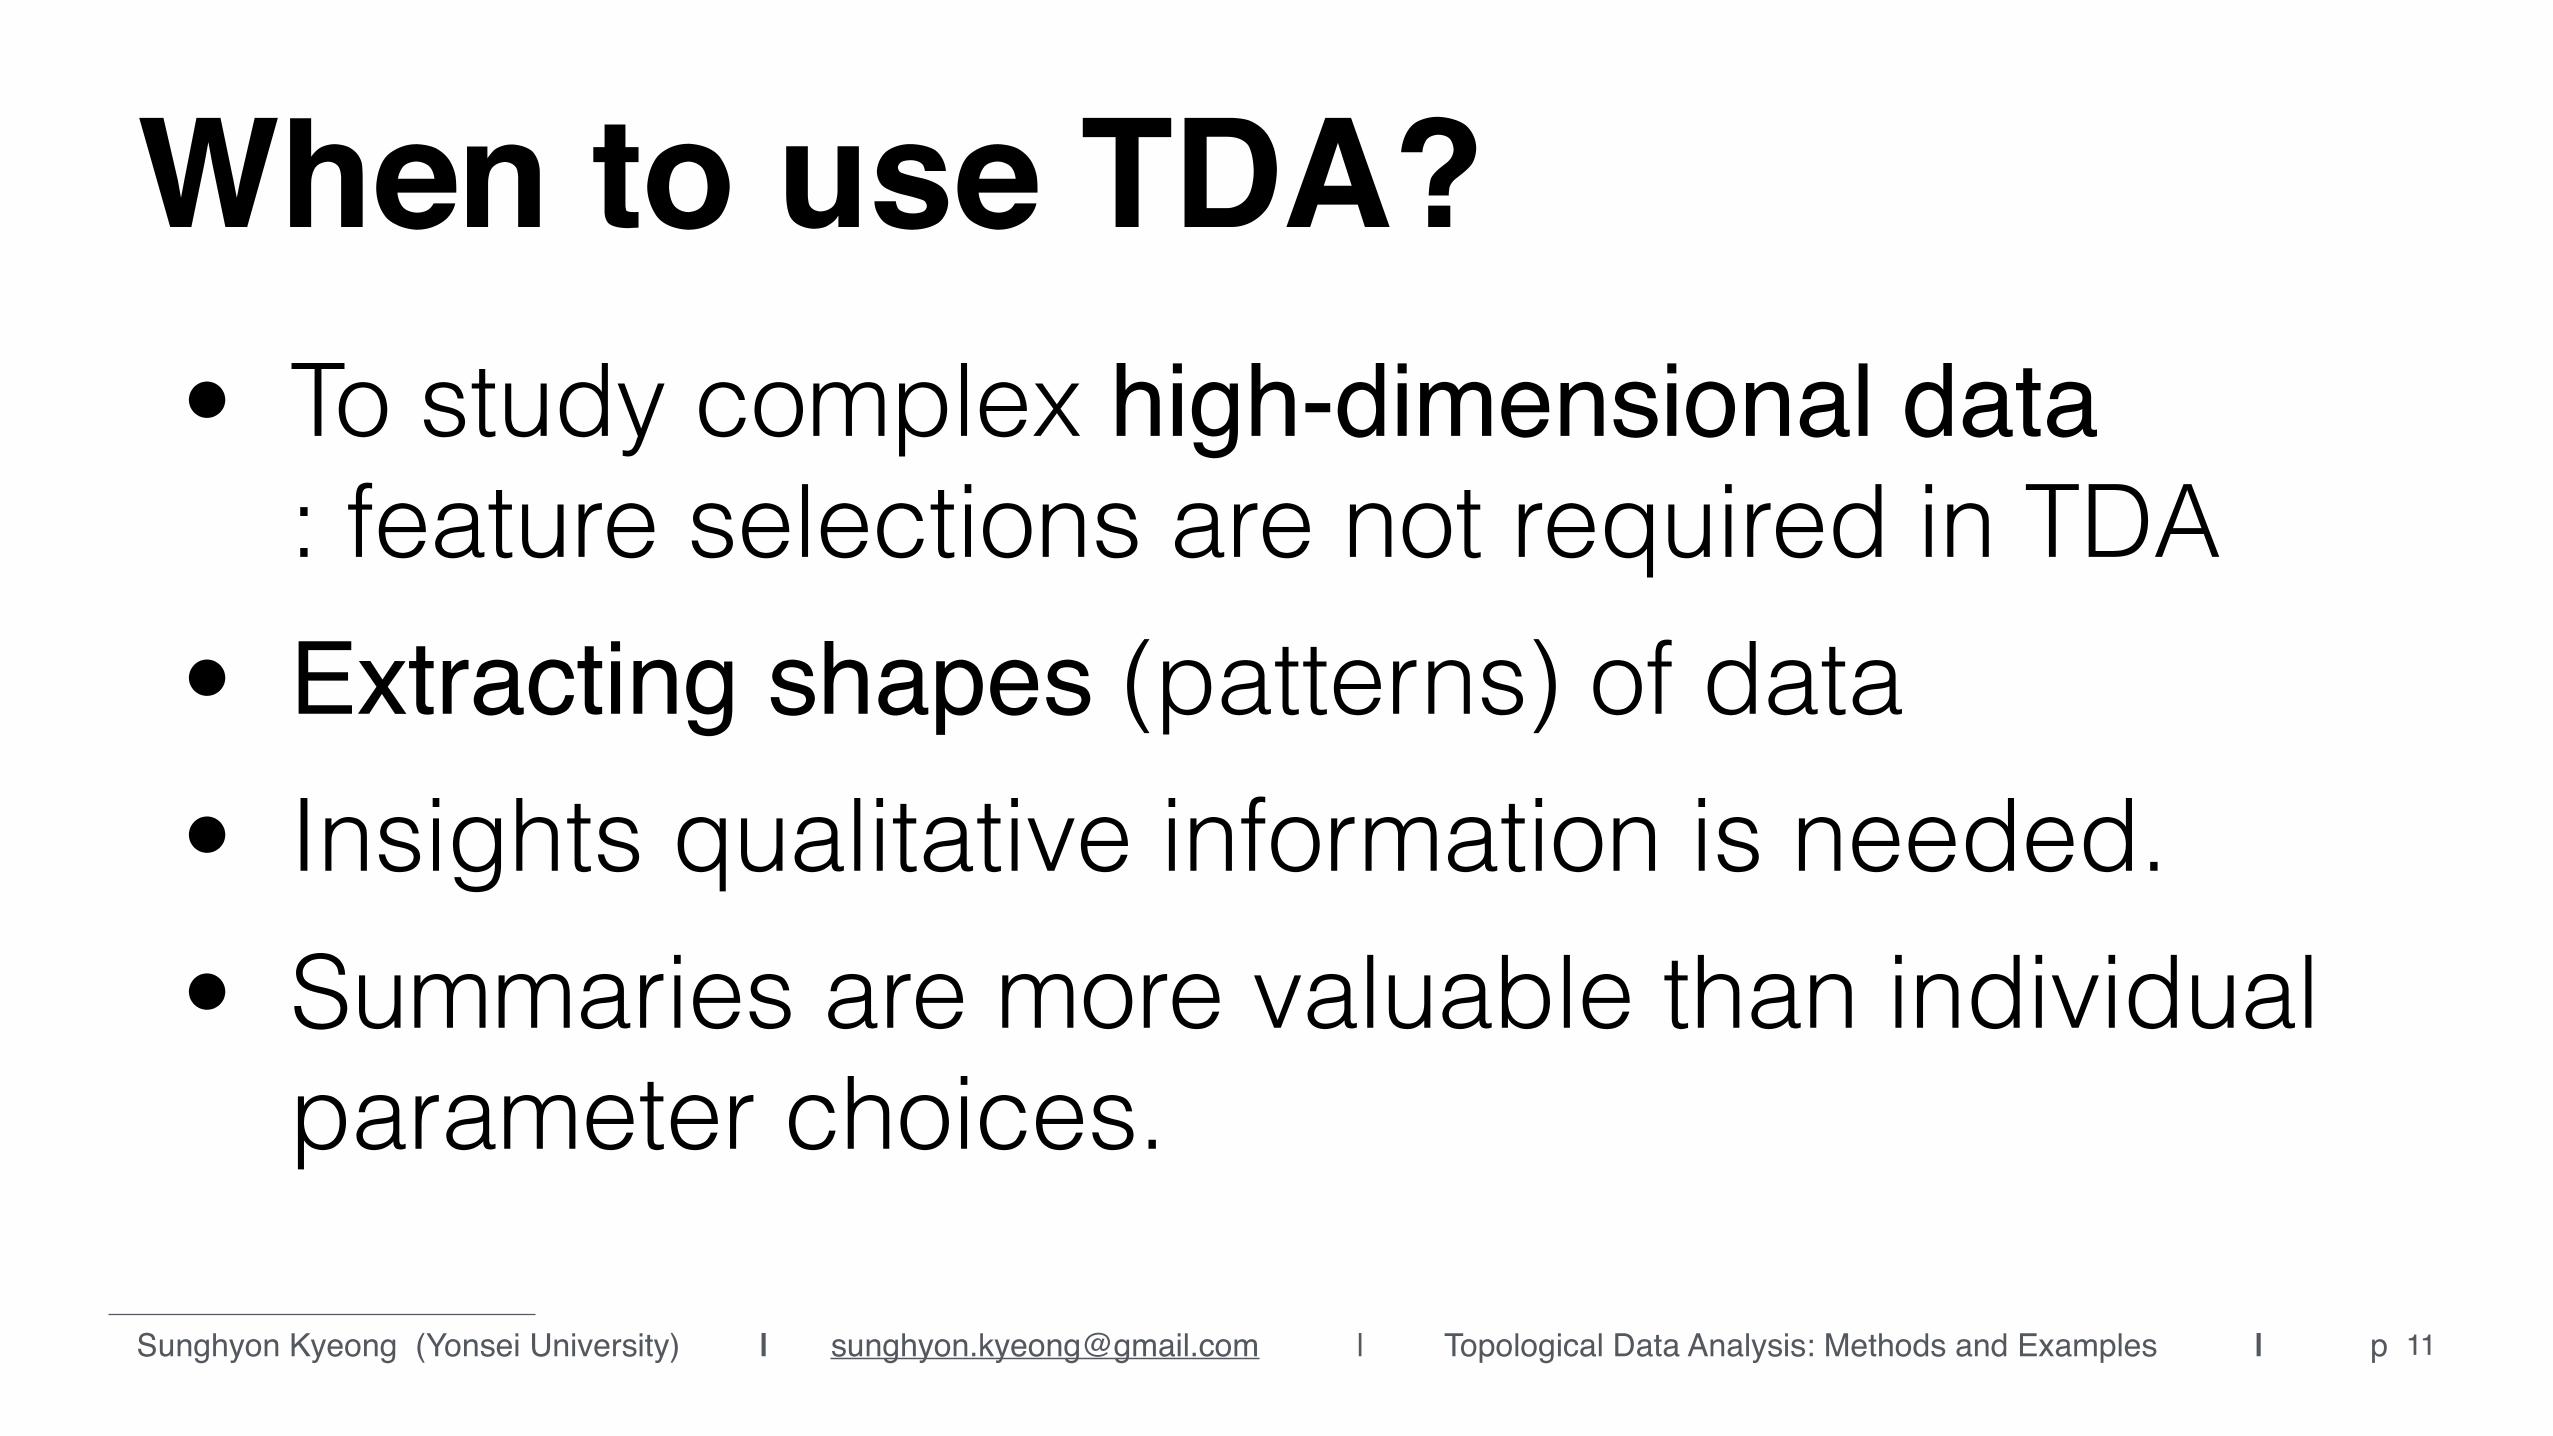
When to use TDA?
11
• To study complex high-dimensional data : feature selections are not required in TDA
• Extracting shapes (patterns) of data • Insights qualitative information is needed. • Summaries are more valuable than individual
parameter choices.

Geometric
Topology
AlgebraicBetti0: 8 Betti1: 5
Betti0: 10 Betti1: 5
Topology
Betti0: clusters Betti1: holes Betti2: voids
mathematically defined “holes” in data
Sunghyon Kyeong (Yonsei University) | [email protected] | Topological Data Analysis: Methods and Examples | p 13
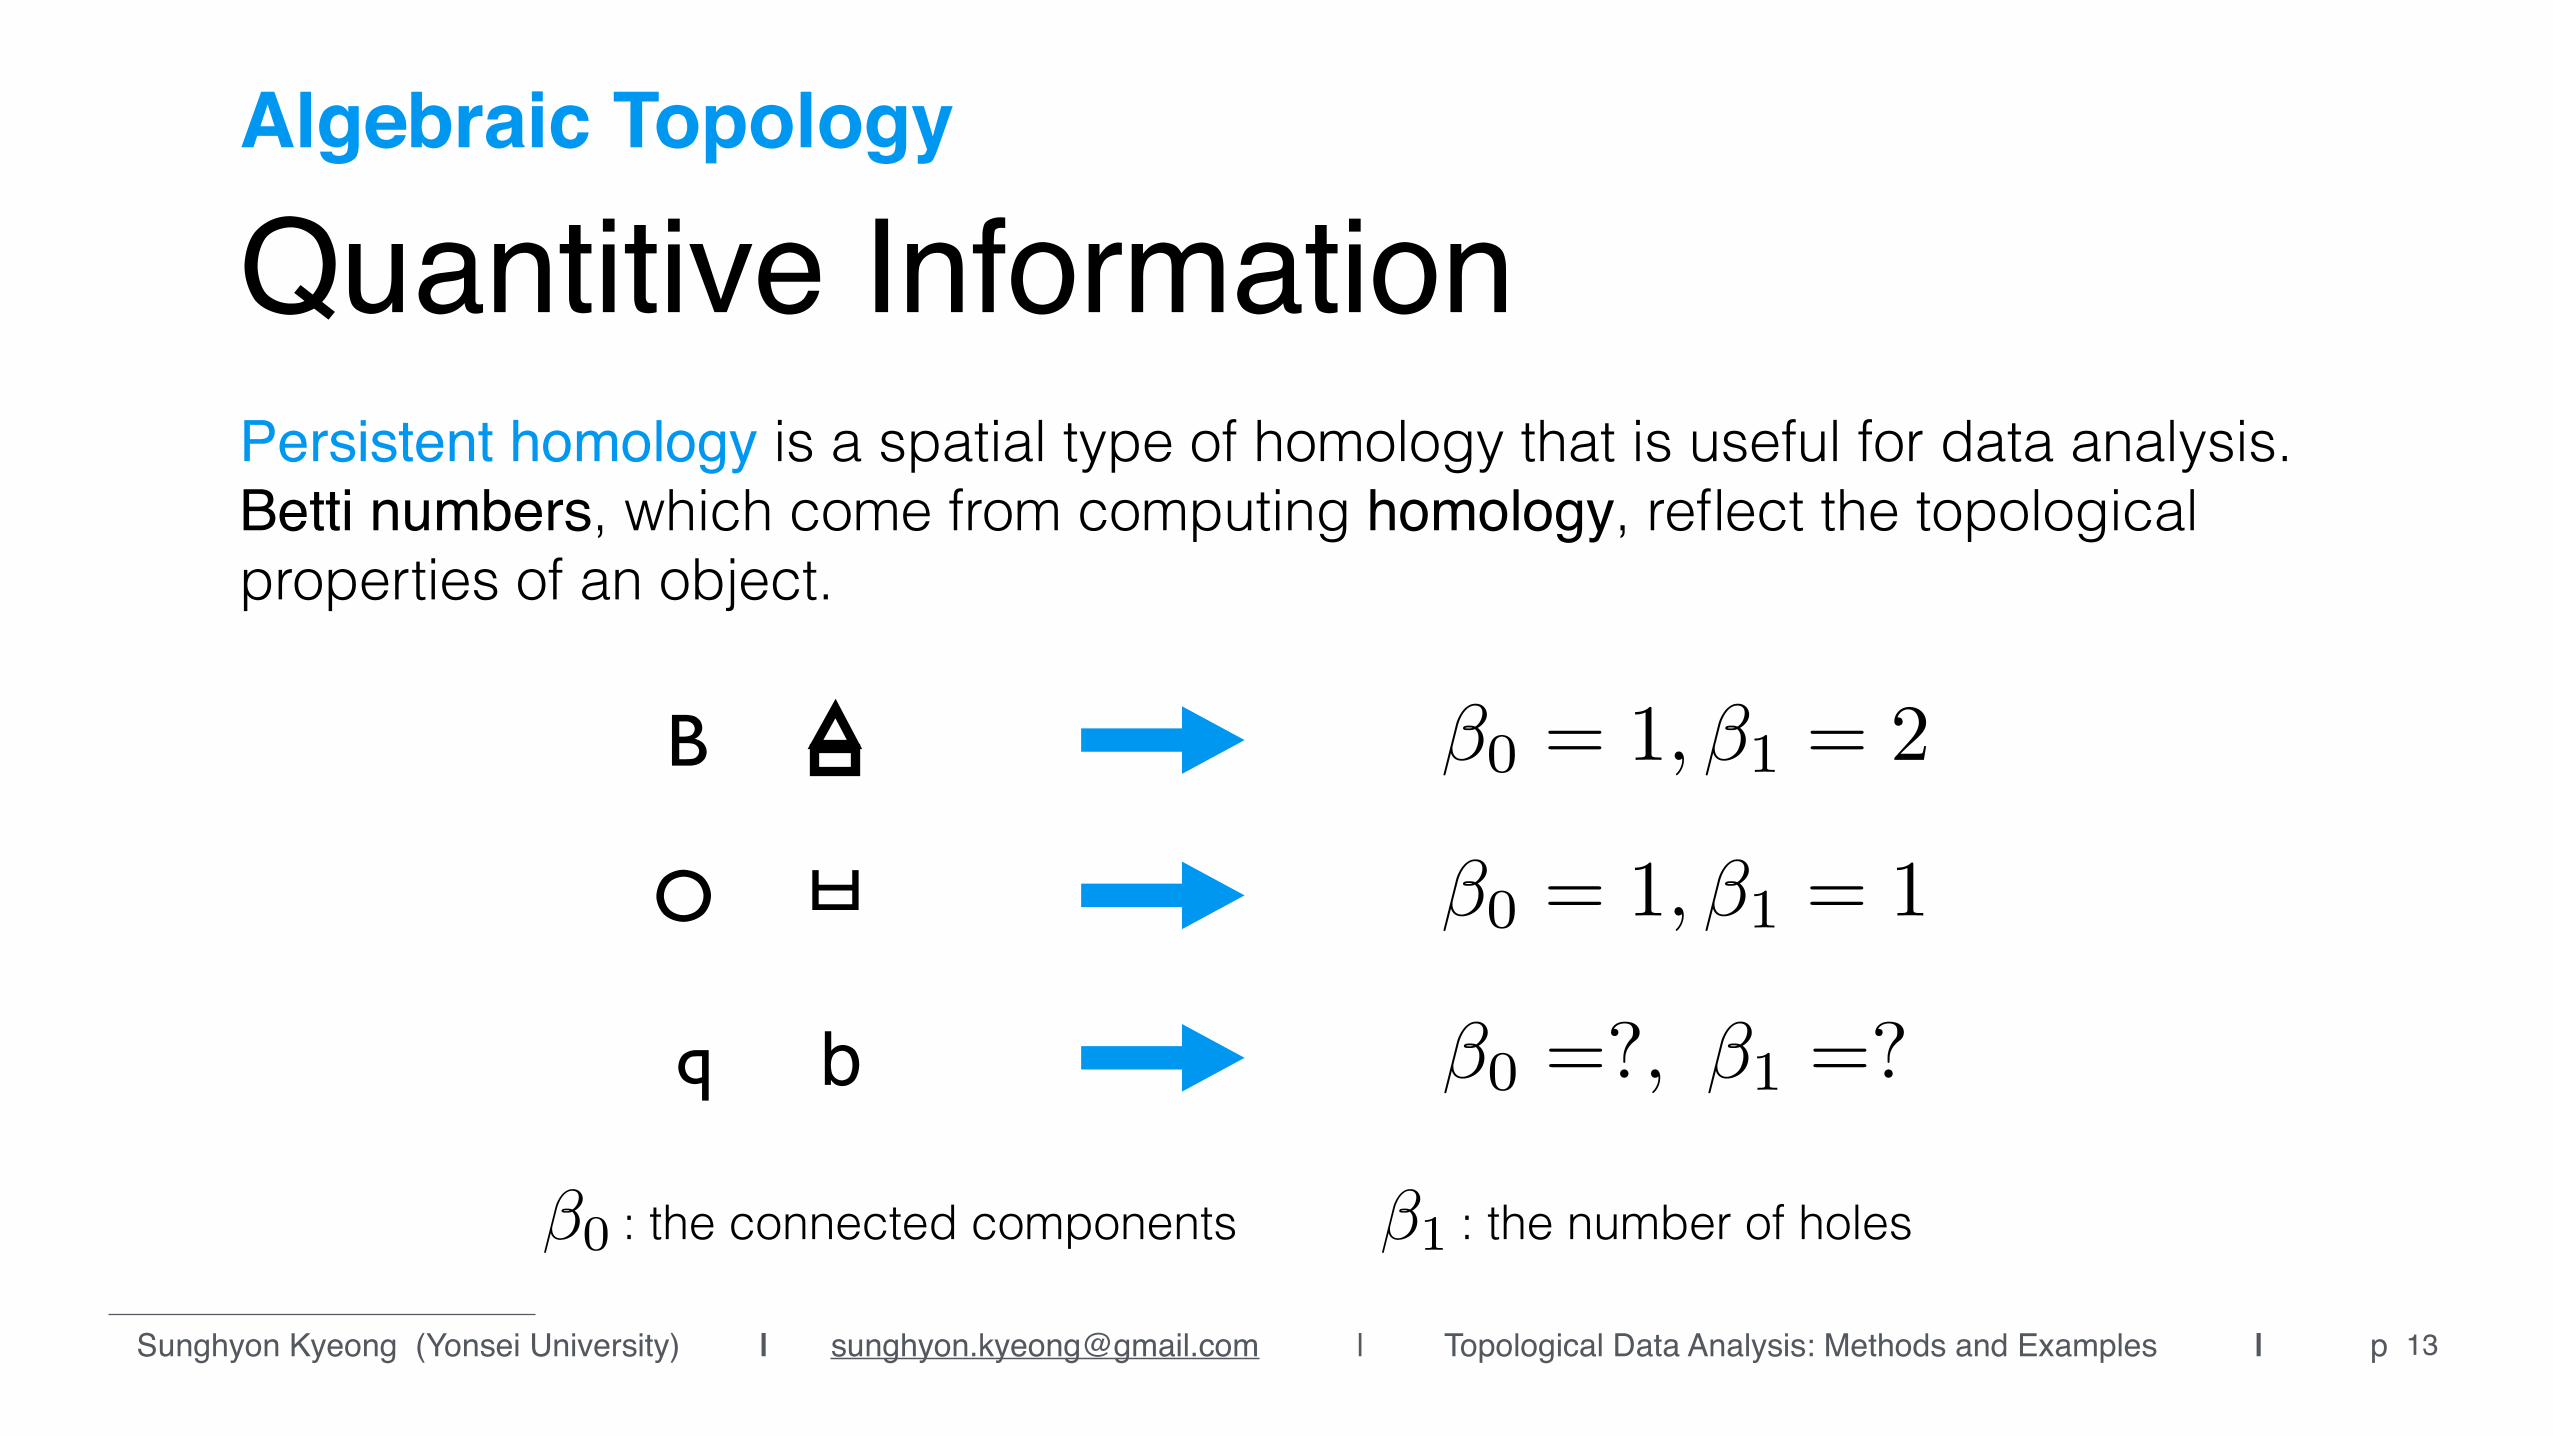
Persistent homology is a spatial type of homology that is useful for data analysis. Betti numbers, which come from computing homology, reflect the topological properties of an object.
B
O ㅂ
q b
: the connected components : the number of holes
Algebraic Topology
Quantitive Information
Sunghyon Kyeong (Yonsei University) | [email protected] | Topological Data Analysis: Methods and Examples | p 14
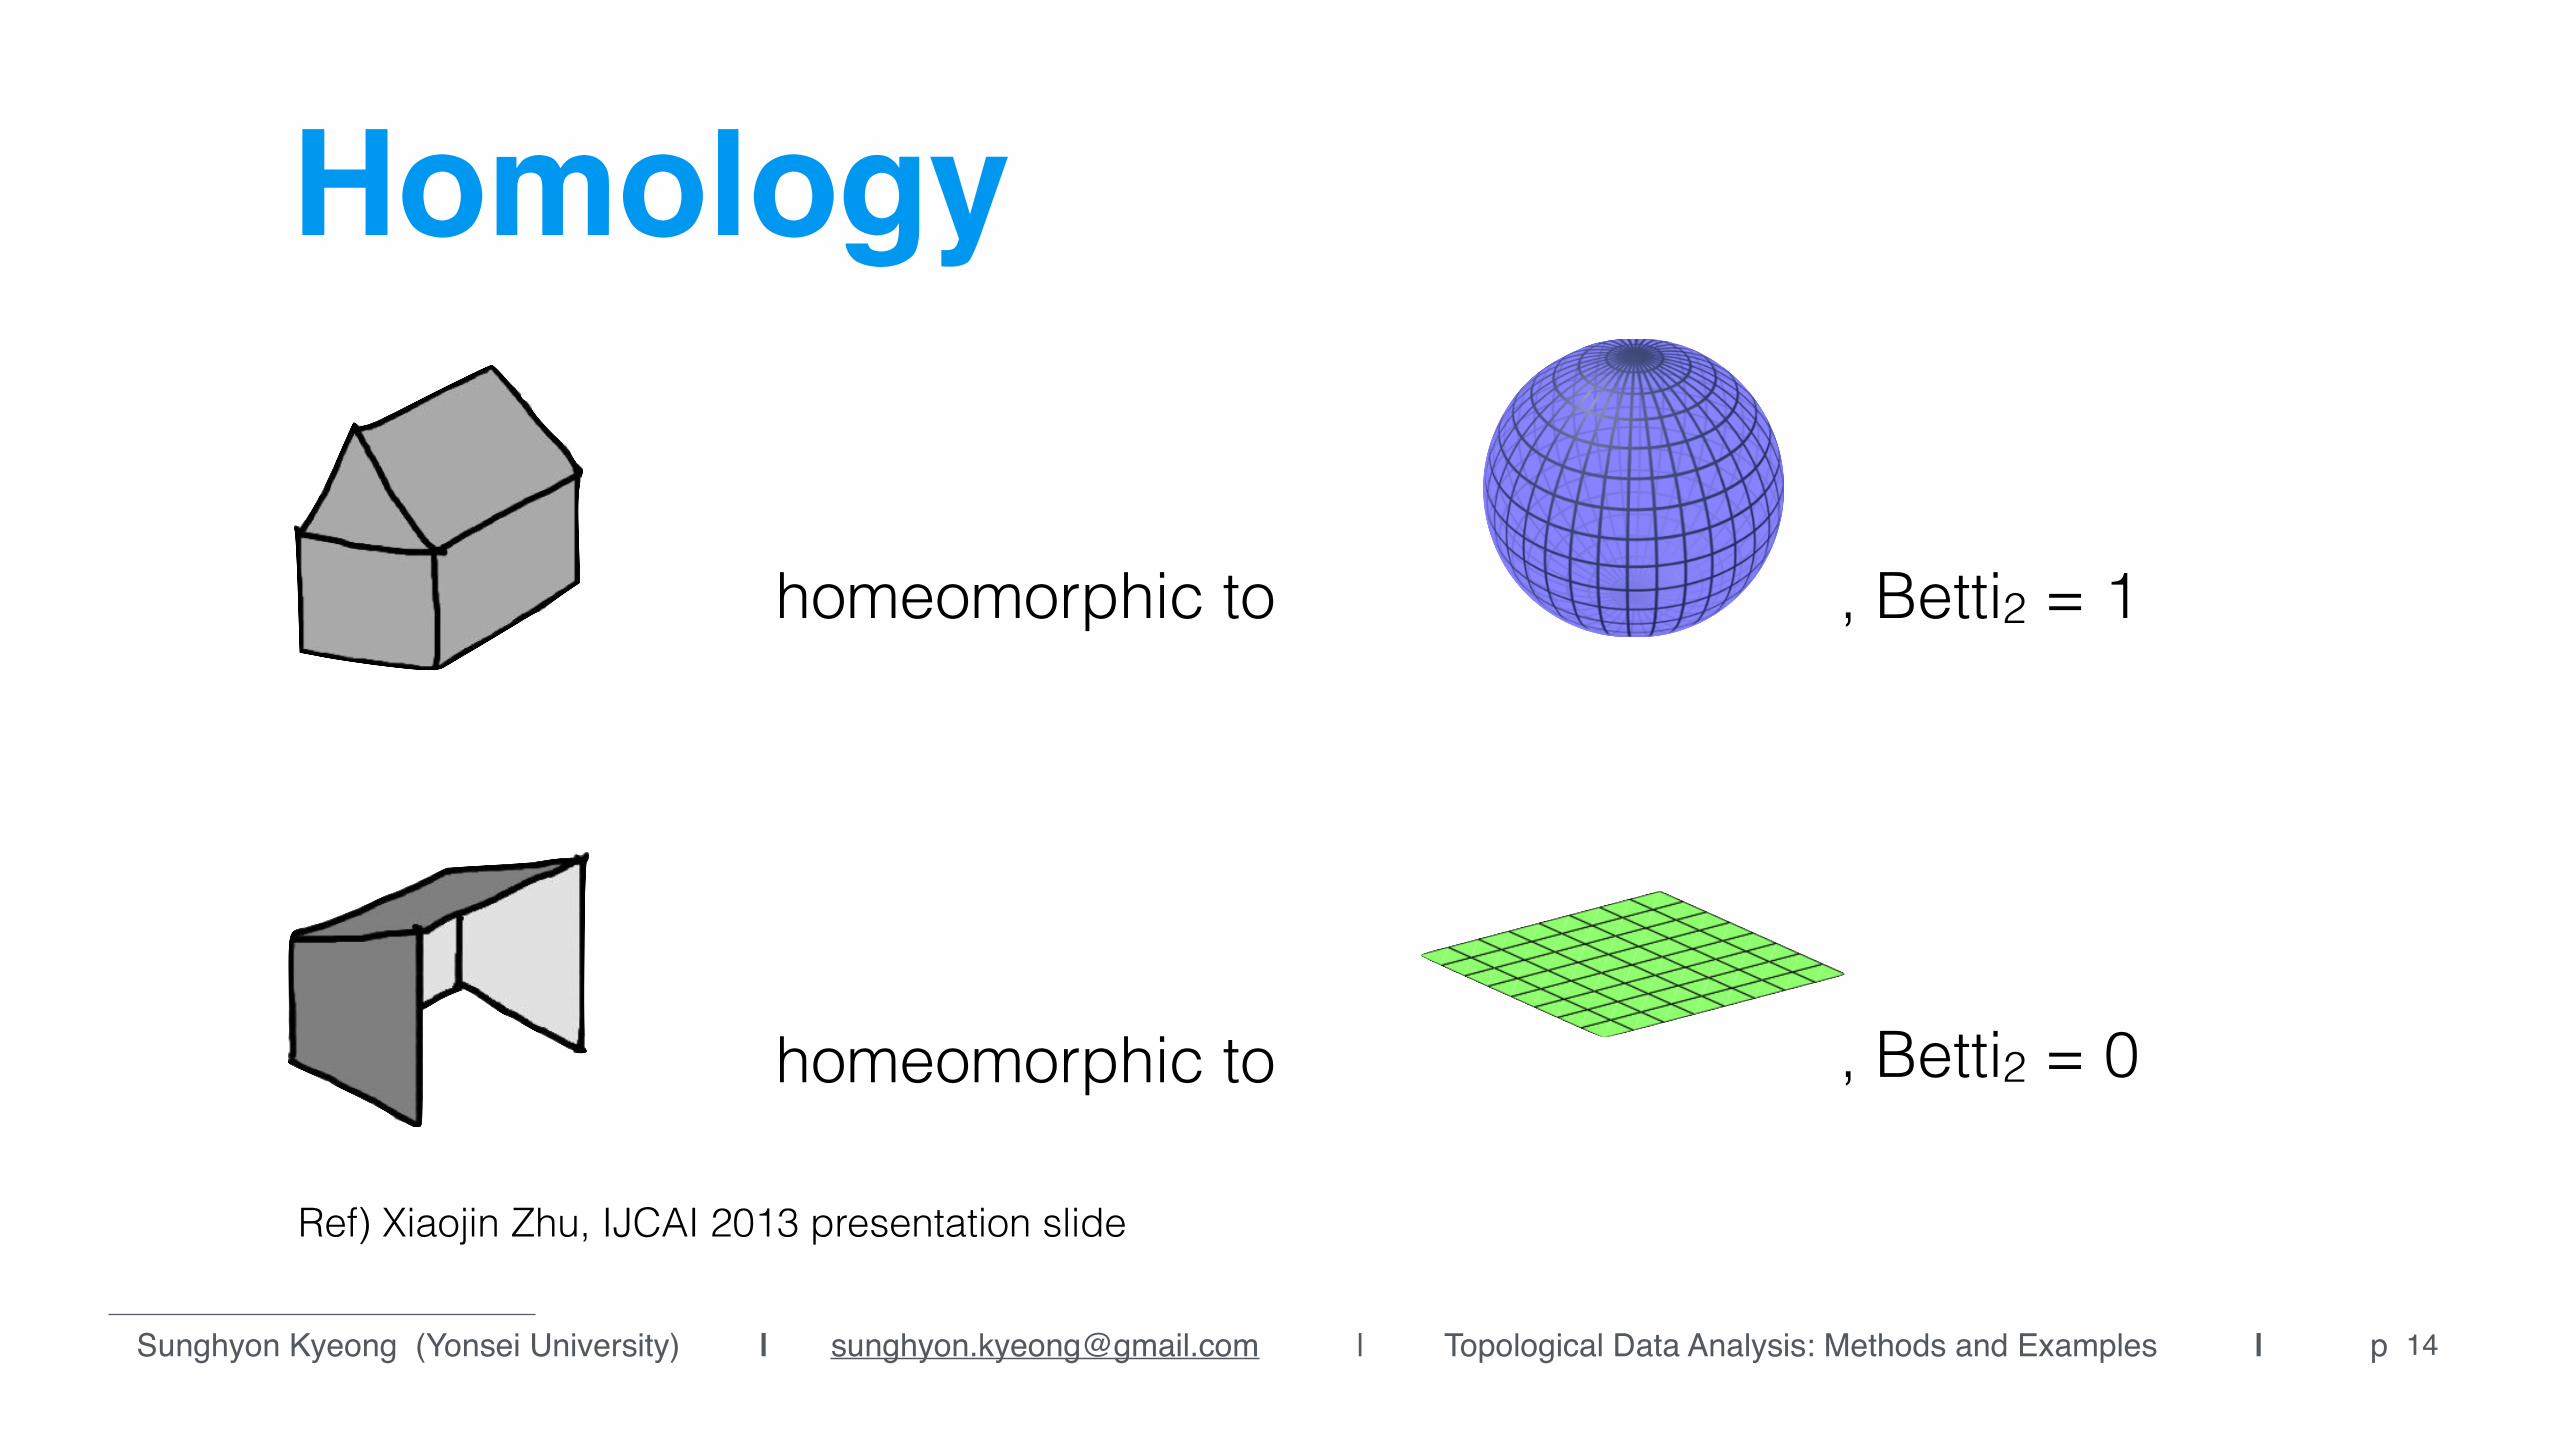
Homology
homeomorphic to
homeomorphic to
, Betti2 = 1
, Betti2 = 0
Ref) Xiaojin Zhu, IJCAI 2013 presentation slide

Sunghyon Kyeong (Yonsei University) | [email protected] | Topological Data Analysis: Methods and Examples | p 15
?
Ref) Figures are obtained from Y.P. Lum et al (2013) Scientific Reports | 3: 1236
points cloud data topology
Geometric Topology
Extracting Shapes of Data

Topological Data Analysis using MapperTwo input functions - filter is to collapse high-dimensional data set into a single point - distance as a measure of distance between data points
Resolution Parameters - Intervals, overlap, magic fudge

Sunghyon Kyeong (Yonsei University) | [email protected] | Topological Data Analysis: Methods and Examples | p 17
FilterFilter Range Intervals Overlap Interval Length
: 0.0~2.0 : 5 : 50% : 0.4
0 0.4 0.8 1.2 1.6 2.0
0.2 0.6 1.0 1.4 1.8
Num
ber o
f Nod
es in
Eac
h Fi
lter B
in
0
10
20
30
40
50
Filter Metric0 1 2single
cluster one or two cluster(s)?
: Divide point clouds into each filter bin

Sunghyon Kyeong (Yonsei University) | [email protected] | Topological Data Analysis: Methods and Examples | p 18
Filter Function- Filter function is not necessarily linear projections on a data matrix.
- People often uses functions that depend only on the distance function itself, such as a measure of centrality.
- Some filter functions may not produce any interesting shapes.
Ref) Figures are obtained from Y.P. Lum et al (2013) Scientific Reports | 3: 1236

Sunghyon Kyeong (Yonsei University) | [email protected] | Topological Data Analysis: Methods and Examples | p 19
Distance Function- distance between all pairs of data points. - both euclidean or geodesic distances could be used.

Sunghyon Kyeong (Yonsei University) | [email protected] | Topological Data Analysis: Methods and Examples | p
0
4
8
12
1 2 3 4 5
20
Distance & Clustering• Single linkage dengrogram is used for clustering point clouds based on
distance between two nodes.
0
3
6
9
1 2 3 4 5
Magic Fudge is the number of bins in the distribution of the distance obtained from single linkage dendrogram.
No. of clusters are estimated from the number of continuous bins having zero elements.
1 Cluster
2 Clusters

Sunghyon Kyeong (Yonsei University) | [email protected] | Topological Data Analysis: Methods and Examples | p 21
Nodes, Edges, Colors
1,2,3, 4,50,1,2,7
5,6,9 10 Nodes are groups of similar objects
Edges connect similar nodesColors let you see values of interest
8,113,4,8,12
12 1412,14
1311,13
indices for points cloud: 0,1,2,3,4,5,6,7,8,9,10,11,12,13,14

Sunghyon Kyeong (Yonsei University) | [email protected] | Topological Data Analysis: Methods and Examples | p 22
Topology extractionFilter Range Intervals Overlap Magic Fudge
: 0 ~ 2 : 5 : 50% : 5
Filter
Partial Clustering
The size of node represents the number of point clouds in each node.

Sunghyon Kyeong (Yonsei University) | [email protected] | Topological Data Analysis: Methods and Examples | p 23
A) C)
F1F2
Filter
Extract position information of y-axis
F3F4
F5F6
F7
F8F9
F10
B)
F1
F2
F3
F4
F5
F6
F7
F8F9
F9
F10
F10
01020
30
1 2 3 4 5
9th Filter bin
1 1
1st Filter bin
0
10
20
1 2 3 4 5
11
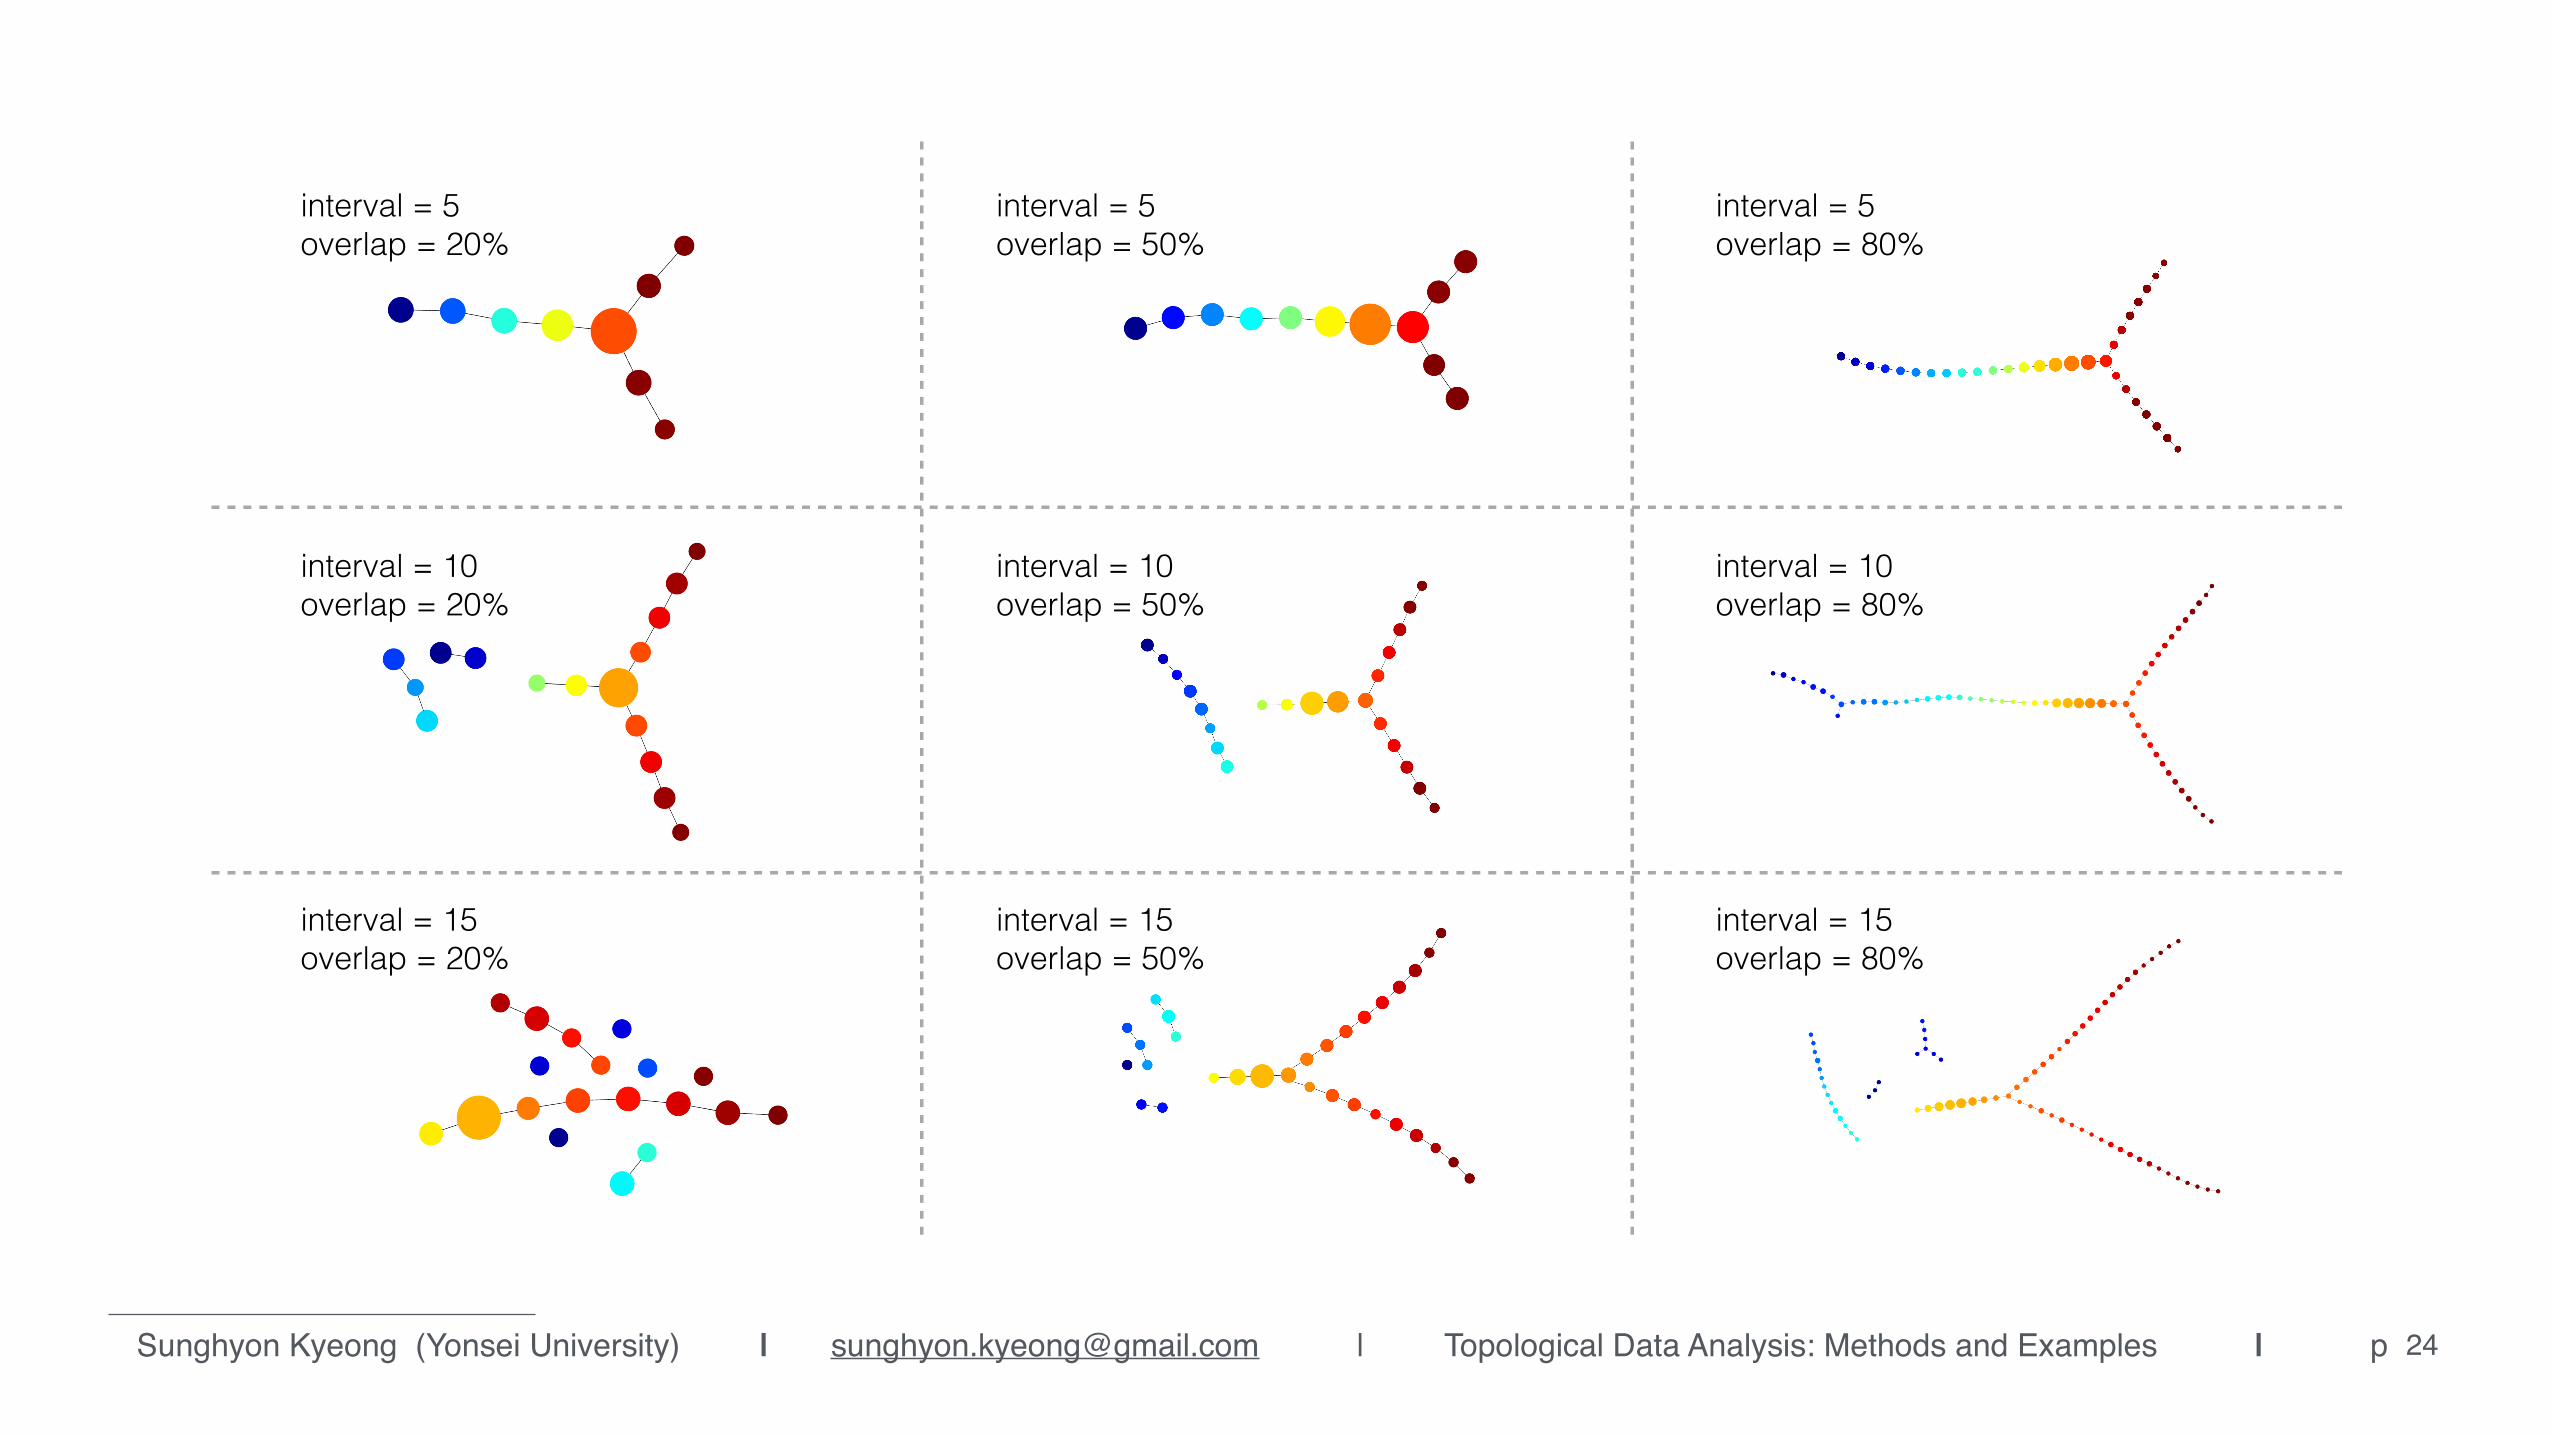
Topology of Y-shape points cloud
Sunghyon Kyeong (Yonsei University) | [email protected] | Topological Data Analysis: Methods and Examples | p 24
interval = 5overlap = 20%
interval = 5overlap = 50%
interval = 5overlap = 80%
interval = 10 overlap = 20%
interval = 10 overlap = 50%
interval = 10 overlap = 80%
interval = 15 overlap = 20%
interval = 15 overlap = 50%
interval = 15overlap = 80%

Sunghyon Kyeong (Yonsei University) | [email protected] | Topological Data Analysis: Methods and Examples | p
Mathematical details can be found at
25
• Gurjeet Singh et al. (2007), Topological methods for the analysis of high dimensional data sets and 3D object recognition.
• Gunnar Carlsson (2009), Topology and data, Bull. Amer. Math. Soc. 46. 255-308.
Gurjeet Singh and Gunnar Carlsson are co-founders of Ayasdi


Sunghyon Kyeong (Yonsei University) | [email protected] | Topological Data Analysis: Methods and Examples | p 27
US Patent by Ayasdi

Sunghyon Kyeong (Yonsei University) | [email protected] | Topological Data Analysis: Methods and Examples | p 28

Applications to Neurobiological/Clinical DataInternational Neuroimaging Data-sharing Initiative (INDI)- URL: http://fcon_1000.projects.nitrc.org/index.html - Healthy control, ADHD, ASD data sets are available. - resting state fMRI, diffusion tensor imaging, - phenotype information such as intelligence scale and ADHD
symptom severity are available.

Sunghyon Kyeong (Yonsei University) | [email protected] | Topological Data Analysis: Methods and Examples | p
Dataset : ADHD Symptoms & IQ
30
1 2 3 4 5
1 0.0 61.5 77.3 51.6 77.0
2 61.5 0.0 62.2 55.9 69.0
3 77.3 62.2 0.0 47.2 11.9
4 51.6 55.9 47.2 0.0 52.4
5 77.0 69.0 11.9 52.4 0.0
Data set:
L2-Distance (or Euclidean distance) for all pairwise subjects:
Distance Matrix:
(or Euclidean)
Filter Function:
f(x) = max d(x, y)
y 2 x
L-infinity eccentricity
Sunghyon Kyeong (Yonsei University) | [email protected] | Topological Data Analysis: Methods and Examples | p 31
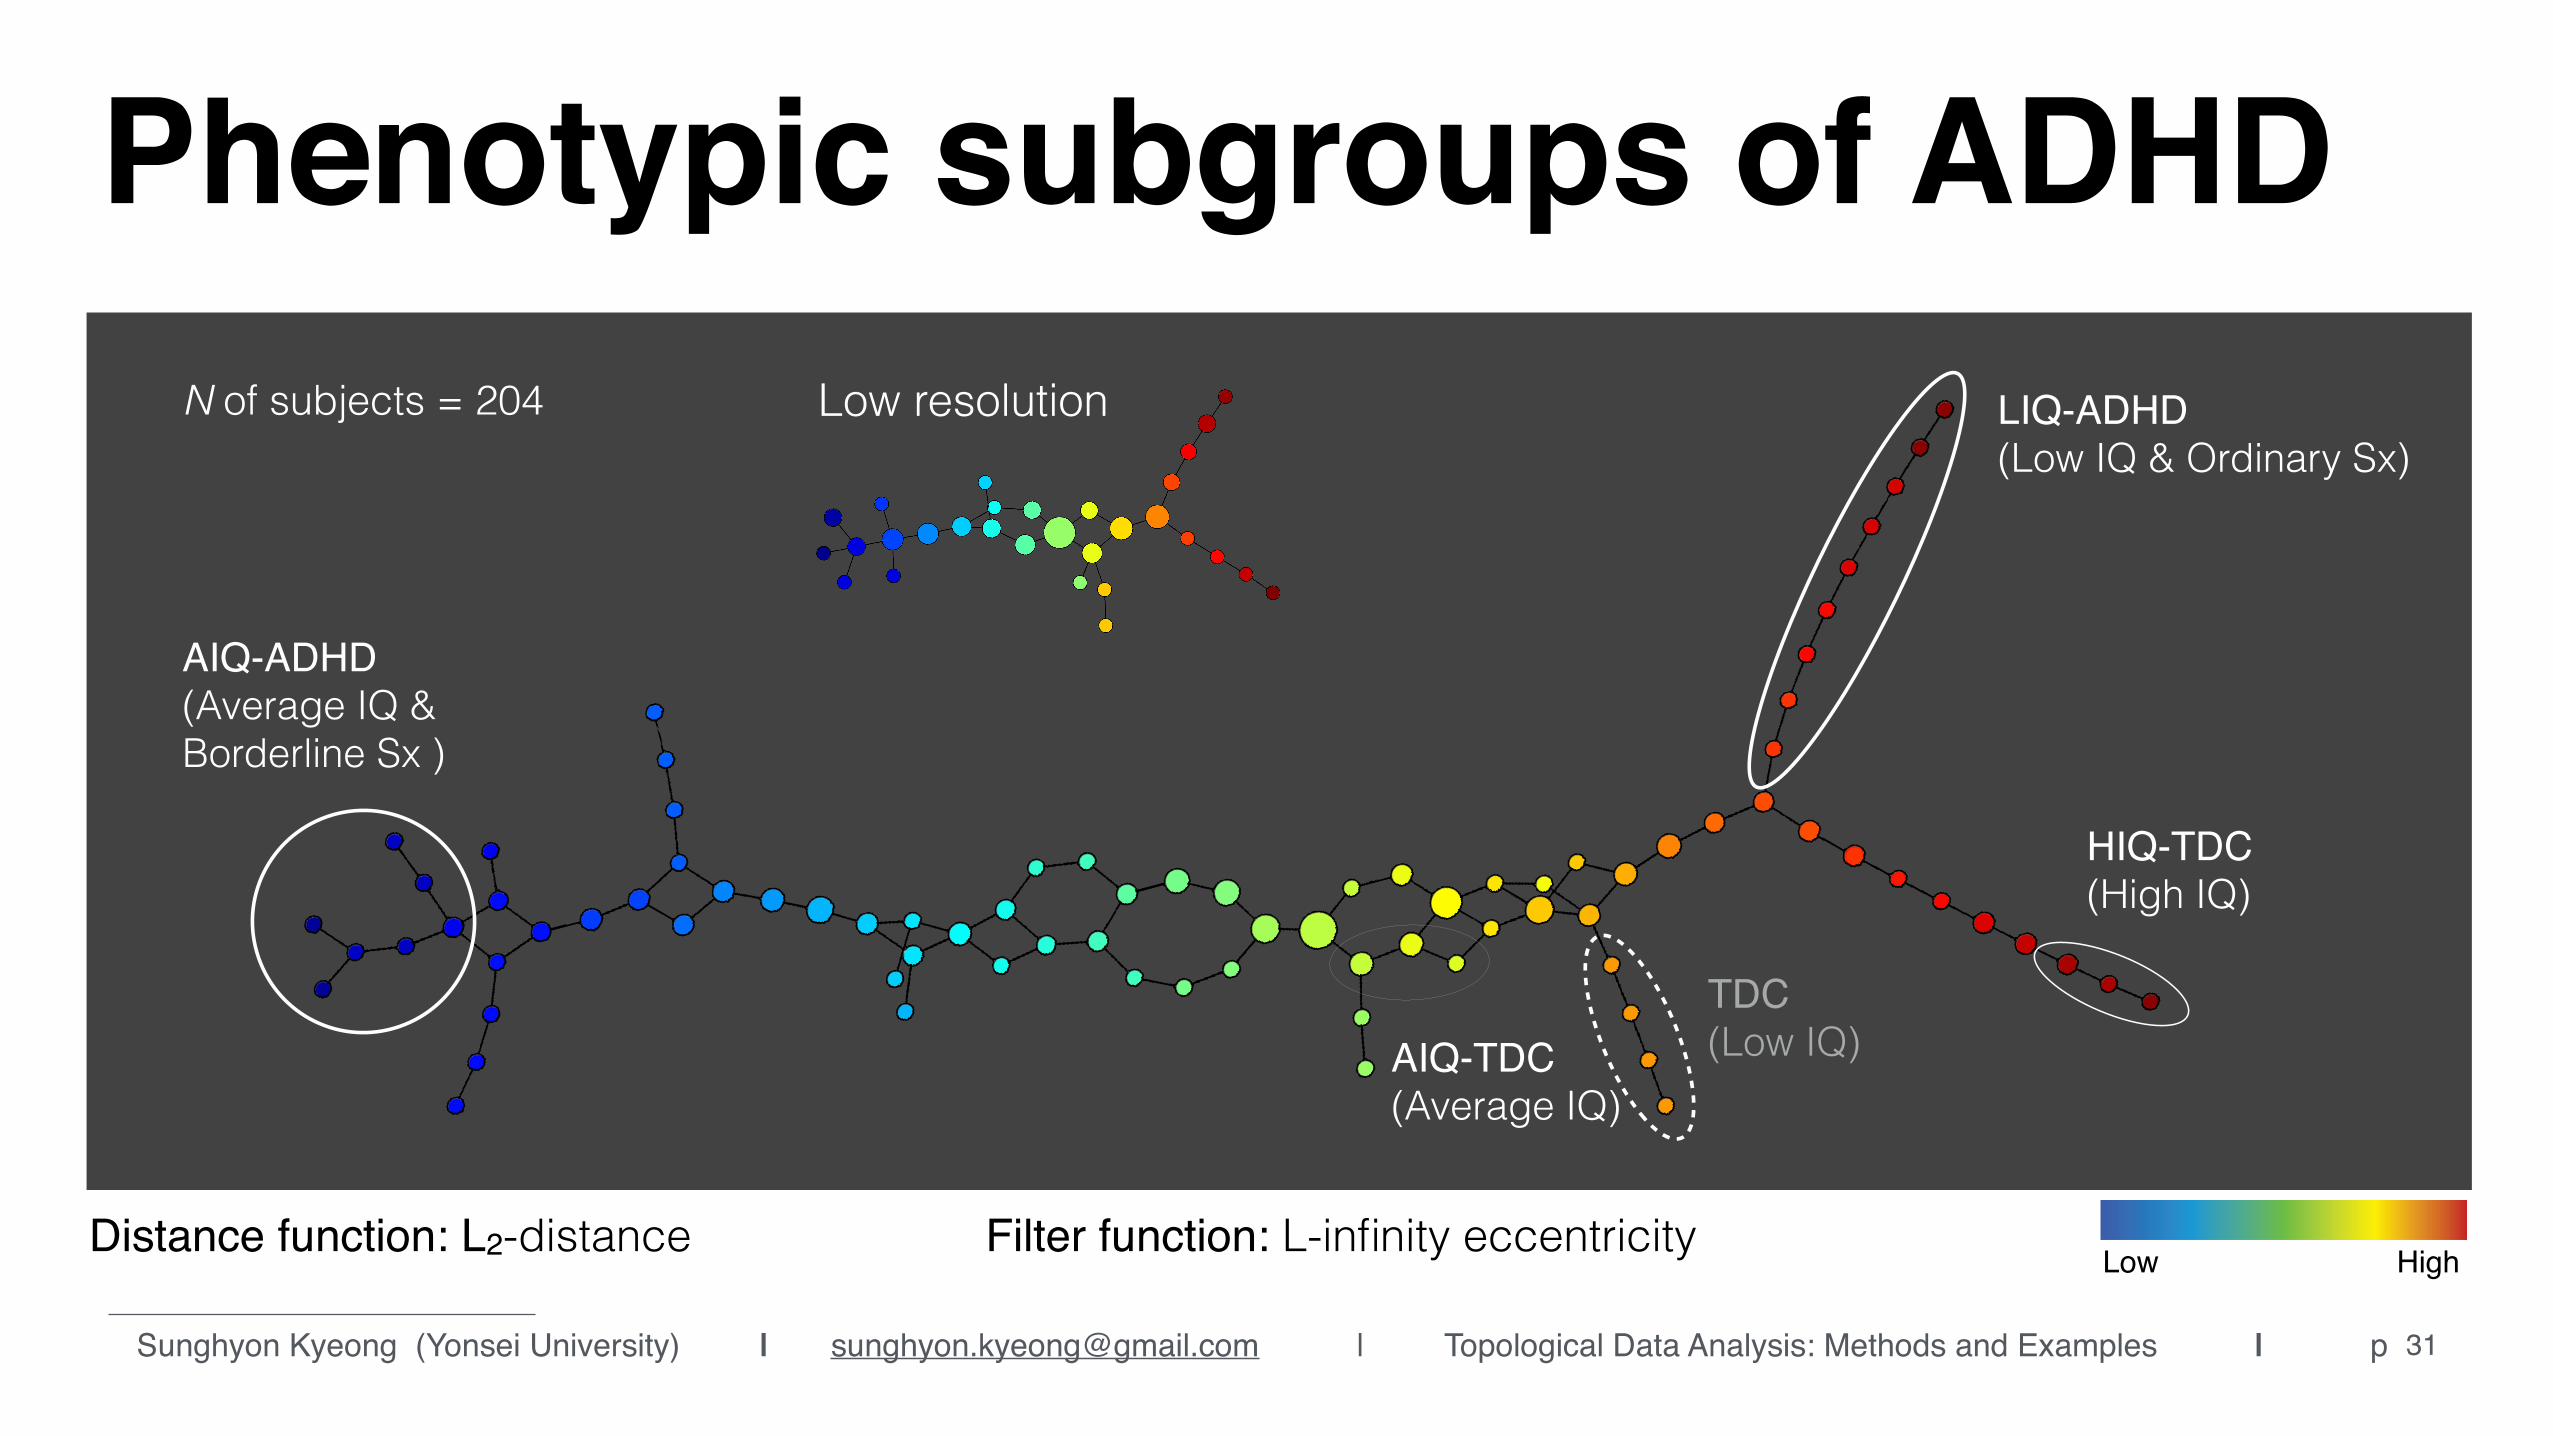
Phenotypic subgroups of ADHD
AIQ-TDC (Average IQ)
Low High
TDC(Low IQ)
Distance function: L2-distance Filter function: L-infinity eccentricity
N of subjects = 204 Low resolution
AIQ-ADHD (Average IQ & Borderline Sx )
HIQ-TDC (High IQ)
LIQ-ADHD (Low IQ & Ordinary Sx)

Sunghyon Kyeong (Yonsei University) | [email protected] | Topological Data Analysis: Methods and Examples | p 32
30
60
90
ADHD
60
30
60
90
Inattentive
59
30
60
90
Hyper/Impulsivity
59
70
100
130
FSIQ
108
70
100
130
VIQ
109
70
100
130
PIQ
105
HIQ-TDC (High IQ)
AIQ-TDC (Average IQ)
LIQ-ADHD (Ordinary Sx)
AIQ-ADHD (Borderline Sx)
All subjects (Avg. Sx & Avg. IQ)
13 (13 / 0) 21 (17 / 4) 12 (1 / 11) 19 (2 / 17) 204 (90 / 114)
Sunghyon Kyeong (Yonsei University) | [email protected] | Topological Data Analysis: Methods and Examples | p 33
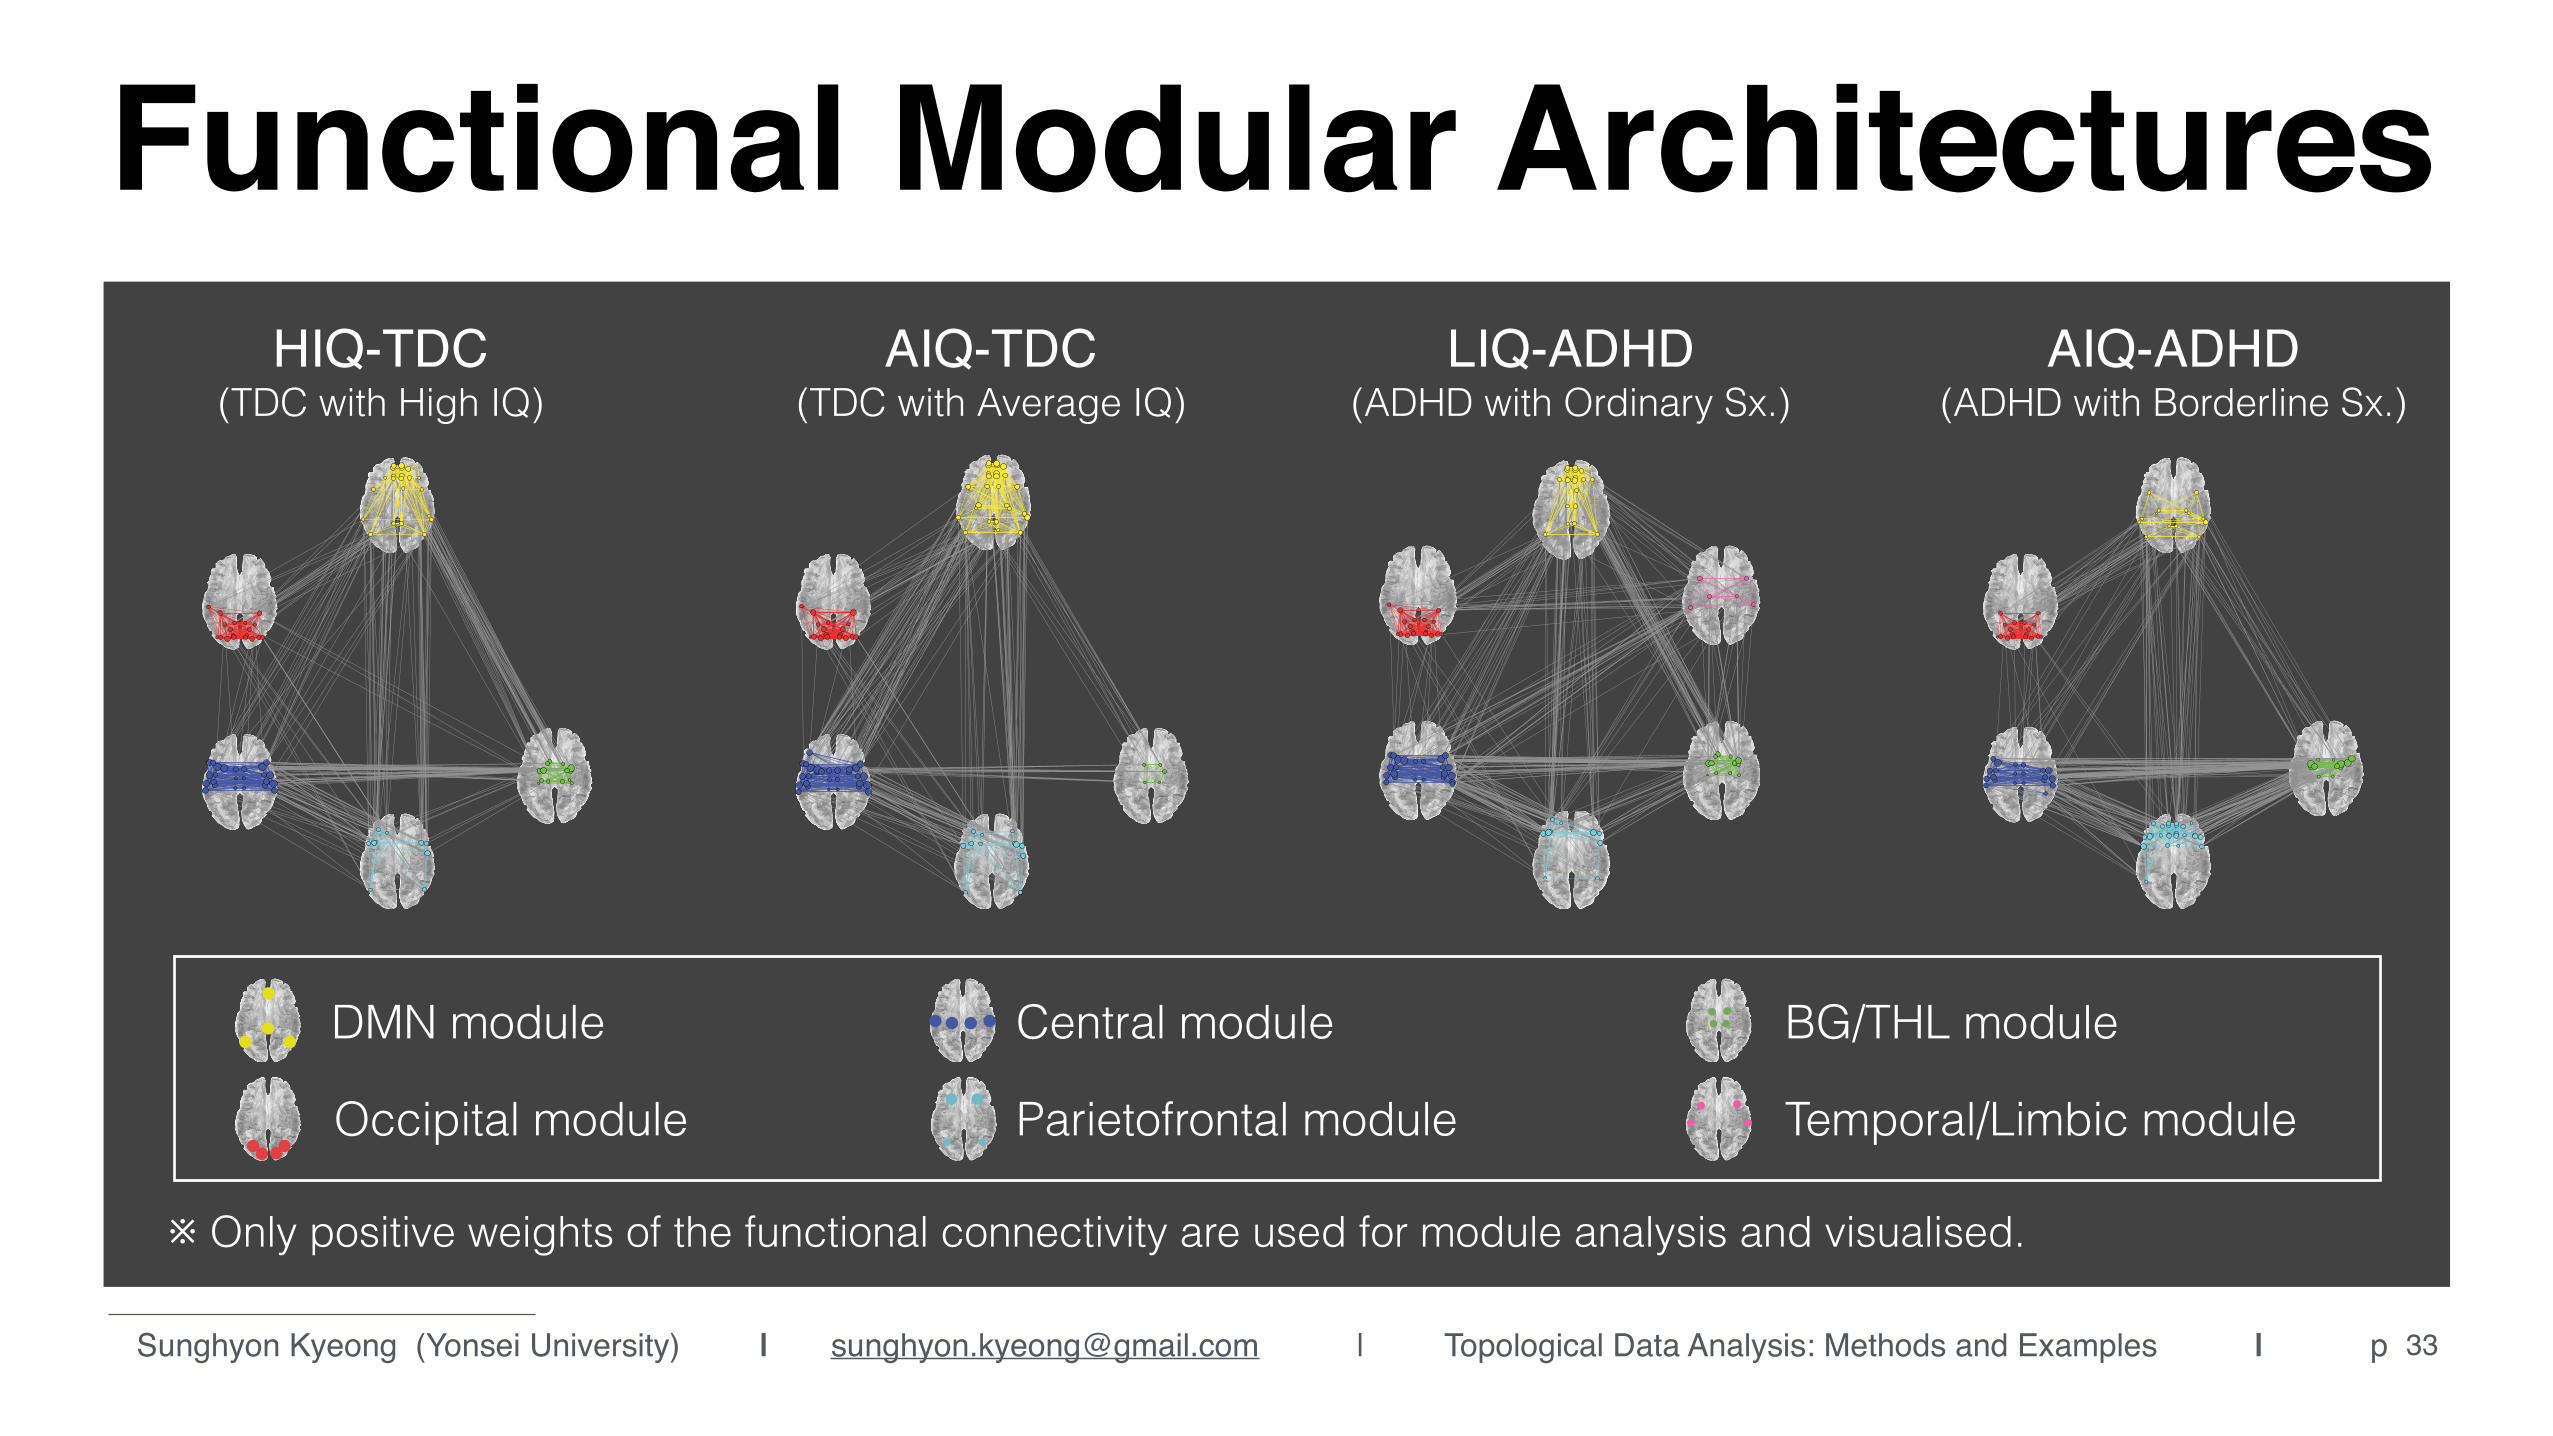
Functional Modular ArchitecturesAIQ-TDC
(TDC with Average IQ)LIQ-ADHD
(ADHD with Ordinary Sx.)AIQ-ADHD
(ADHD with Borderline Sx.)
DMN module
Occipital module
Central module
Parietofrontal module
BG/THL module
Temporal/Limbic module
HIQ-TDC (TDC with High IQ)
※ Only positive weights of the functional connectivity are used for module analysis and visualised.

Applications toMedical science data

Diabetes Subtypesbased on six quantities: - age - relative weight - fasting plasma glucose - area under the plasma glucose curve for the three hour
glucose tolerance test (OGTT) - area under the plasma insulin curve for the OGTT - steady state plasma glucose (SSPG) response
SSPG
Glucose area Insulin area
Ref) Eurographics Symposium on Point-Based Graphics, Singh G et al. (2007)

Sunghyon Kyeong (Yonsei University) | [email protected] | Topological Data Analysis: Methods and Examples | p 36
Subtypes of diabetes
Type I diabetes
Type II diabetes
Type I diabetes
Type II diabetes
Low-resolution High-resolutionInterval: 3 Overlay: 50%
Interval: 4Overlay: 80%
Type I: adult onset TypeII: juvenile onset
Distance function: L2-distance Filter function: density kernel with e=130,000

Subtypes of Breast Cancerusing breast cancer microarray gene expression data set - disease specific genomic analysis (DSGA) transformed data
Application to Biological Data,
PNAS, Monica Nicolau et al. (2010)

Sunghyon Kyeong (Yonsei University) | [email protected] | Topological Data Analysis: Methods and Examples | p 38
Breast Cancer Subtype
ER: Estrogen Receptor
PNAS, Monica Nicolau et al. (2010)


Sunghyon Kyeong (Yonsei University) | [email protected] | Topological Data Analysis: Methods and Examples | p
Diabetes Mellitus (DM)• Commonly referred to as diabetes, a group of metabolic disease.
• If left untreated, diabetes can cause many complications: cardiovascular disease, stroke, chronic kidney failure, foot ulcers, and damage to eyes.
• Diabetes is due to either the pancreas not producing enough insulin or the cells of the body not responding properly to the insulin produced.
• Type 1 DM: results from the pancreas’s failure to produce enough insulin.
• Type 2 DM: begins with insulin resistance, a condition in which cells fail to respond to insulin properly. heavy weight and not enough exercise are causes of T2D.
• Gestational diabetes, is the third main form and occurs when pregnant women without a previous history of diabetes develop a high blood-sugar level.
40

Sunghyon Kyeong (Yonsei University) | [email protected] | Topological Data Analysis: Methods and Examples | p
Why subgroups of type 2 DM?• Risk factors of Type 2 DM are:
obesity, family history of diabetes, physical inactivity, ethnicity, and advanced age.
• Type 2 DM is heterogenous complex disease affecting more than 29 million in American (9.3%). 2 million in Korea.
• Increasing needs for early prevention and clinical management of Type 2 DM.
41

Sunghyon Kyeong (Yonsei University) | [email protected] | Topological Data Analysis: Methods and Examples | p
Methods• High dimensional EMRs and genotype data from 11,210 individuals from Mount Sinai
Medical Center (MSMC)’s outpatient population (46% Hispanic, 32% African american, 20% European white, and 2% others).
• Type 2 DM and non-Type 2 DM were defined by an electronic phenotyping algorithm (eMERGE network) based on ICM-9-CM diagnosis codes, laboratory test, prescribed medications (RxNorm), physician notes (natural language processing), and family history.
• Form of preprocessed data matrix is n patients by P medical variables. Medical variables included 505 clinical variable, 7097 unique ICM-9-CM codes (1 to 218 per patients). On average, 64 clinical variables per patients. To avoid overfitting, select the variable with at least 50% of patients who had the variables, resulting in 73 (of 505) variables to perform the analysis.
42

Sunghyon Kyeong (Yonsei University) | [email protected] | Topological Data Analysis: Methods and Examples | p
TDA pipeline• Distance metric: cosine distance metric was used to assess the similarity
of the data points.
• Filter metric: L-infinity centrality and principal metric singular value decomposition (SVD1). L-infinity centrality is defined for each data point y to be the maximum distance from y to any other data point in the data set. Large values of this function correspond to points that are far from the centre of data set.
43

3889 patients 7321 patients
44

TDA with only 2551 Type II DM
762 Subtype 1
617 Subtype 2
1096 Subtype 3
Gender is not an organising factor in the topology
Reproducibility test (2/3 training, 1/3 test data set, 10 times) revealed that the overall accuracy was 96% for a subtype classification.
45

Applications to Social Science Data- Classification of (basket ball) player types - Partial clustering of personality using temperamental traits - Relationship among welfare, civil construction, and suicide rate

Classification of player typesbased on their in-game performance such as: - rates (per minute played) of rebounds, assists,
turnovers, steals, blocked shots, personal fouls, and points scored (7 performance measures)

Sunghyon Kyeong (Yonsei University) | [email protected] | Topological Data Analysis: Methods and Examples | p 48
Map of Playerslow resolution map at 20 intervals high resolution map at 30 intervals
Points Per GameLow High
Filter function: Principal and secondary SVD values
Distance function: Variance normalised L2-distance
Traditionally, basket ball players are categorised into guards, forwards, and center.

TDA versus K-means clusteringGrouping subjects into personality types
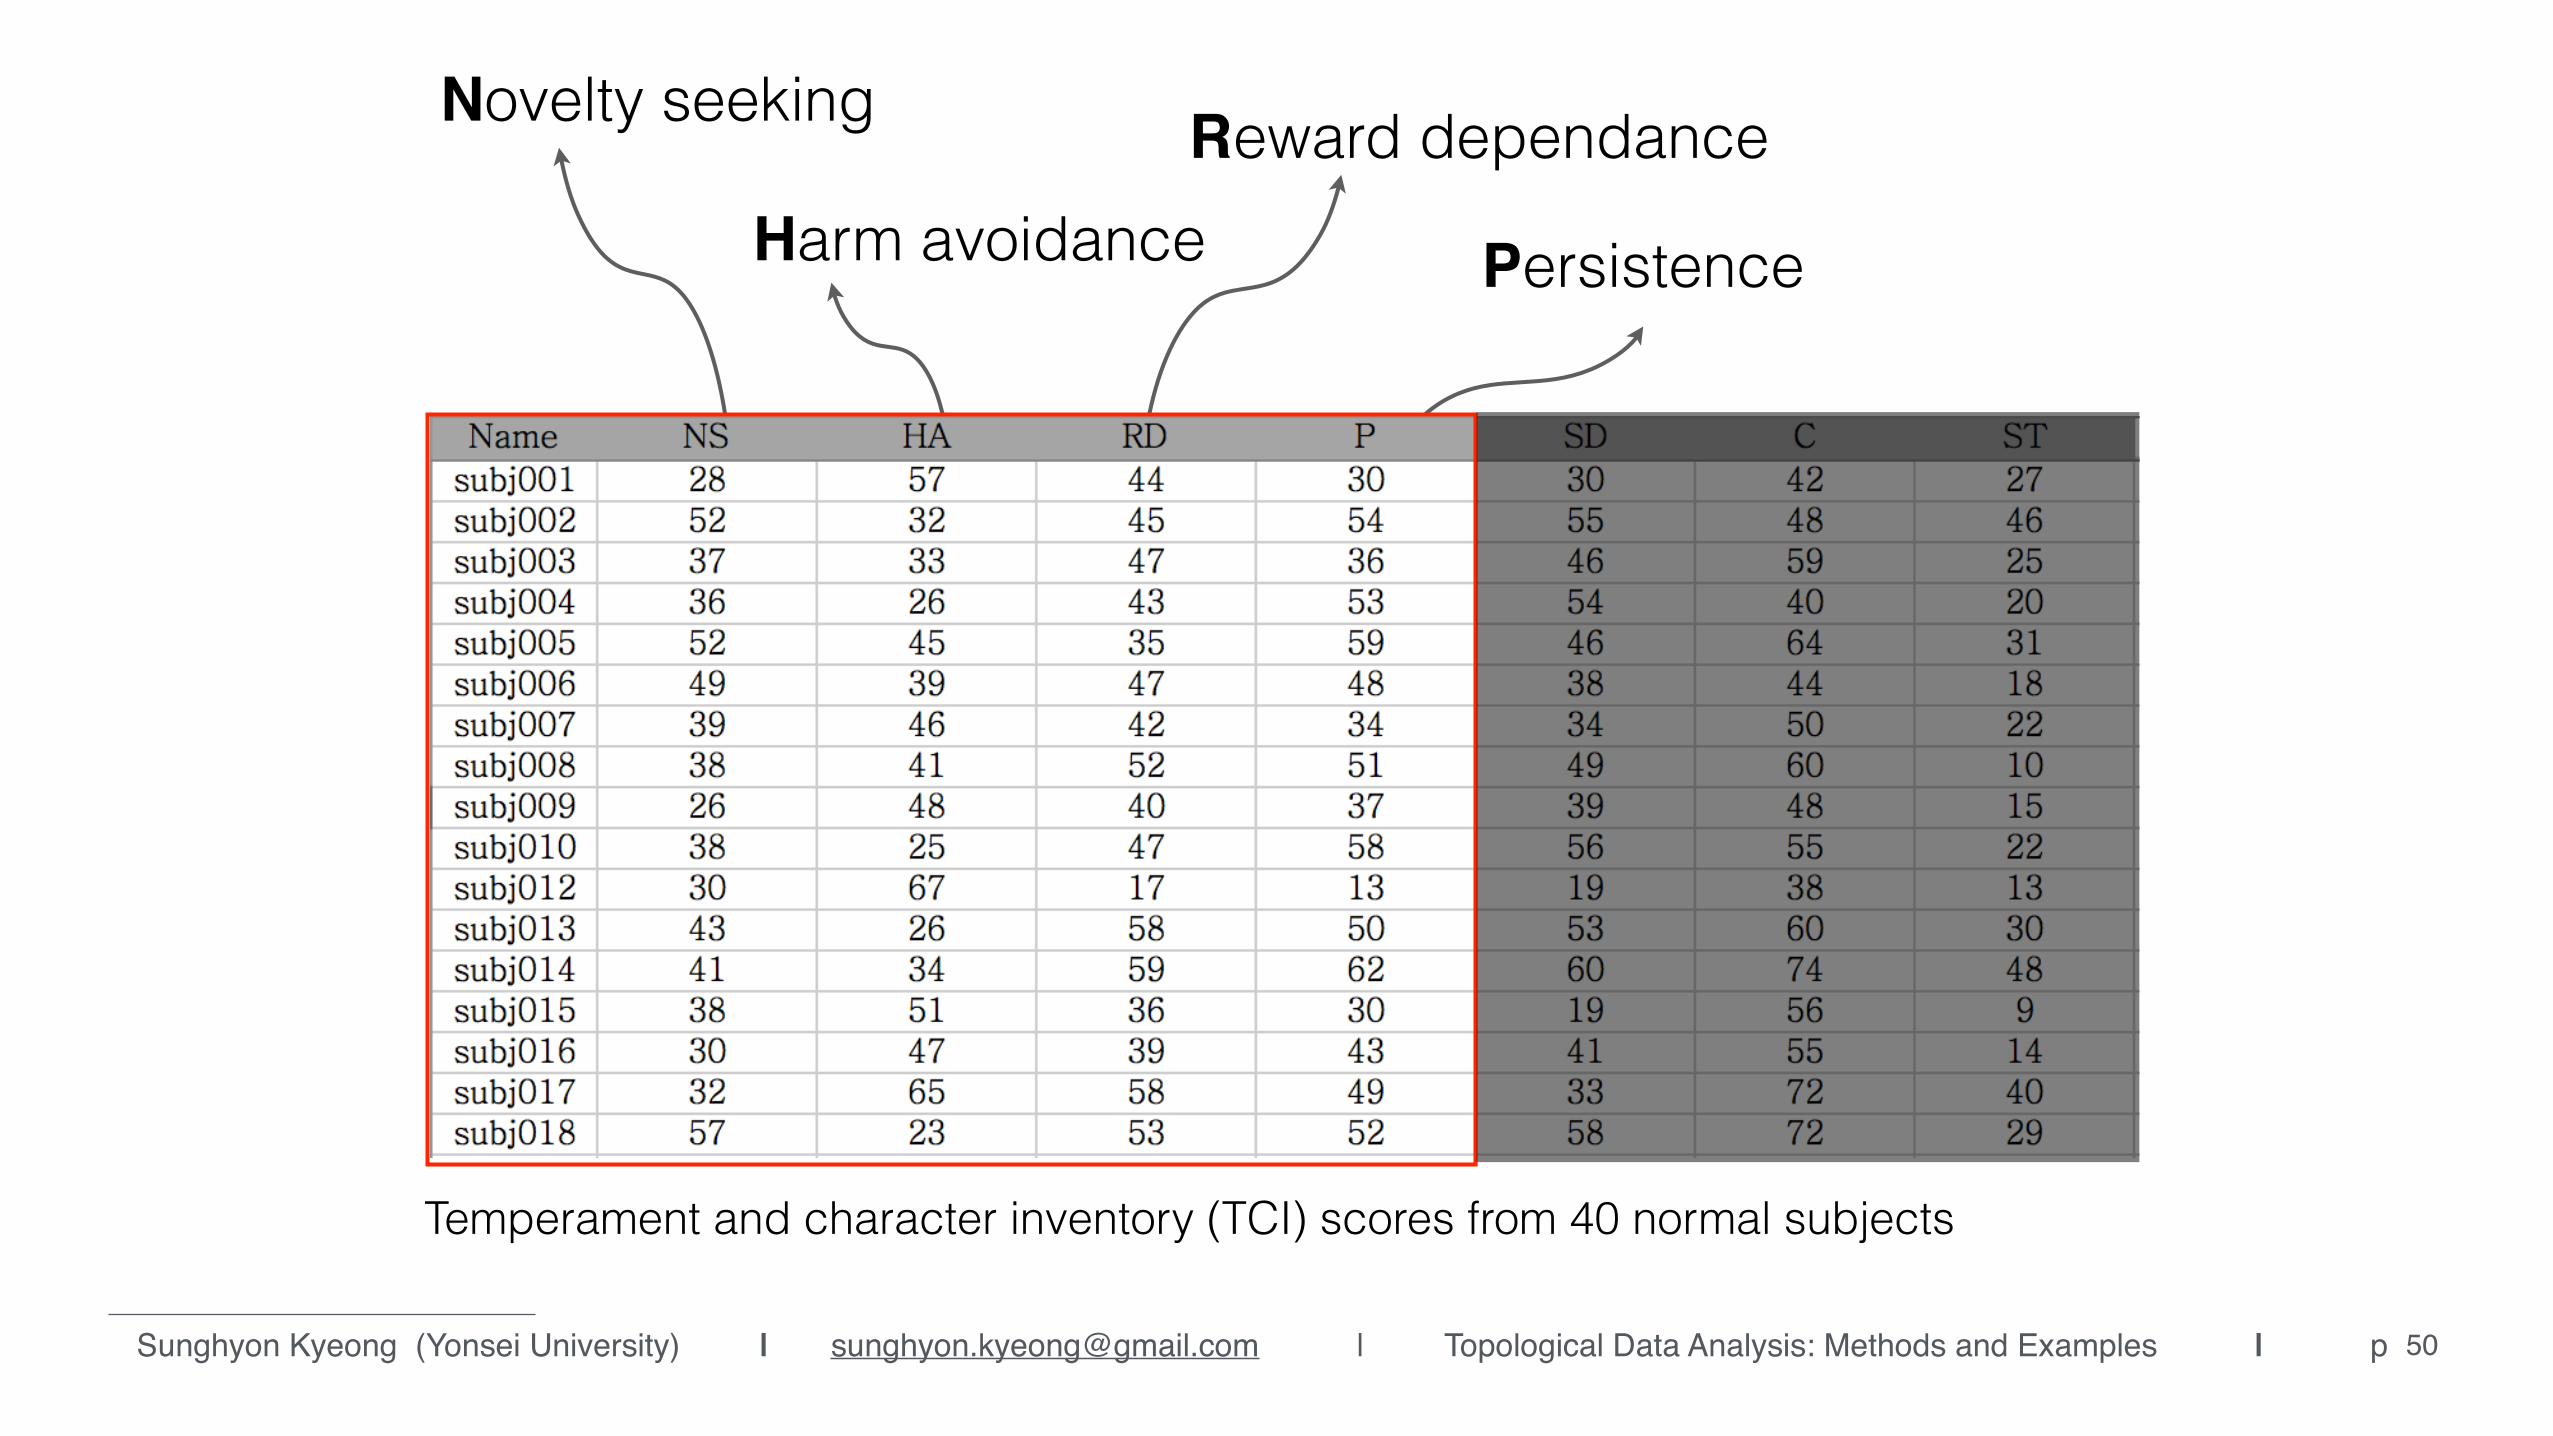
Sunghyon Kyeong (Yonsei University) | [email protected] | Topological Data Analysis: Methods and Examples | p 50
Novelty seeking
Harm avoidanceReward dependance
Persistence
Temperament and character inventory (TCI) scores from 40 normal subjects

Sunghyon Kyeong (Yonsei University) | [email protected] | Topological Data Analysis: Methods and Examples | p 51
the mean of points in Si
V =2X
i=1
X
xj2Si
||xj
� µ
i
||2 S = {S1, S2}
20 30 40 50 60 700
10
20
30
40
50
60
70
Novelty Seeking
Har
m A
void
ance
IntrovertsExtravertsCentroids
20 30 40 50 60 70 Novelty Seeking
Har
m A
void
ance
70
60
50
40
30
20
10
0
Subject Grouping
high HA & low NS low HA & high NSCentroids×
B. k-means ClusteringA. Input Dataset
The goal of k-means clustering is to minimise the within-cluster sum of squares.

Sunghyon Kyeong (Yonsei University) | [email protected] | Topological Data Analysis: Methods and Examples | p 52
TDA to extract personality groups
20
30
40
50
60
NS HA RD P
Group1 Group2
Distance function: L2-distance Filter function: L-infinity eccentricityLow High
Low resolution(5 intervals, 50% overlap)
Group 1(n=7)
Group 2(n=4)
HA,NS,RD,P=(32,65,58,49)
1 11
High resolution(5 intervals, 70% overlap)
Sunghyon Kyeong (Yonsei University) | [email protected] | Topological Data Analysis: Methods and Examples | p 53
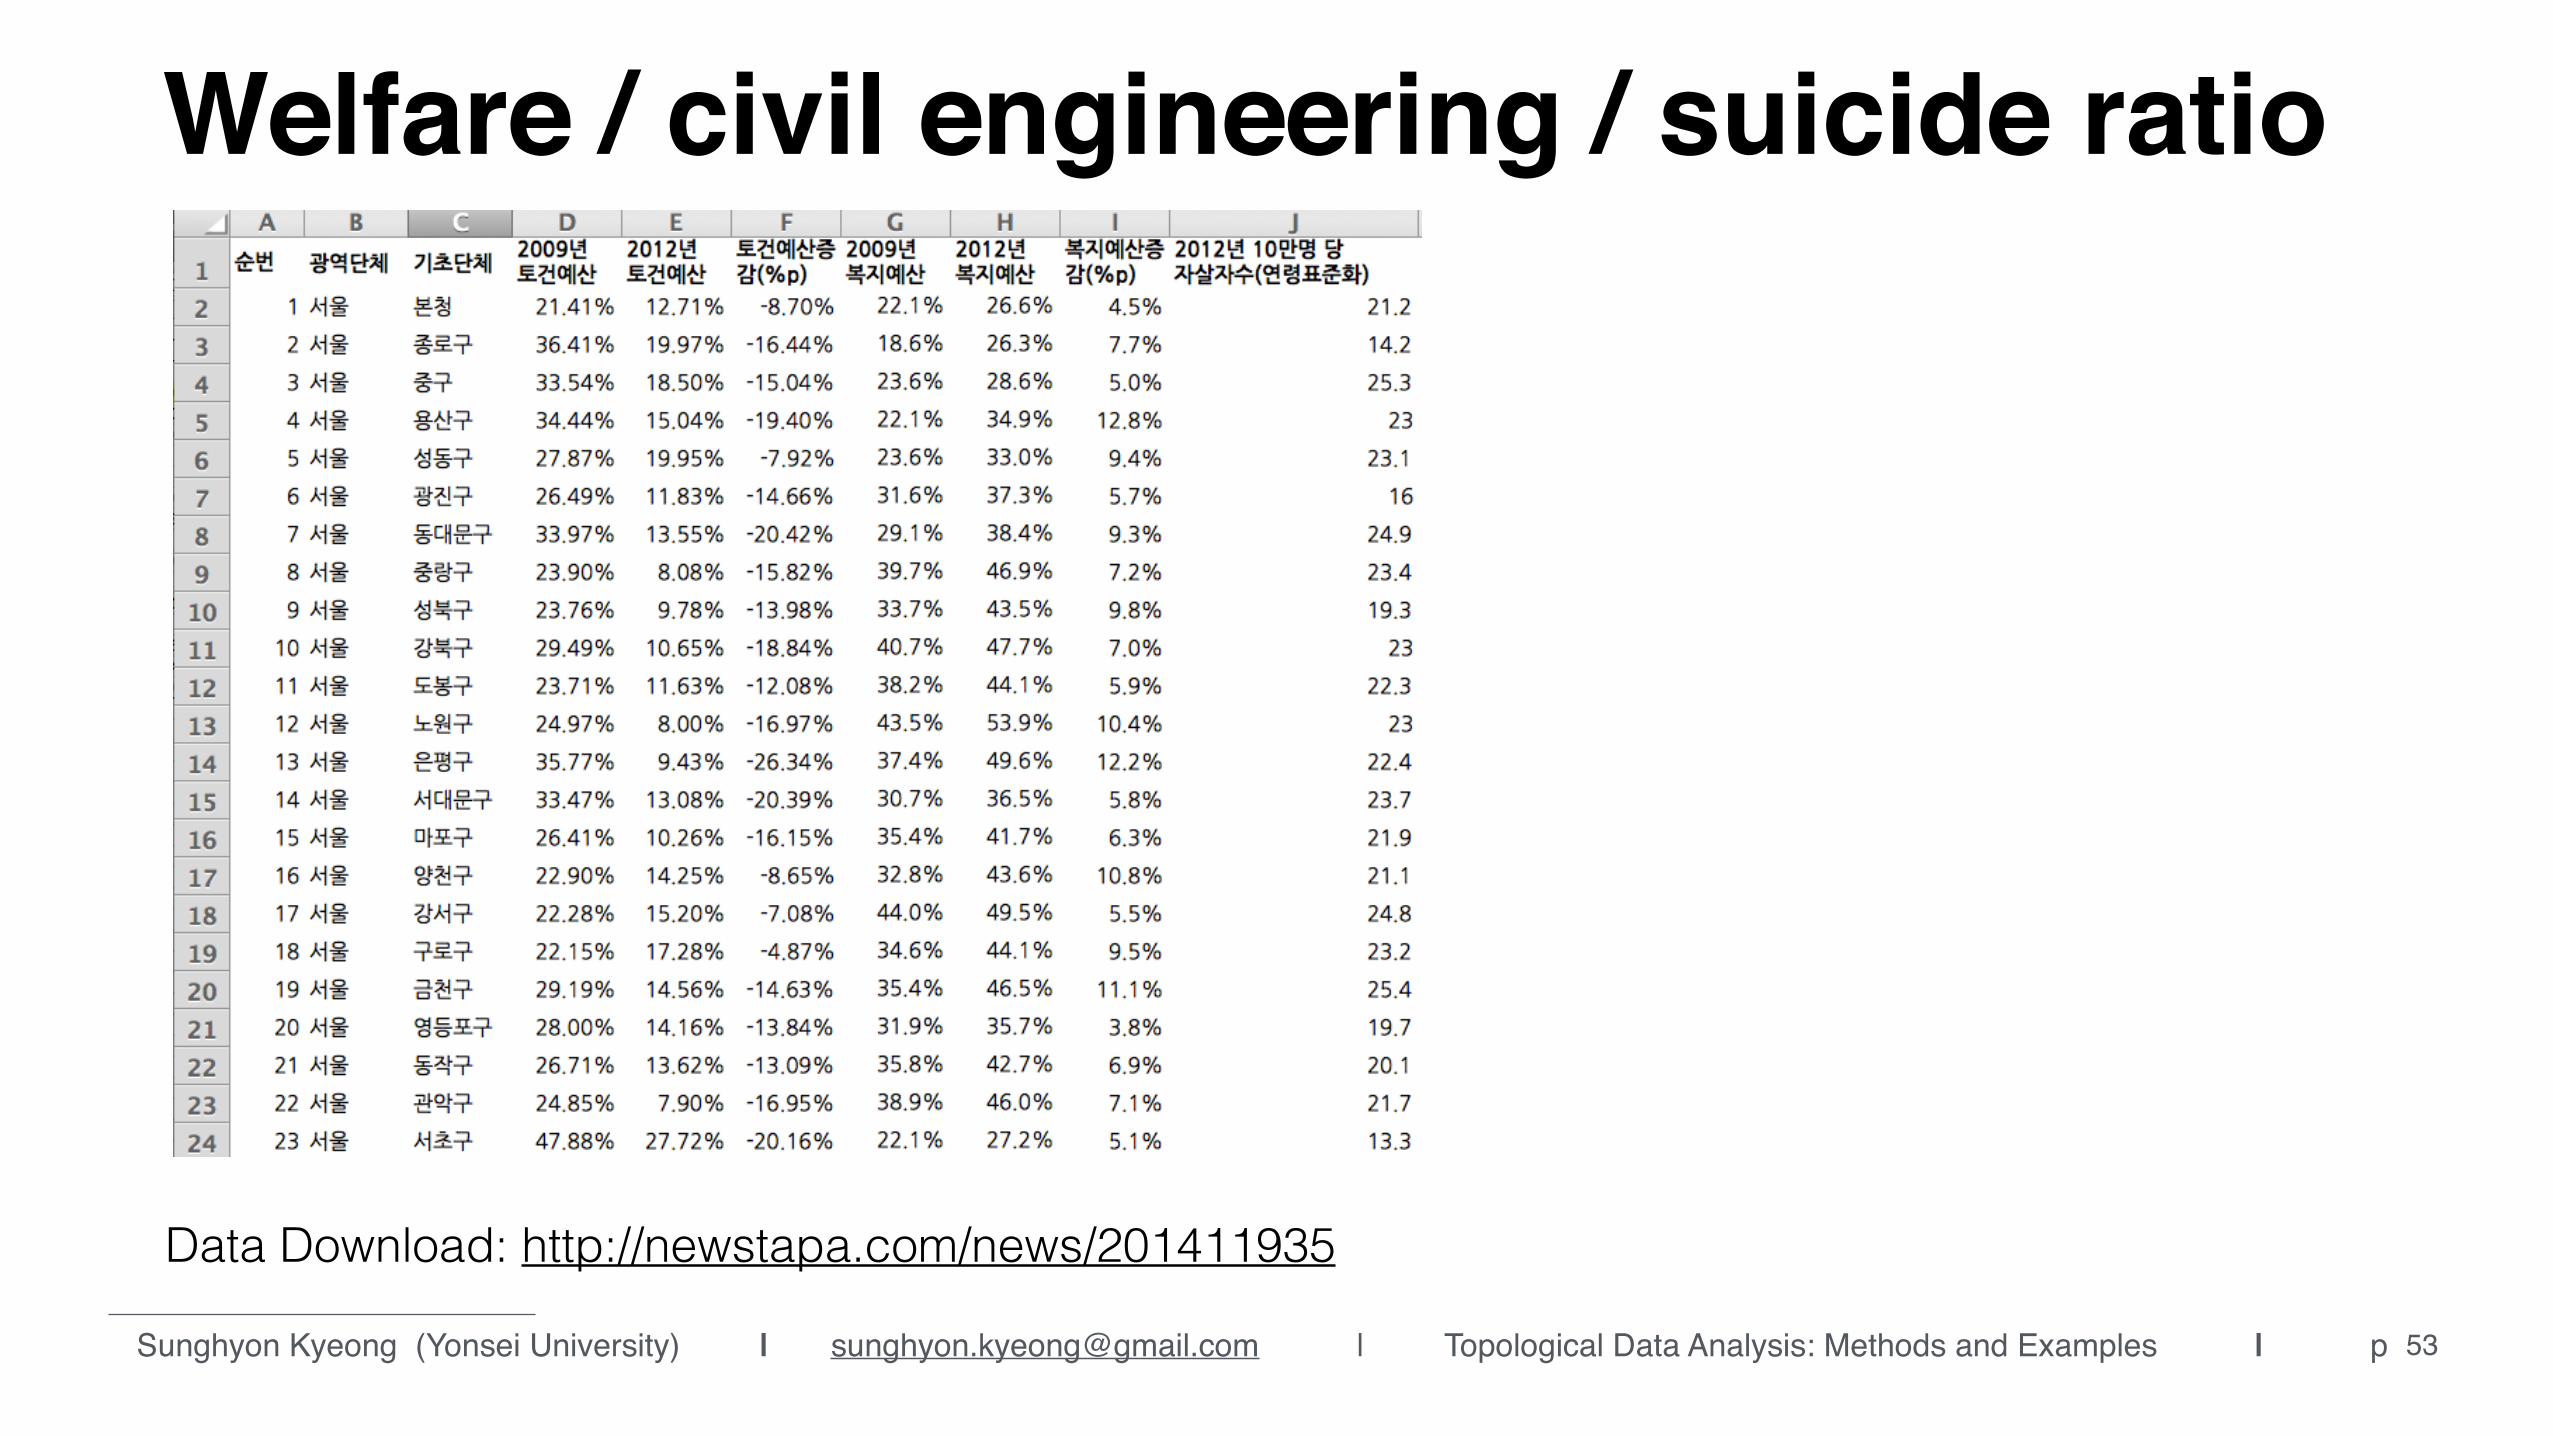
Welfare / civil engineering / suicide ratio
Data Download: http://newstapa.com/news/201411935

Sunghyon Kyeong (Yonsei University) | [email protected] | Topological Data Analysis: Methods and Examples | p 54
Nation’s public data analysis
Distance function: L2-distance Filter function: L-infinity eccentricity
Input data: ratio of welfare to civil engineering (2009), ratio of welfare to civil engineering (2012), Suicide rate (2012)
부산(남구)인천(연수구, 남동구, 서구)광주(동구)강원(본청)
광주(북구) 전북(본청) 대구(북구)
서울(노원구) 대구(달서구) 대전(서구)
강원(홍천, 양양) 충북(단양) 전북(장수) 전남(함평) 경남(함양)
Group 1Group 3
Group 2
Group 4
Low High

Sunghyon Kyeong (Yonsei University) | [email protected] | Topological Data Analysis: Methods and Examples | p 55
0
1
2
3
4
5
6
7
Group1 Group3Group2 Group4
Ratio of Welfare to Civil Eng. (2009) Ratio of Welfare to Civil Eng. (2012)
Group1 Group2 Group3 Group4
Suicide ratio (2012)
70
60
50
40
30
20
10
0
광주(북구) 전북(본청) 대구(북구)
서울(노원구) 대구(달서구) 대전(서구)
강원(홍천, 양양) 충북(단양) 전북(장수) 전남(함평) 경남(함양)
부산(남구)인천(연수구, 남동구, 서구)광주(동구)강원(본청)
Blog posting: http://skyeong.tistory.com/136/
Welfare | Civil Eng. | Suicide ratio

Sunghyon Kyeong (Yonsei University) | [email protected] | Topological Data Analysis: Methods and Examples | p 56
Topological Data Analysis,new weapon for discovering new insight from data.

Sunghyon Kyeong (Yonsei University) | [email protected] | Topological Data Analysis: Methods and Examples | p
Conclusion• TDA can be applied to various dataset and has a coordinate free
characteristic.
• Useful for analysing non-linear dataset.
• Selection and optimisation of distance and filter metric are important issue.
• TDA will be a powerful weapon for those who want to find a new insight from data
• It’s possible to make a supervised machine learning system using TDA.
57

Sunghyon Kyeong (Yonsei University) | [email protected] | Topological Data Analysis: Methods and Examples | p
References1. Gurgeek Singh et al., Topological Methods for the Analysis of High Dimensional Data Sets and
3D Object Recognition, Eurographics Symposium on Point-Based Graphics, 2007.
2. Gunnar Carlsson, Topology and Data, Bull. Amer. Math. Soc. 46(2):255-308, 2009.
3. Monica Nicolau et al., Topology based data analysis identifies a subgroup of breast cancers with a unique mutational profile and excellent survival, PNAS 108(17):7265-7270, 2011.
4. P. Y. Lum et al., Extracting insights from the shapes of complex data using topology, Nature Scientific Reports 3:1236, 2013.
5. Li Li et al., Identification of type 2 diabetes subgroups through topological analysis of patients similarity, Science Translational Medicine 7(311):311ra174, 2015.
6. Jessica L. Nielson et al., Topological data analysis for discovery in preclinical spinal cord injury and traumatic brain injury, Nature communications 6:8581, 2015.
7. AYASDI, a commercial software for TDA, http://www.ayasdi.com/
58