Embed Size (px)
Citation preview

Sc
FTIa
Ub
Ic
d
e
f
g
a
ARRA
KVPFPE
1
ii
mno
0h
Agricultural and Forest Meteorology 187 (2014) 22– 35
Contents lists available at ScienceDirect
Agricultural and Forest Meteorology
jou rn al hom epage : www.elsev ier .com/ locate /agr formet
imultaneous leaf- and ecosystem-level fluxes of volatile organicompounds from a poplar-based SRC plantation�
ederico Brilli a,b,∗, Beniamino Gioli c, Donatella Zonad, Emanuele Pallozzie,erenzio Zenonea, Gerardo Fratini f, Carlo Calfapietrae, Francesco Loretog,van A. Janssensa, Reinhart Ceulemansa
Department of Biology, University of Antwerp, Research group of Plant and Vegetation Ecology, Research Group of Plant and Vegetation Ecology,niversiteitsplein 1, B-2610 Wilrijk, BelgiumNational Research Council, Institute of Agro-Environmental and Forest Biology (IBAF-CNR), Via Salaria Km 29,300 – 00016 Monterotondo Scalo„ Roma,
talyNational Research Council, Biometeorology Institute (IBIMET-CNR), Via G. Caproni 8-50145, Firenze, ItalyDepartment of Animal and Plant Sciences, University of Sheffield, Western Bank, S10 2TN Sheffield, UKNational Research Council, Institute of Agro-Environmental and Forest Biology (IBAF-CNR), Via Marconi 2 – 05010 Porano, Terni, ItalyLI-COR Biosciences GmbH, Siemensstr. 25a-61352, Bad Homburg, GermanyNational Research Council, Department of Biology, Agriculture and Food Sciences (CNR-DISBA), piazzale Aldo Moro 7-00185 Roma, Italy
r t i c l e i n f o
rticle history:eceived 26 July 2013eceived in revised form 6 November 2013ccepted 18 November 2013
eywords:OCTR–TOF–MSluxesoplarddy covariance
a b s t r a c t
Emission of carbon from ecosystems in the form of volatile organic compounds (VOC) represents a minorcomponent flux in the global carbon cycle that has a large impact on ground-level ozone, particle andaerosol formation and thus on air chemistry and quality. This study reports exchanges of CO2 and VOCbetween a poplar-based short rotation coppice (SRC) plantation and the atmosphere, measured simul-taneously at two spatial scale, one at stand level and another at leaf level. The first technique combinedProton Transfer Reaction “Time-of-Flight” mass spectrometry (PTR–TOF–MS) with the eddy covariancemethod, to measure fluxes of a multitude of VOC. Abundant fluxes of isoprene, methanol and, to a lesserextent, fluxes of other oxygenated VOC such as formaldehyde, isoprene oxidation products (methyl vinylketone and methacrolein), methyl ethyl ketone, acetaldehyde, acetone and acetic acid, were measured.Under optimal environmental conditions, isoprene flux was mostly controlled by temperature and light.Differently, methanol flux underwent a combined enzymatic and stomatal control, together involvingenvironmental drivers such as vapour pressure deficit (VPD), temperature and light intensity. Moreoverfair weather condition favoured ozone deposition to the poplar plantation.
The second technique involved trapping the VOCs emitted from leaves followed by gaschromatography-mass spectrometry (GC–MS) analysis. These leaf-level measurements showed thatemission of isoprene in adult leaves and of monoterpenes in juvenile leaves are widespread across poplargenotypes. Detection of isoprene oxidation products (iox) emission with leaf-level measurements con-firmed that a fraction of isoprene may be already oxidized within leaves, possibly when isoprene copeswith foliar reactive oxygen species (ROS) formed during warm and sunny days.
. Introduction
Bioenergy is gaining considerable attention among public andndustrial investment (EU, 2009; U.S., 2011) and will inevitablymply a future expansion of landmass available for biomass-based
� This is an open-access article distributed under the terms of the Creative Com-ons Attribution-NonCommercial-No Derivative Works License, which permits
on-commercial use, distribution, and reproduction in any medium, provided theriginal author and source are credited.∗ Corresponding author. Tel.: +39 (0)6 90672525; fax: +39 (0)6 9064492.
E-mail address: [email protected] (F. Brilli).
168-1923/$ – see front matter © 2013 Elsevier B.V. All rights reserved.ttp://dx.doi.org/10.1016/j.agrformet.2013.11.006
© 2013 Elsevier B.V. All rights reserved.
energy sources over the next 20 years (Fisher et al., 2010; Özdemiret al., 2009). Producing bioenergy from woody biomass is indeedbeneficial on marginal lands where the potential for food pro-duction is minor and tree cultivation can become a competitiveland-use (IPC, 2013).
Poplars (Populus spp.) are particularly suitable to provide a con-stant supply of woody biomass since they are fast growing trees(Weih, 2004) with high rates of photosynthesis (Vitousek, 1991).
Therefore, poplars have the potential to mitigate rising atmosphericCO2 concentration through their high uptake of carbon and produc-tion of considerable amounts of biomass, especially when grownas short-rotation coppice (SRC) (Calfapietra et al., 2010). However,
Forest
a(asvpfgt
biiio(e(v(prt4L
p(po2c(ie
ecoalta2
somchtitlceoilkehleeg
F. Brilli et al. / Agricultural and
future intensive use of SRC might impact on land use changeFargione et al., 2008) and on the greenhouse gas emissions to thetmosphere (Searchinger et al., 2008). In addition, re-emission ofmall amounts of carbon in the atmosphere in the form of reactiveolatile organic compounds (VOC) (Guenther et al., 1993) cou-led with elevated concentrations of nitrogen oxides (NOx) andavorable conditions of sunlight and temperature, may promoteround-level ozone formation (Ashworth et al., 2013) and enhancehe formation of aerosols (Kulmala et al., 2001).
Isoprene is among the main VOC released in the atmospherey many plants. Populus spp. are known to be among the strongest
soprene-emitting plant species (Guidolotti et al., 2011). Generally,soprene-emitting plants do not emit substantial amounts of othersoprenoids (Kesselmeier and Staudt, 1999), but low emissionsf monoterpenes have been reported in young Populus tremulaHakola et al., 1998) and Populus x euroamericana leaves (Brillit al., 2009), as well as in leaves attacked by herbivorous insectsBrilli et al., 2009). Isoprene and monoterpenes (collectively calledolatile isoprenoids) are produced directly from photosynthatesLoreto and Sharkey, 1990; Loreto and Schnitzler, 2010) by iso-rene synthase (IspS) and monoterpenes synthases (TPS) enzymes,espectively. The two classes of enzymes respond exponentiallyo rising temperature having optimum activities between 40 and5 ◦C (Monson et al., 1992; Sharkey and Yeh, 2001; Staudt andhoutellier, 2011).
Within leaves, isoprene can act as an antioxidant and protectlants against the excessive production of reactive oxygen speciesROS), such as singlet oxygen (1O2), superoxide (O2
�−), hydrogeneroxide (H2O2) and hydroxyl radicals (�OH) resulting from abi-tic stress conditions (Loreto and Velikova, 2001; Vickers et al.,009). In addition, isoprene can play an intriguing ecological role,ontributing to regulate stress-related internal signaling processesFarmer, 2001; Velikova et al., 2005, 2012), and influencing plant-nsect communication (Laothawornkitkul et al., 2008; Loivamaäkit al., 2008; Brilli et al., 2009).
Among the most abundant VOC emitted ubiquitously from veg-tation (Loreto and Schnitzler, 2010), methanol is produced duringell expansion, when cell wall pectins are degraded by the actionf pectin methylesterase (PME) enzymes (Gaffe et al., 1994). As
water-soluble compound able to dissolve in liquid pools withineaves, methanol emission strongly depends on stomatal conduc-ance (Niinemets et al., 2004). The diurnal rates of cell growthlso seem to affect methanol production and emission (Hüve et al.,007; Oikawa et al., 2011).
Whereas methanol is a quite stable compound in the atmo-phere, having a rate constant for gas-phase reaction with �OHf 0.94 × 1012 cm3 molecule−1 s−1, isoprene and monoterpenes areuch more reactive, having 100-fold higher �OH reaction time
onstants (Atkinson and Arey, 2003). Moreover, many isoprenoidsave faster reaction time with ozone and thus photochemical reac-ions often involve both O3 and isoprenoids. Although ozone isnitially destroyed, it is successively regenerated with a final posi-ive balance in favor of O3. Consequently, when nitric oxides (NOx),ight and high temperature combine, volatile isoprenoids directlyontribute to the formation of ground-level ozone (Chameidest al., 1988), particles (Kiendler-Scharr et al., 2009) and secondaryrganic aerosol (Claeys et al., 2004), thereby affecting air chem-stry and air quality at regional and global level. Isoprene oxidationeads to the formation of first-order products, mainly methyl-vinyletone (MVK) and methacrolein (MACR) (Pierotti et al., 1990; Pinhot al., 2005). Different field campaigns and laboratory experimentsave recently demonstrated that MVK + MACR (referred to here col-
ectively as iox) can be either taken up (Karl et al., 2010; Misztalt al., 2011) or emitted by the canopy (Langford et al., 2010; Jardinet al., 2012). If an iox flux exits the canopy, as well as the leaf of aas-exchange cuvette in which the residency of air is very short,
Meteorology 187 (2014) 22– 35 23
then isoprene undergoes oxidation already within leaves, possiblyby reacting with ROS abundantly produced under stressful condi-tions (Loreto and Velikova, 2001; Jardine et al., 2012; Brilli et al.,2012).
In bio-energy plantations, combined flux measurements of VOCand carbon have to date only been made in an oil palm planta-tion in south-east Asia (Misztal et al., 2011). Because poplars areincreasingly used in bio-energy plantations in the temperate zone(Migliavacca et al., 2009; Cai et al., 2011) and are strong isopreneemitters (Guidolotti et al., 2011), it is important to study their VOCfluxes in relation to site carbon balance and environmental drivers.Here we used a combination of leaf- and ecosystem-scale mea-surements to collate fluxes of carbon (both as photosynthesis andas VOC) and ozone during two weeks of rapid growth of a poplarplantation in July 2012. The specific objectives of this study wereto:
(1) measure ecosystem-level eddy covariance fluxes of a multi-tude of VOC to investigate how environmental factors influenceemissions of multiple VOC and CO2 uptake in the short-term;
(2) assess how CO2 uptake through photosynthesis correlates withre-emission of carbon in the form of volatile isoprenoids injuvenile versus adult leaves of five different poplar genotypes;
(3) combine leaf- and ecosystem-level data to quantify the impor-tance of within-plant isoprene oxidation, leading to primaryemission of iox.
2. Materials & methods
2.1. Field study site
The PopFull (http://webh01.ua.ac.be/popfull) experimental bio-energy poplar plantation is located in Lochristi (51◦04′44′ ′N,3◦51′02′ ′E) (Belgium) at an elevation of 6 m a.s.l. in a completelyflat terrain. Poplars were coppiced in January, 2012 and new shotsstarted to sprout on May, 2012. A more detailed description ofthe study site as well as footprint analysis is given by Zona et al.(2012, 2013) and Broeckx et al. (2012). In addition, a leaf area index(LAI) = 3.5 ± 1 was directly measured during this study (Sarzi-Falchiet al., personal communication).
2.2. Eddy covariance (EC)
Two eddy covariance systems were installed on the same towerin the north-east corner of the field site:
(1) a greenhouse gasses (GHG)-eddy system was equipped witha sonic anemometer (CSAT-1, Campbell Scientific Inc., Logan,UT, USA) coupled with a closed-path infrared gas analyzer(LI-7000, LI-COR Biosciences Inc., Lincoln, NE, USA) and achemiluminescence-based fast ozone sensor (model LOZ-3F,Drummond Technology Inc., Ontario, Canada) to measure CO2,H2O and O3 fluxes (Zona et al., 2014). Data recorded from thesedevices were collected and synchronized with a data-logger(model CR3000 & CR5000, Campbell Scientific Inc.) at 10 Hzsampling frequency (Zona et al., 2012, 2013);
(2) a VOC-eddy system including a sonic anemometer (modelUSA1, Metek GmbH, Elmshorn, Germany) coupled with aproton transfer reaction “Time-of-Flight” mass spectrometer(PTR–TOF–MS) (Ionicon, Innsbruck, Austria) to measure vol-
ume mixing ratios (VMRs) of VOC. The data streams of theanemometer and the PTR–TOF–MS were acquired indepen-dently by two different computers and synchronized with adedicated software (NTP, Network Time Protocol, University of
2 Forest
d1SI
t(
2
2
((acsroihfa(mwo
Rte∼dP
(rw
−
2
erSt
rogTlbproftlwl
4 F. Brilli et al. / Agricultural and
Delaware, DE, USA) to an independent external clock throughthe Internet, with an accuracy <20 ms.
The two eddy covariance systems were completely indepen-ent, although they were installed very close to each other, with
m spatial separation between the inlets of the two sampling lines.eparate Teflon® sampling lines (each one ∼15 m long and 8.0 mmD) for each eddy covariance system were set up.
Here, positive fluxes represent transport from the canopyoward the atmosphere (emission), negative ones the reversedeposition).
.3. Eddy covariance fluxes calculation
.3.1. GHGThe computation of CO2, ozone, latent heat (LE), sensible heat
H), momentum fluxes was made with the EddyPro softwarewww.licor.com/eddypro, Fratini et al., 2012). A two-componentxis rotation was adopted, while the automatic maximization ofross covariance was used to determine the lag-time for passivecalars, which was about 2 s. A drop-out filter was applied toemove the zeroing periods (10 s h−1) from the 10 Hz dataset ofzone data. Frequency response correction was performed accord-ng to the analytical method of Moncrieff et al. (1997) to estimateigh frequency attenuation, and according to Moncrieff et al. (2004)
or low frequency correction (high pass filtering). A sensor sep-ration correction was applied according to Horst and Lenschow2009). Data were filtered based on the following criteria: during
alfunctioning of the instruments, calibration and maintenance,hen electric spikes occurred, and when the wind direction was
utside of the footprint of interest (i.e. >250◦ and <50◦).CO2 flux was gap-filled and then partitioned into Ecosystem
espiration (RECO) and Gross Primary Production (GPP) usinghe Marginal Distribution Sampling (MDS) method (Reichsteint al., 2005) implemented in http://www.bgc5jena.mpg.de/MDIwork/eddyproc/index.php and adopted by FLUXNET for stan-ardized gap-filling and flux-partitioning (Moffat et al., 2007;apale et al., 2006).
RECO was derived from nighttime net ecosystem exchangeNEE) and then extrapolated to daytime conditions using theegression model of Lloyd and Taylor (1994). Nighttime NEE dataere selected using a global radiation threshold of 20 W m−2.
Gross primary production (GPP) was calculated as:GPP =∣∣NEE
∣∣ +
∣∣RECO
∣∣
.3.2. VOCIn order to standardize the computation of VOC fluxes with the
ddy-covariance method and thus enable the application of all theequired processing steps to a multitude of VOC concentrations (Fig.3), EddyPro software was modified into a new customized versionhat we named EddyVoc.
The processing routine programmed in EddyVoc, first maskedaw data with a quality flag to exclude individual spikes, valuesut-of-range (such as negative concentration values) and back-round calibration periods of the PTR–TOF from further processing.hen, double rotations for tilt correction (Wilczak et al., 2001),inear de-trending (Rannik and Vesala, 1999), time-lag estimationased on the covariance maximization (Aubinet et al., 2000) wereerformed. Since isoprene exhibited the strongest signal-to-noiseatio in the covariance with vertical velocity during the periodf measurements, it was used to compute the 30-min time-lagsor all other VOC species, assuming that all VOC were subject
o the same physical turbulent transport across the samplingine (Fares et al., 2012). In a final step, corrections for flux lossere applied as sensor separation (Horst and Lenschow, 2009),ow frequency correction (Moncrieff et al., 2004). Actual spectral
Meteorology 187 (2014) 22– 35
correction factors were calculated according to the model of Ibromet al. (2007), Eq. (9), parameterized after the refinements of Fratiniet al. (2012). Resulting flux correction factor was 1.20 on average(i.e. estimated flux loss of 20%), ranging from about 1 to about 1.6depending on atmospheric stability and turbulence conditions.
More details on the methodology used for in-situ spectral anal-ysis and flux corrections (Fig. S1) as well as correlation betweensensible heat flux measured by the (GHG)-eddy system and VOC-eddy system (Fig. S2), and time-series measurements of volumemixing ratios (VMRs) of VOC (Fig. S3) are given in SupplementaryData.
2.3.3. Quality controlQuality controls on half-hourly fluxes were applied according
to Göckede et al. (2004), resulting in an overall quality flag (0 forgood data, 1 for acceptable data, 2 for bad data) assigned to eachflux value. Friction velocity threshold was estimated at 0.12 m s−1
by assessing when the nighttime NEE dependence on u* reachessaturation. Finally, VOC fluxes random uncertainty was estimatedwith EddyVoc by using the method of Finkelstein and Sims (2001).
2.4. PTR–TOF–MS set-up and operations
At ecosystem-level, a Proton Transfer Reaction “Time-of-Flight”Mass Spectrometer (PTR–TOF–MS) (Ionicon, Innsbruck, Austria)described by Jordan et al. (2009) and Graus et al. (2010) wasused to record high-resolved mass spectra of VOC (up to m/z 315)at high frequency (10 Hz). The whole dataset recorded between16th and 28th of July was post-processed to screen for the pres-ence of emitted/deposited fluxes of the most common protonatedmolecules or fragments of VOC, excluding instrumental signals pro-duced by the PTR–TOF–MS itself such as major primary ions (e.g.H3O+,·H2O–H3O+) and impurities (e.g. O2
+, NO+, NH4+). VOC were
detected through proton transfer reactions occurring between theH3O+ ions produced within the ion source and the air sampleinserted into the drift tube which is kept under controlled con-ditions of: pressure (2.3 mbar), temperature (50 ◦C) and voltage(600 V) resulting in an ionization energy (E/N) of ≈120 Td. All pro-tonated ions were extracted from the drift tube, pulsed every 30 �s,separated according to their m/z ratio in the time-of-flight regionand detected in conjunction with a multi-channel-plate (MCP, BurleIndustries Inc., Lancaster, PA, USA).
In our set-up, ambient air was drawn at a constant flow rate of∼30l min−1 through the VOC-eddy system sampling line heated at40 ◦C in order to maintain both a higher Reynolds number in thetubing (Re > 6000) and to ensure reduced line pressure that pro-tects against condensation. The last meter of the main pipeline wasconverted first from 8.00 mm to 1/8′ mm ID and then from 1/8′ to1/16′ mm ID to match the capillary inlet of the PTR–TOF–MS system.
Raw PTR–TOF–MS data were acquired at 10 Hz sampling rateby the TofDaq software (Tofwerk AG, Switzerland), then mergedand averaged to 6 min, and post-processed by routine programs(Müller et al., 2010, 2013). In order to assign an exact mass scale,and later the sum formula to the detected ions, the mass scale accu-racy of all the recorded spectra was calibrated by exploiting twowell-defined PTR–TOF–MS background ion peaks (m/z = 21.022 andm/z = 39.033 related to H3O18+ and·H2O-H3O18+, respectively), andby inserting 1,2,3 trichlorobenzene (m/z = 180.937) to the sampleinlet system through a diffusive cell. A more detailed descriptionof the PTR–TOF–MS data analysis is given elsewhere (Müller et al.,2013).
The background signals of the PTR–TOF–MS were quantified
for the first 6 min of every hour via an automation system ofswitching valves that introduced VOC-free air generated by acommercially available gas calibration unit (GCU) (Ionimed, Inns-bruck, Austria). The same GCU has been employed to calibrate
Forest
tacttp(orao(t(cV
2
p1CPsI(g5m2icseobiorg3pp
2
HeIfaC
wc
ocPVsct(
F. Brilli et al. / Agricultural and
he PTR–TOF–MS sensitivity once a week at ambient humidity bydding a multi-component gravimetrically prepared gas standard,ontaining: methanol (m/z 33.033), acetaldehyde (m/z 45.033), ace-one (m/z 59.049), isoprene (m/z 69.070), MVK + MACR (m/z 71.049),-2-hexen-1-al (m/z 99.081), c-3-hexen-1-ol (m/z 101.061) and �-inene (m/z 137.133) at nominal concentration of 1 ppmv eachApel Riemer, USA). All standards were diluted with VOC-free air inrder to achieve various concentration levels of VOC in the low ppbange (1-20 ppb) with the same relative humidity as the sampledmbient air. Sensitivities were extrapolated from linear regressionsf the known VOC mixing ratios and the respective signal intensitiesthus already including transmission coefficient) after subtractinghe average background levels. As proposed by Ruuskanen et al.2011) we used the average normalized sensitivities for oxygenontaining compounds and for pure hydrocarbons to calibrate theOC that were not present in the gas standard.
.5. Leaf gas exchange
At leaf level, gas exchange measurements of CO2 and H2O wereerformed daily in situ from 23th to 27th of July (2012) between0:00 and 17:00 by using a portable gas exchange system (LI-OR6400, LI-COR Biosciences Inc., Lincoln, NE, USA) on 5 differentopulus genotypes (Grimminge, Koster, Oudenberg, Skado, Wolter-on) placed within the footprint of the eddy covariance tower.n each one of the selected poplar genotypes, 5 ± 1 young leaveswhose expansion was lower than 30% of full leaf expansion, i.e.enerally the third leaf expanding from the vegetative apex), and
± 1 mature leaves (fully expanded and generally placed in theiddle of the stem, 10–12 leaves from the apex) (Brilli et al.,
009) of 5 ± 1 different trees were chosen. Leaves were clampedn the 6 cm2 LI-COR cuvette, and photosynthesis (A), stomatalonductance (gs) and internal CO2 concentration (Ci) were mea-ured using the LI-COR software. All the enclosed leaves werexposed to: saturating photosynthetic photon flux density (PAR)f 1000 �mol m−2 s−1, CO2 concentration of 380 ppmv (achievedy fully scrubbing CO2 from ambient air with soda lime and replac-
ng it with the LI-COR6400 CO2-injector system), leaf temperaturef 25 ◦C, and relative humidity ranging between 45 and 50%. Respi-ation rates were measured with the same LI-COR6400 portableas-exchange system on leaves that had been dark adapted for0 min following the measurement of net photosynthesis and iso-rene emission rate. Gross photosynthesis was defined as: |nethotosynthesis| + |respiration|.
.6. VOC collection and GC–MS analysis
At leaf-level, VOC were detected simultaneously with CO2 and2O gas exchange measurements by concentrating 6 L of the airxiting the cuvette in cartridges filled with 250 mg of Tenax (Markesnternational Limited, Llantrisant, UK). All VOC were removedrom ambient air before flushing the gas exchange cuvette, with
charcoal filter (Supelco, Bellafonte, USA) placed ahead of the LI-OR6400 inlet.
In addition, on 22–28 of July, between 12:00 and 17:00, VOCere also occasionally sampled directly from the EC tower by con-
entrating 6 L of ambient air in Tenax cartridges.After collection, all the adsorbed cartridges were thermally des-
rbed and the released compounds were then detected by gashromatography-mass spectrometry (GC–MS) (HP5890; Hewlett-ackard, Palo Alto, CA, USA) as shown in detail by Brilli et al. (2009).OC background was measured every day before starting the mea-
urements by collecting 6 L of air exiting the empty LI-COR6400uvette. The GC–MS was calibrated by sampling different concen-rations of VOC produced after dilution of the same gas standardApel Riemer, USA) by the GCU device, as described above. BothMeteorology 187 (2014) 22– 35 25
leaf- and ecosystem-level GC–MS analysis unambiguously con-firmed that the signal at m/z = 69.070 detected by PTR–TOF–MS andassigned here to isoprene did not have any interference from thefragment of 2-methyl-1-butanol, which have the same exact massweight.
2.7. Ancillary data
Supporting meteorological measurements were recorded con-tinuously and data were stored in several data loggers (modelCR3000, CR5000 and CR1000; Campbell Scientific, Logan, Utah,USA); in particular: Incoming PAR was measured above the canopyusing a quantum sensors (Li-190; LI-COR, Lincoln, NE, USA); airtemperature (Tair) and water pressure deficit (VPD) were recordedat 6-m height on the eddy covariance tower; volumetric soil watercontent (SWC) was assessed at 0.1-m depth in the proximity of theeddy covariance installation, by time domain reflectrometry (TDRmodel CS616; Campbell Scientific, Logan UT, USA); precipitationwas recorded by using a tipping bucket rain gauge (model 3665R;Spectrum Technologies Inc., Plainfield, IL, USA); NOx concentra-tions were measured by using a Chemoluminescent NO/NO2/NOx
analyser, model 42i (Thermo Fisher Scientific, Aalst, Belgium).Ecosystem flux parameters were best-fitted with light, temper-
ature and VPD by using SigmaPlot version 11.0 (Systat SoftwareInc., San Jose, CA, USA).
3. Results
3.1. Climate and meteorological data
Two very different meteorological conditions characterized themeasurements period (Fig. 1). During the initial days (16–21 of July)measurements were carried out under overcast sky and a cold tem-perature regime (∼15 ◦C), with few small rainfall events (Fig. 1b).During this period, the maximum incoming PAR flux remained lessthan 700 �mol m−2 s−1 (Fig. 1a).
A change in wind speed, direction, and turbulence occurred dur-ing the night of 20th of July (Fig. 1c and d), without any immediatechange in temperature. However, during the following night (22thof July), the sky cleared up as confirmed by a drop in temperaturethat reached the minimum value of ∼9 ◦C at 06:00 (Fig. 1a). All thefollowing days of measurements (22–28 July) were characterizedby good weather conditions, high incoming PAR fluxes (reachingmaximum intensity of ∼1500 �mol m−2 s−1 at noon), air tempera-tures rising to 28 ◦C (Fig. 1a) and absence of rainfall (Fig. 1b). Higherair temperatures recorded during the second part of the measure-ments period also triggered an increased evaporative demand (i.e.increased VPD) of the atmosphere (Fig. 1e). In this second part of theexperiment, a drop in PAR was registered during every afternoon(at around 18:00) as a consequence of low altitude cloud forma-tion from water vapor condensation occurring during the hottesthours of the day (Fig. 1a). Despite this change in weather conditions,soil water content (SWC) level remained high and fairly constantthroughout the entire study period (Fig. 1b), thus excluding anydrought impact.
Whilst during the initial cold period of measurements (16–21July) compounds such as ozone (O3), nitric oxide (NO) and nitro-gen dioxide (NO2) (together referred to as NOx) were almost totallyabsent at the site (Fig. 1f and g), NOx concentration increased start-ing from 20th of July morning.
3.2. Fluxes at ecosystem-level
Patterns of gross primary production (GPP) displayed no signifi-cant changes during the whole period of investigation, regardless of

26 F. Brilli et al. / Agricultural and Forest Meteorology 187 (2014) 22– 35
Fig. 1. Meteorological and physiological characterisation of the measured period at the field site from 16 to 28 July (2012), showing half-hour averages of: (a) incidentp soil wa 5 m s−
N e eco
to(pr
rdoaw(mmtiad
pptttai
hotosynthetically active radiation (PAR) and air temperature (TA), (b) volumetric
nd wind direction, (d) friction velocity (u*) and friction velocity threshold u* < 0.1Ox concentrations in ambient air, (h) net ecosystem CO2 exchange (NEE), night tim
he increases in PAR and temperature that occurred during the sec-nd measuring period (Fig. 1h). However, net ecosystem exchangeNEE) was considerably reduced during the latest part of the cam-aign by an increase in ecosystem respiration (RECO) resulting in aelatively constant values of GPP (Fig. 1h; Table 1).
Fluxes of the protonated ions m/z = 33.033 and m/z 69.070, cor-esponding to methanol and isoprene, respectively, were clearlyetected from 22th of July onwards, following the increasef PAR and temperature (Fig. 1a; Fig. 2; Fig. 3; Table 1). To
lesser extent, fluxes of other oxygenated-protonated ionsere also detected as: m/z = 31.018 (formaldehyde), m/z = 45.034
acetaldehyde), m/z = 59.049 (acetone), m/z = 61.028 (acetic acid),/z = 71.049 (iox), m/z = 73.068 (methyl ethyl ketone, MEK). Fluxeasurements indicated that isoprene was always emitted from
he canopy (Fig. 2). Other oxygenated-VOC were either releasednto the atmosphere or deposited to the vegetation, (Figs. 2 and 3),lthough methanol was also mainly emitted except for some smalleposition events (Fig. 3).
Isoprene was the most abundant VOC emitted from the poplarlantation (Fig. 2; Table 1). Its exchange with the atmosphere dis-layed a diurnal trend that was more pronounced in the warmerhan in the cold period (Fig. 3; Table 1). Isoprene always started
o be emitted at dawn (∼6:00), and emissions peaked twice duringhe day: first at noon in correspondence with the maximum of PAR,nd then between 15:00 and 16:00 when the temperature rose tots maximum (and light was less intense but more scattered dueater content (SWC; at 0.1 m depth) and daily totals of precipitation, (c) wind speed1, (e) vapour pressure deficit (VPD) and evapotraspiration (ET), (f) O3, (g) NO, NO2,system respiration (RECO) and gross primary production (GPP).
to the presence of low clouds). Both peak emissions of isoprenereached a similar rate of 6.62 ± 1.20 and 6.78 ± 1.47 nmol m−2 s−1
(Fig. 3; Table 1). After the second peak, isoprene emission startedto decline, approaching zero in the evening, at ∼20:00 (Fig. 3;Table 1). The isoprene flux increased exponentially with tempera-ture (f(x) = q ekx, Table 3) and logarithmically with PAR (Fig. 4a, b,respectively). In contrast to isoprene emissions, GPP saturated at∼400–500 �mol m−2 s−1 of PAR (Fig. 4d), and also showed a morecomplex logarithmic relationship rather than an exponential rela-tionship with temperature than isoprene (Fig. 4c).
An exponential relationship was found that linked ecosystemGPP to isoprene emission. This relationship was not affected by theswitch between the first cold and the second warmer period (Fig. 5band c).
Along with isoprene, half-hourly averages methanol fluxes alsoexhibited a very clear diurnal cycle during the warm measurementperiod (Fig. 3). Emissions started at 6:00 and peaked twice: at noonand at ∼16:00, before decreasing slowly until 20:00 thus mirroringthe daytime course of PAR and air temperature (Fig. 3). In con-trast to isoprene fluxes, the first methanol peak emission reacheda higher rate (5.82 ± 0.29 nmol m−2 s−1) with respect to the sec-ond peak (4.46 ± 0.49 nmol m−2 s−1; Fig. 3, Table 1). As for isoprene,
between the two peaks of methanol, a singular event of reducedemission occurred at ∼14:00 when PAR started to decline. In orderto explore the environmental control on the methanol flux, wetested the relationships with the main meteorological variables:
F. Brilli et al. / Agricultural and Forest Meteorology 187 (2014) 22– 35 27
Fig. 2. Time series of half-hourly VOC fluxes measured by PTR–TOF–MS at the field site during the whole period (16–28 July, 2012). Vertical bars indicate random uncertaintya
VlflrT(
MoatTtSaNp((iwaorrT
ssociated to each measured half-hour average flux.
PD, (Fig. 6a), PAR (Fig. 6b) and temperature (Fig. 6c). A simpleinear regression described best the correlation between methanolux and VPD (R2 = 0.29, Table 3; Fig. 6a), whereas a logarithmicesponse was found between methanol flux and PAR (R2 = 0.40,able 3; Fig. 4b), as well as between methanol flux and temperatureR2 = 0.25, Table 3; Fig. 6c).
Formaldehyde was only deposited to the vegetation, whereasEK was emitted during the warmest days (Fig. 3; Table 1). More-
ver, bi-directional exchange of other oxygenated VOC such ascetone, acetaldehyde and acetic acid were measured throughouthe day during the whole period of measurements (Figs. 2 and 3;able 1). In particular, a combined burst of acetaldehyde and ace-one emission always occurred in the morning, at 8:00–8:30 (Fig. 3).imilarly, measured fluxes of iox seemed to be bi-directional,lternating short period of deposition and of emission (Fig. 2).onetheless, emissions of iox peaked together with those of iso-rene during both the cold and the warm measurement periodFig. 3) and also their temperature dependencies were comparableFig. 4a and 7b). Concentrations of iox collected at the tower dur-ng the warm measurement period (25 ± 1 ◦C) linearly correlated
ith isoprene concentrations (R2 = 0.49, Table 3), suggesting iox toccount for ∼32% of isoprene (Fig. 7a, Table 3). In addition, fluxes
f both iox and isoprene measured under different temperaturesanging from ∼8 to ∼28 ◦C fitted the function: iox = isoprene Tpoweresulting in an exponential (power) value of 3.8 ± 0.4 (Fig. 7b,able 3).
A protonated ion-flux was detected at m/z = 81.070, suggestinga flux of either a monoterpene or a main green leaves volatiles(GLVs) fragment. Unfortunately, both fluxes of molecular monoter-pene ions (m/z = 137.133) and of another main GLVs fragment(m/z = 83.085) showed values very close to the associated randomuncertainties, making difficult any discussion about monoterpenefluxes at plantation-level (Fig. 2; Table 1).
During the warming days the ambient concentration of ozonemeasured at the site increased 5-fold, and NOx increased 10-foldwith respect to the first cold period, from a daily average concen-tration of 8.12 ± 1.41 to 78.89 ± 3.62 ppbv for ozone (Fig. 1f) andfrom 25.15 ± 1.41 to 268.16 ± 22.11 ppbv for NOx (Fig. 1g). As aconsequence, the poplar plantation started uptaking troposphericozone during the second part of our measurement campaign(Fig. 3; Table 1). Ozone deposition started in the morning at 6:00(along with methanol and isoprene emission) (Fig. 3), and peakedbetween noon and 16.00, when the deposition rate was constant at17.02 ± 0.76 nmol m−2 s−1 (Fig. 3). Minimal ozone deposition wasobserved starting at 20:00 and throughout the night.
3.3. Fluxes at leaf-level
On average, juvenile leaves showed lower photosynthe-sis (3.22 ± 0.53 �mol m−2 s−1) and higher dark respirationrates (7.78 ± 0.42 �mol m−2 s−1) than adult leaves (pho-tosynthesis ∼15.76 ± 0.42 �mol m−2 s−1 and respiration

28 F. Brilli et al. / Agricultural and Forest Meteorology 187 (2014) 22– 35Ta
ble
1Su
mm
ary
stat
isti
cs
for
edd
y
cova
rian
ce
flu
xes
of
VO
C, O
3G
PP, N
EE
abov
e
the
pop
lar
pla
nta
tion
and
par
amet
ers
of
ligh
t
and
tem
per
atu
re
mea
sure
d
du
rin
g
the
two
con
secu
tive
per
iod
s
(16–
21
and
22–2
8
July
, 201
2)
of
inte
nsi
veca
mp
aign
. In
par
enth
esis
are
give
n
stat
isti
cs
valu
es
for
flu
xes
that
hav
e
succ
essf
ull
y
pas
sed
all t
he
qual
ity
crit
eria
men
tion
ed
in
Sect
ion
2.3.
3.
Ligh
t(�
mol
m−2
s−1
)
Tem
per
atu
re(◦
C)
NEE
(�m
olm
−2s−
1)
O3
(nm
ol
m−2
s−1
)
Met
han
ol(n
mol
m−2
s−1
)m
/z
=
33.0
33C
H4
O-H
+
Form
ald
ehyd
e(n
mol
m−2
s−1
)m
/z
=
31.0
18,
CH
2O
–H+
Ace
tald
ehyd
e(n
mol
m−2
s−1
)m
/z
=
45.0
34,
C2
H4
O–H
+
Ace
ton
e
(nm
olm
−2s−
1)
m/z
=
59.0
49,
C2
H4
O–H
+
Ace
tic
acid
(nm
olm
−2s−
1)
m/z
=
61.0
29,
C3
H6
O–H
+
Isop
ren
e(n
mol
m−2
s−1
)m
/z
=
69.0
70,
C5
H8
–H+
i ox
(nm
ol
m−2
s−1
)m
/z
=
71.0
49,
C4
H6
O–H
+
MEK
(nm
olm
−2s−
1)
m/z
=
73.0
68,
C4
H8
O–H
+
GLV
&m
onot
erp
enes
frag
men
t(n
mol
m−2
s−1
)m
/z
=
81.0
70,
C6
H8
–H+
m/z
83.0
85(G
LVfr
agm
ent)
(nm
olm
−2s−
1)
m/z
=
83.0
85,
C3
H10
–H+
� Mon
oter
pen
es(n
mol
m−2
s−1
)m
/z
=
137.
133,
C10
H16
–H+
16–2
1/07
/12
Mea
n
170
(280
)
15.4
9
(16.
2)
−4.4
6
(−5.
45)
−1.0
9
(−1.
12)
1.20
(1.3
4)
−9.9
9
E10−
3
(−3.
47
E10−
3)
0.84
(0.7
2)
0.08
(0.0
9)
E10−
2(−
6.74
E10−
3)
0.18
(0.3
1)
E10−
3
(1.8
2E10
−3)
E10−
3(−
6.74
E10−
3)
−3.2
8
E10−
3
(1.1
7)−3
.28
E10−
3
(−0.
01)
−2.1
1
E10−
3
(−9.
74
E10−
5)
Med
ian
244
(206
)
15.7
1
(16.
1)
−3.7
0
(−6.
36)
−1.1
5
(−0.
28)
1.39
(1.5
6)
−1.6
1
E10−
2
(−3.
59
E10−
3)
0.34
(1.0
6)
0.03
(0.0
4)
7.84
E10−
3
(−1.
44
E10−
3)
0.06
(0.1
6)
2.07
E10−
3
(0.0
1)1.
25
E10−
3
(−1.
63
E10−
3)
−2.3
8
E10−
3
(1.6
1)−2
.38
E10−
3
(−0.
01)
−4.2
9
E10−
3
(−2.
11
E10−
3)
95th
per
cen
tile
618
(916
)
17.3
3
(18.
9)
3.75
(5.4
5)
0.24
(1.3
6)
3.26
(3.1
3)
0.33
(0.3
6)
8.09
(9.7
9)
0.48
(0.6
2)
0.33
(0.1
7)
0.86
(1.1
8)
0.10
(0.1
2)
0.02
(0.0
2)
0.10
(3.4
3)
0.09
(0.1
1)
0.08
(0.0
8)
5th
per
cen
tile
23
(21)
14.2
6
(13.
4)
−15.
01(−
17.6
1)−2
.54
(−6.
51)
−1.5
2
(−1.
75)
−0.3
2
(−0.
41)
−5.1
6
(−5.
70)
−0.2
9
(−0.
35)
−0.2
3
(−0.
16)
−0.1
1
(−0.
06)
−0.0
9
(−0.
15)
−0.0
2
(−0.
02)
−0.0
6 (−
2.31
)
−0.0
7
(−0.
14)
−0.0
7
(−0.
08)
SE
34
(19)
0.16
(0.1
)
1.05
(0.5
6)
0.14
(0.1
9)
0.09
(0.1
5)
0.01
(0.0
2)
0.26
(0.6
7)
0.02
(0.0
5)
0.01
(0.0
1)
0.02
(0.0
3)
3.00
E10−
3
(9.0
7
E10−
3)
7.52
E10−
4
(1.0
0
E10−
3)
2.96
E10−
3
(0.2
5)3.
10
E10−
3
(0.0
1)3.
10
E10−
3
(4.5
4
E10−
3)
N
289
(225
)
289
(225
)
289
(225
)
289
(225
)
261
(126
)
255
(121
)
254
(123
)
251
(130
)
255
(121
)
253
(47)
253
(72)
255
(93)
253
(72)
248
(41)
240
(121
)22
–28/
07/1
2M
ean
451
(783
)
20.1
2
(25.
01)
−2.9
6
(−6.
71)
−4.0
8
(−6.
71)
1.56
(4.0
3)
−0.0
6
(−0.
08)
0.06
(0.5
7)
0.39
(0.0
4)
E10−
3(−
4.60
E10−
3)
1.51
(4.2
2)
0.01
(0.0
2)
0.01
(0.0
1)
0.01
(3.7
7)
E10−
3(0
.02)
0.01
(0.0
1)
Med
ian
252
(783
)
20.8
3
(25.
64)
−2.5
8
(−6.
71)
−2.0
1
(−6.
71)
0.61
(4.4
8)
−2.0
9
E10−
3
(−8.
72
E10−
2)
0.06
(3.0
5E1
0−5
)0.
03
(0.0
9)
3.29
E10−
3
(−7.
67
E10−
3)
0.04
(3.5
0)
−1.1
8
E10−
4
(0.0
2)3.
23
E10−
3
(0.0
2)3.
99
E10−
3
(3.8
0)1.
87
E10−
3
(0.0
2)2.
75
E10−
3
(0.0
2)95
thp
erce
nti
le12
54
(133
2)
25.4
1
(27.
58)
4.55
(1.1
5)
0.40
(2.5
2)
5.81
(6.2
8)
0.11
(0.0
8)
5.22
(5.5
7)
2.65
(0.4
1)
0.22
(0.0
9)
7.39
(9.2
9)
0.09
(0.1
3)
0.06
(0.0
8)
0.07
(6.1
9)
0.05
(0.0
6)
0.06
(0.0
5)
5th
per
cen
tile
19
(71)
13.3
6
(21.
03)
−12.
39(−
12.7
3)−1
2.55
(−17
.02)
−1.1
6
(1.8
2)
−0.3
1
(−0.
29)
−4.8
6
(−2.
38)
−0.1
7
(−0.
08)
−0.1
6
(−0.
11)
−0.0
4
(1.1
8)
−0.0
7 (−
0.11
)
−0.0
3
(−0.
05)
−0.0
4
(1.6
7)
−0.0
4
(−0.
02)
−0.0
4
(−0.
01)
SE
69
(57)
0.62
(0.2
9)
0.92
(0.5
5)
0.62
(0.7
6)
0.14
(0.5
4)
7.52
E10−
3
(0.0
2)0.
21
(0.5
4)
0.09
(0.0
9)
7.15
E10−
3
(0.0
1)0.
16
(0.4
0)
3.23
E10−
3
(0.0
1)1.
95
E10−
3
(6.1
2
E10−
3)
2.50
E10−
3
(0.3
7)1.
91
E10−
3
(0.0
1)2.
53
E10−
3
(0.0
1)N
289
(225
)
289
(225
)
289
(225
)
289
(225
)
261
(38)
244
(37)
246
(42)
255
(46)
244
(37)
253
(46)
247
(48)
244
(37)
243
(21)
215
(16)
200
(35)
Fig. 3. Diurnal cycles of half-hourly average VOC fluxes measured by PTR–TOF–MSat the filed site during the consecutive periods 16–21 and 22–28 of July (2012). Onlyisoprene fluxes have been plotted in (left- and right-) panels showing different Y-scales. Error bars indicate day-to-day variability (standard deviation).

Forest Meteorology 187 (2014) 22– 35 29
∼ltAlos(
l1nsAfafle(oc
gcreta
4
att
4
4
piaaicpitdtamptGpn(i
dtt
t
ph
otos
ynth
esis
(A),
resp
irat
ion
(Rd),
stom
atal
con
du
ctan
ce
(gs)
, in
terc
ellu
lar
CO
2co
nce
ntr
atio
n
(Ci)
, iso
pre
ne
and
mon
oter
pen
es
emis
sion
in
adu
lt
and
juve
nil
e
leav
es
of
pla
nts
belo
ngi
ng
to
5
dif
fere
nt
gen
otyp
esal
aver
age.
Val
ues
rep
rese
nt
mea
ns
of
fou
r
pla
nts
belo
ngi
ng
to
the
sam
e
pop
lar
gen
otyp
e
±1
stan
dar
d
dev
iati
on
of
the
mea
n;
dif
fere
nt
up
per
case
lett
ers
ind
icat
e
sign
ifica
nt
dif
fere
nce
s
at
p
<
0.05
amon
g
dif
fere
nt
ypes
.
Gri
mm
inge
Kos
ter
Ou
den
berg
Skad
o
Wol
ters
on
Ave
rage
Ad
ult
Juve
nil
e
Ad
ult
Juve
nil
e
Ad
ult
Juve
nil
e A
du
lt
Juve
nil
e
Ad
ult
Juve
nil
e
Ad
ult
Juve
nil
e
s−1)
−15.
42
±
−0.5
9a−2
.94
±
−1.2
9a−1
6.78
±
−0.4
0a−2
.82
±
−1.1
3a−1
6.47
±
−1.1
7a−0
.86
±
−0.6
4a−1
4.17
±
−1.4
1a−4
.57
±
−0.9
2a−1
5.97
±
−0.5
3a−4
.91
±
−1.1
4a−1
5.76
±
−0.4
2a−3
.22
±
−0.5
3a
2s−1
)
3.37
±
0.62
a7.
51
±
0.69
ab2.
60
±
0.33
a9.
25
±
0.90
b3.
00
±
0.23
b8.
64
±
0.56
ab3.
85
±
0.34
a7.
82
±
0.99
ab2.
53
±
0.40
a5.
69
±
0.46
a3.
07
±
0.20
a7.
78
±
0.41
a
−1)
0.41
1
±
0.04
9ab0.
127
±
0.01
3a0.
431
±
0.01
3a0.
233
0.02
3a0.
426
±
0.05
8ab0.
092
±
0.00
9a0.
197
±
0.02
5a0.
147
±
0.01
7a0.
537
±
0.00
8b0.
147
±
0.02
4a0.
400
±
0.02
9a0.
149
±
0.01
3a
273
±
7b33
5
±
13ab
268
±
6b33
9
±
14ab
283
±
6b34
9
±
15b
225
±
9a32
0
±
6ab25
5
±
1ab28
8
±
7a26
1
±
6a32
7
±
7a
s−1)
13.0
8
±
1.42
a0.
06
±
0.06
a10
.50
±
0.78
a0.
11
±
0.06
a11
.02
± 1.
23a
0.32
±
0.10
a13
.15
±
4.78
a1.
25
±
0.27
b7.
07
±
2.14
a0.
27
±
0.27
a10
.96
±
1.12
a0.
40
±
0.12
a
es mol
m−2
s−1)n
.d.
0.02
1±
0.02
abn
.d.
0.01
2±
0.01
a0.
053
±
0.04
a0.
334
±
0.10
bn
.d.
0.03
5±
0.02
abn
.d.
0.23
6±
0.05
abn
.d.
0.10
±
0.03
a
. imen
e.im
ene.
ne
+
(E)-
�-o
cim
ene.
. ne
+
(E)-
�-o
cim
ene.
F. Brilli et al. / Agricultural and
3.07 ± 0.20 �mol m−2 s−1) (Table 2). Both adult and juvenileeaves exhibited very similar rates of photosynthesis and respira-ion rates across the five investigated poplar genotypes (Table 2).bove-average dark respiration was found only in juvenile
eaves of Koster (9.25 ± 0.90 �mol m−2 s−1) and in adult leavesf Oudenberg (3.00 ± 0.23 �mol m−2 s−1) (Table 2). The highesttomatal conductance was found in adult leaves of Wolterson0.537 mol m−2 s−1).
Isoprene emission did not statistically differ among the adulteaves of the five investigated poplar genotypes, all ranging around6 nmol m−2 s−1 (Table 2). Isoprene emission was very low in juve-ile leaves of all genotypes, with the exception of Skado thathowed a slightly higher emission of ∼1.25 nmol m−2 s−1 (Table 2).
good exponential relationship (R2 = 0.68, Fig. 5a, Table 3) wasound between GPP and isoprene emission in both juvenile anddult leaves. These leaf measurements, carried out by using a VOC-ree air and at a constant temperature of 25 ± 1 ◦C, showed a muchower iox synthesis, and a lower linear correlation with isoprenemission (f = ax +b) with respect to that found at canopy levela = 0.073 and 0.32, respectively, Fig. 7a; Table 3), suggesting thatnly ∼7.3% of isoprene was oxidized in the leaves inserted in theuvettes.
Monoterpenes were emitted by young leaves of all investigatedenotypes (Table 2), but Wolterson and Oudenberg had statisti-ally higher emissions (0.13 ± 0.08 and 0.33 ± 0.10 nmol m−2 s−1,espectively) than the other genotypes (Table 1). Adult leavesmitted no monoterpenes, except for those of the Oudenberg geno-ype, which emitted trace amounts (0.05 ± 0.04 nmol m−2 s−1). Inll cases, only �-, �-pinene and (E)-�-ocimene were detected.
. Discussion
The present study provides original information on ecosystem-nd leaf-level exchange of VOC between a poplar-based SRC plan-ation and the atmosphere in relation with photosynthesis duringhe peak of the growing season under changing weather conditions.
.1. Fluxes at ecosystem-level
.1.1. IsopreneWe confirm that the most abundant VOC emitted from the
oplar plantation was isoprene, consistent with pioneer field stud-es (Fuentes et al., 1999). Isoprene emission fluxes always displayed
clear diurnal cycle, with two peaks (at and just after noontime),lbeit only during the warm days (Fig. 3). This diel pattern was sim-lar to that observed in an aspen forest (Fuentes et al., 1999), butontrasts with the diel pattern observed in an isoprene-emitting oilalm plantation (Misztal et al., 2011). In our study, the two peaks
n the isoprene emission coincided with maximum PAR and withhe highest temperature, which occurred at different times of theay (at ∼12:00 and at ∼15:00, respectively). It is unlikely that day-ime isoprene emission has been limited by the amount of carbonssimilated through photosynthesis during the period of measure-ents. Indeed GPP was very similar during the cold and the warm
eriod, whereas isoprene emissions differed substantially betweenhese two periods (Fig. 1h and Fig. 3). Moreover, the absence ofLVs fluxes and the good levels of SWC recorded during the wholeeriod of measurements confirmed that the poplar plantation wasot affected by the onset of either biotic (i.e herbivores) or abiotici.e. drought) stress conditions that could have altered the rates ofsoprene emission (Brilli et al., 2007, 2009).
The occurrence of a dramatic shift in the meteorological con-itions (from cloudy sky and low temperatures in the first half ofhe measurement period to high incoming PAR coupled with risingemperatures in the second half) enabled us to explore the response Ta
ble
2Le
af-l
evel
ne
and
thei
r
tot
pop
lar
gen
ot
A
(�m
ol
m−2
Rd
(�m
ol
m−
g s(m
ol
m−2
s
Ci (
pp
m)
Isop
ren
eem
issi
on(n
mol
m−2
Mon
oter
pen
emis
sion
(n1
�-p
inen
e2
(E)-
�-O
c3
(E)-
�-O
c4
�,�
-pin
e5
�-P
inen
e6
�,�
-Pin
e

30 F. Brilli et al. / Agricultural and Forest Meteorology 187 (2014) 22– 35
F ry pros ly (20
oPedtlaawHoOtsJdeosii(wta
mtsioets2flh
ig. 4. Isoprene flux as a function of temperature (a), and light (b), and gross primacale. Closed and open symbols are fluxes measured from 16–21 and from 22–28, Ju
f the isoprene flux to a wide fluctuation of both temperature andAR. Our results are consistent with both field studies (Fuentest al., 1999) and laboratory investigations (Monson et al., 1992)emonstrating that when isoprene emission is not limited by pho-osynthesis, it is strictly controlled in the short-term at metabolicevel by temperature regimes and PAR. In particular, while temper-ture affects the optimum for isoprene synthase (IspS) enzymaticctivity, PAR provides the amount of reducing power (NADPH) asell as ATP required for isoprene biosynthesis (Sharkey et al., 2008).owever, the magnitude of the isoprene flux at plantation level inur study was lower than that measured by Fuentes et al. (1999).ne reason could be that the whole plantation was in a juvenile sta-
us when our measurements were carried out, as new poplar shootstarted to regrow only at the beginning of May after coppicing inanuary of the same year (2012). The very high respiration rates weetected in juveniles poplar leaves together with high methanolmission we found at ecosystem-level and the increasing valuesf LAI measured during our investigation (Sarzi-Falchi et al., per-onal communication) directly support this hypothesis. As a result,n our study the rate of isoprene emission might have been lim-ted by the seasonal development of IspS expression and activitybesides IspS precursors and amount) (Mayrhofer et al., 2005). Thisas possibly further mediated by growth under conditions of low
emperature which could have delayed the plantation capacity tochieve maximum isoprene emission rates (Wiberley et al., 2005).
Interestingly, despite a lower emission rate, isoprene fluxeseasured in our study showed a higher temperature dependence
hat that reported by Fuentes et al. (1999). In fact the temperatureensitivity of isoprene emitted from the poplar plantation resultedn a Q10 value of ∼10 (Q10 = e10 × 0.23, Fig. 4a; Table 3), whereas a Q10f ∼2.7 was assessed in a boreal aspen forest (Q10 = e10*0.1) (Fuentest al., 1999). However, recent experiments have demonstratedhat temperature dependency of isoprene emission is temporarilyuppressed during recovery after drought events (Fortunati et al.,
008). Therefore the higher temperature sensitivity of isopreneound in our study with respect to that of Fuentes et al. (1999) wasikely due to the short-time resolution of our investigation whichave limited the collection of isoprene fluxes only to a period whereduction (GPP) as a function of temperature (c), and light (d), on a half-hourly time12), respectively. In (b) and (d) only data from 6:00 to 20:00 have been considered.
stressful conditions did not occur. Differently, Fuentes et al. (1999)extrapolated the effect of temperature from seasonal variations ofisoprene emission, where fluxes of isoprene measured also dur-ing the recovery periods following stress events may have beenconsidered (1999). In addition, the large number of young leavespresent in the canopy that we have sampled may have furtherchanged the temperature sensitivity of isoprene with respect to thefully-developed canopy measured by Fuentes et al. (1999). Whetherisoprene emission has a higher sensitivity to temperature in juve-nile than in adult leaves still needs to be elucidated. Moreover, apotential interference due to a different correlation between themeasured air temperature and the actual leaf temperature couldhave affected the estimation of Q10.
4.1.2. MethanolMethanol was the second most abundant VOC emitted from
the poplar plantation. Consistent with recent studies (Hörtnaglet al., 2011; Laffineur et al., 2011) our results showed a diurnalevolution of methanol efflux from the ecosystem, with emissionsoccurring between 6:00 and 20:00. As with the isoprene emis-sions, we observed a double peak in the diel pattern that matchedthe diel increase of both PAR and temperature (Folkers et al.,2008), and was therefore more clearly visible during the warmdays. Moreover, similarly to previous investigations across differ-ent ecosystems (Hörtnagl et al., 2011; Laffineur et al., 2011), thevariation of environmental parameters recorded in our study couldonly partially explain the variation in the methanol flux (rela-tion with temperature: R2 = 0.25, with VPD: R2 = 0.29, and withPAR: R2 = 0.40, Fig. 6; Table 3). Temperature determines the rateof methanol production by influencing cell division and expansionthrough the availability of biosynthetic intermediates and pectinmethylesterases (PMEs) enzyme activity (Nemecek-Marshall et al.,1995), and affecting methanol partitioning among the aqueous andgaseous pools in the leaves (Niinemets and Reichstein, 2003). How-
ever, these physiological and physicochemical processes influencesimultaneously methanol production and emission in a complexregulatory mechanism. Therefore, quantification of PMEs activityin relationship with methanol fluxes (Frenkel et al., 1998; Oikawa
F. Brilli et al. / Agricultural and Forest Meteorology 187 (2014) 22– 35 31
Fig. 5. Leaf-level (a) gross photosynthesis as a function of isoprene emission injuvenile- (open triangle) and adult- (closed triangles) growth stage; (b) ecosystem-l2
eicisao2ttA
Fig. 6. Methanol flux (a) as a function of VPD, (b) as a function of light and (c)
evel gross primary production (GPP) as a function of isoprene measured from 16 to1 (open circles) and (c) measured from 22 to 28 (closed circles), July (2012).
t al., 2011) would be an important parameter to be consideredn the future research to precisely dissect the abiotic and bioticontrol on methanol emission. In particular, during periods ofntensive leaf expansion, endogenous biotic drivers (i.e. cell divi-ion and cell wall hardening) may easily offset the pure physicalnalogy recently developed to model methanol fluxes on the basisf adsorption/desorption/degradation processes (Laffineur et al.,
011). Besides temperature, VPD and PAR modulate stomatal aper-ure and thus actively regulate the diffusion of methanol fromhe site of production to the atmosphere (Niinemets et al., 2004).lthough we refrain from any further modelling of methanol fluxas a function of temperature on a half-hourly time scale. Open symbols are fluxesmeasured from 16 to 21 and closed symbols are fluxes measured from 22–28, July(2012).
due to the limited time resolution of our set of measurements, wesuppose that in the long-term, deciduous forest such as poplar plan-tations may possibly act more as a sink than a source of methanol(Laffineur et al., 2011), based on the fact that periods of intensemethanol production are limited to transient stages of leaf growththroughout the year, which may be even shortened by the frequentoccurrence of adverse environmental condition of low temperature(characterizing Northern climates) or low soil moisture availability(in more Southern climates).
4.1.3. Other oxygenated-VOCBesides isoprene and methanol emissions, we found depo-
sition fluxes of formaldehyde to the vegetation (Fig. 3), mostlikely as a result of an increasing stomatal sink (Fig. 3) combined
with a strengthening source (Fig. S3) developing throughout theday. Although formaldehyde has shown to be released from thevegetation only under extreme stress conditions (Fall et al., 2001;Brilli et al., 2012), in the atmosphere formaldehyde can be formed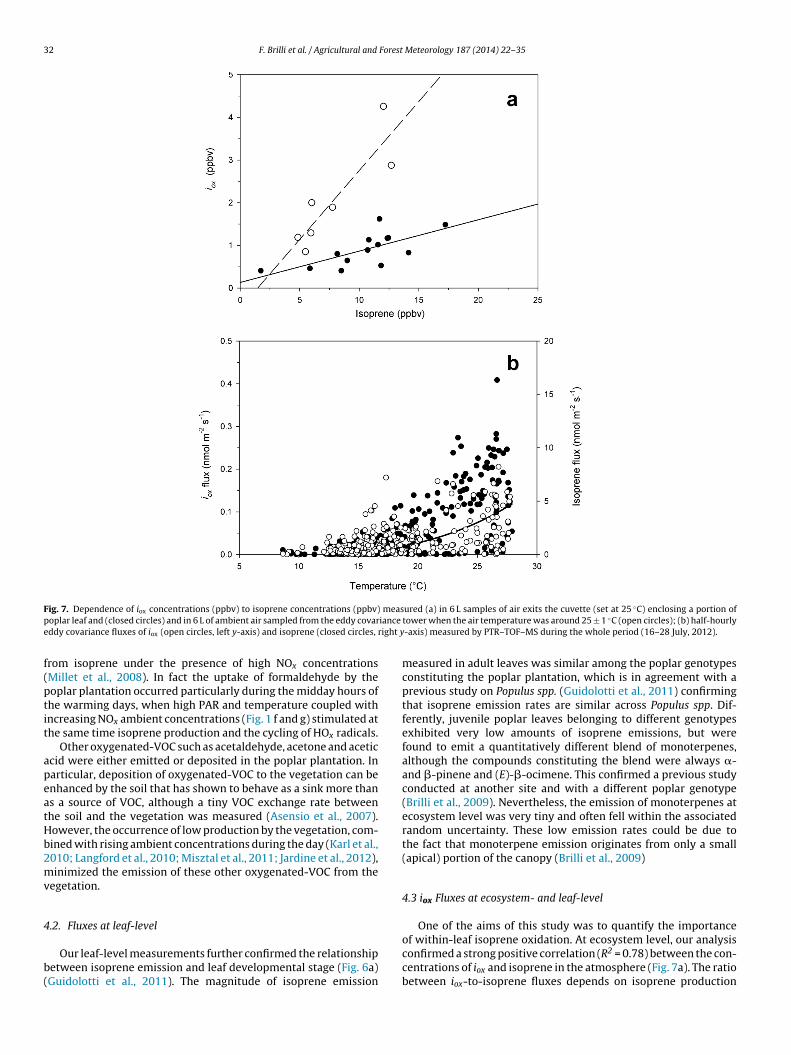
32 F. Brilli et al. / Agricultural and Forest Meteorology 187 (2014) 22– 35
F measp iance
e right y
f(ptit
apeatHb2mv
4
b(
ig. 7. Dependence of iox concentrations (ppbv) to isoprene concentrations (ppbv)oplar leaf and (closed circles) and in 6 L of ambient air sampled from the eddy covarddy covariance fluxes of iox (open circles, left y-axis) and isoprene (closed circles,
rom isoprene under the presence of high NOx concentrationsMillet et al., 2008). In fact the uptake of formaldehyde by theoplar plantation occurred particularly during the midday hours ofhe warming days, when high PAR and temperature coupled withncreasing NOx ambient concentrations (Fig. 1 f and g) stimulated athe same time isoprene production and the cycling of HOx radicals.
Other oxygenated-VOC such as acetaldehyde, acetone and aceticcid were either emitted or deposited in the poplar plantation. Inarticular, deposition of oxygenated-VOC to the vegetation can benhanced by the soil that has shown to behave as a sink more thans a source of VOC, although a tiny VOC exchange rate betweenhe soil and the vegetation was measured (Asensio et al., 2007).owever, the occurrence of low production by the vegetation, com-ined with rising ambient concentrations during the day (Karl et al.,010; Langford et al., 2010; Misztal et al., 2011; Jardine et al., 2012),inimized the emission of these other oxygenated-VOC from the
egetation.
.2. Fluxes at leaf-level
Our leaf-level measurements further confirmed the relationshipetween isoprene emission and leaf developmental stage (Fig. 6a)Guidolotti et al., 2011). The magnitude of isoprene emission
ured (a) in 6 L samples of air exits the cuvette (set at 25 ◦C) enclosing a portion oftower when the air temperature was around 25 ± 1 ◦C (open circles); (b) half-hourly-axis) measured by PTR–TOF–MS during the whole period (16–28 July, 2012).
measured in adult leaves was similar among the poplar genotypesconstituting the poplar plantation, which is in agreement with aprevious study on Populus spp. (Guidolotti et al., 2011) confirmingthat isoprene emission rates are similar across Populus spp. Dif-ferently, juvenile poplar leaves belonging to different genotypesexhibited very low amounts of isoprene emissions, but werefound to emit a quantitatively different blend of monoterpenes,although the compounds constituting the blend were always �-and �-pinene and (E)-�-ocimene. This confirmed a previous studyconducted at another site and with a different poplar genotype(Brilli et al., 2009). Nevertheless, the emission of monoterpenes atecosystem level was very tiny and often fell within the associatedrandom uncertainty. These low emission rates could be due tothe fact that monoterpene emission originates from only a small(apical) portion of the canopy (Brilli et al., 2009)
4.3 iox Fluxes at ecosystem- and leaf-level
One of the aims of this study was to quantify the importance
of within-leaf isoprene oxidation. At ecosystem level, our analysisconfirmed a strong positive correlation (R2 = 0.78) between the con-centrations of iox and isoprene in the atmosphere (Fig. 7a). The ratiobetween iox-to-isoprene fluxes depends on isoprene production
F. Brilli et al. / Agricultural and Forest Meteorology 187 (2014) 22– 35 33
Table 3Parameters are: R2 , correlation coefficient; a, b, c equation coefficients.
Regression line R2 a b c Standard error of estimate
Fig. 4a f = a exp(bx) 0.56* 0.01* 0.23** – R2 = 1.43a = 3.7 × 10⁻³
b = 0.01Fig. 4b f = b + a ln(abs(x)) 0.65* 1.72** −8.34** – R2 = 1.96
a = 0.12b = 0.73
Fig. 4c f = b + a ln(abs(x)) 0.39* 15.45** −31.46** – R2 = 4.56a = 2.29b = 0.80
Fig. 4d f = b + a ln(abs(x)) 0.58* 4.61** 0.21** – R2 = 3.78a = 0.21b = 1.27
Fig. 5a f = c + a exp(bx) 0.68* 17.27 0.04 −25.66 R2 = 3.72a = 58.77b = 0.07c = 58.78
Fig. 5b f = c + a exp(bx) 0.49* 0.10 0.10** −0.17 R2 = 0.24a = 0.07b = 0.03c = 0.11
Fig. 5c f = c + a exp(bx) 0.59* 1.95 0.07* −3.43* R2 = 1.77a = 1.32b = 0.02c = 1.79
Fig. 6a f = b + ax 0.29* 1.58 0.79 – –Fig. 6b f = b + a ln(abs(x)) 0.40* 1.2** −4.88** – R2 = 1.48
a = 0.09b = 0.55
Fig. 6c f = b + a ln(abs(x)) 0.25* 4.01** −9.94** – R2 = 1.65a = 0.32b = 0.91
Fig. 7a (cuvette) f = b + ax 0.49* 0.073* 0.13 – –Fig. 7a (ambient air) f = b + ax 0.78* 0.32* −0.47 – –Fig. 7b f =c + a xˆb 0.33* 1.5 × 10−5* 3.82** – a = 2.1 × 10⁻⁵*
O nifica
rpIdcDossepocawi(f
fiwa(eoitRtot
ne asterisk indicates significant with p < 0.05, and two asterisks indicate highly sig
ate and the concentration of �OH since iox are the major first-orderroducts deriving from isoprene oxidation (Pierotti et al., 1990).
ndeed isoprene oxidation in the atmosphere occurring during theay elevates the ambient concentration of iox. This can reach theompensation point, which in turn limits net iox emission by leaves.etection of iox fluxes may have been complicated by the parallelccurrence of source (through isoprene oxidation processes) – andink – (due to deposition) dynamics, also affecting the compen-ation point for iox (Karl et al., 2005; Tani et al., 2010). However,specially in the second, climatologically favourable measurementeriod, we measured net emission fluxes of iox also in the middlef the day, together with peak isoprene production, indicating thatompensation point was not reached (Fig. 3). In our study, an aver-ge iox-to-isoprene ratio of 0.32 was observed when iox and isopreneere sampled in ambient air under a temperature of 25 ± 1 ◦C, sim-
lar to the ratios reported by Kesselmeier et al. (2002), Kuhn et al.2007), Langford et al. (2010) and Misztal et al. (2011) across dif-erent ecosystems.
Also the leaf enclosure measurements using VOC-free air con-rmed the emission of iox in Populus sp. (Jardine et al., 2012),hich correlated directly with isoprene production (R2 = 0.49)
nd showed a mean iox-to-isoprene concentration ratio of 0.073Fig. 7a). This ratio (=0.073) is lower than the one measured in ambi-nt air (=0.32) under the same temperature. Therefore, about 20%f the iox that are found in the atmosphere could be formed bysoprene oxidation within poplar leaves. Moreover, it is likely thathe fraction of within-plant iox production is in relation to active
OS formation, in turn enhanced by O3 deposition entering leaveshrough stomata during the hot and sunny days in the last periodf measurements (Fig. 3). Iox could even proxy the amount of ozonehat is scavenged by plants, if isoprene acts as the main sink of ozoneb = 0.43
nt with p < 0.001.
within leaves (Loreto and Fares, 2007). The ability of poplars touse isoprene as a protective mechanism to tolerate oxidative stress(Vickers et al., 2009) may indicate their high tolerance to futurescenarios where ozone concentrations are expected to increase,especially in NOx-rich, industrialized areas (Lerdau, 2007).
5. Conclusion
In conclusion, this is one of the first studies reporting fluxes ofboth VOC and CO2 at leaf- and at ecosystem-level in a poplar-basedSRC plantation. Direct PTR–TOF–MS eddy covariance measure-ments confirmed abundant fluxes of isoprene from the plantation,but also revealed similarly high fluxes of methanol during a periodof intensive growth. Detection of iox emission both with eddycovariance at ecosystem-level and with enclosure measurementsat leaf-level confirmed that a fraction of the produced isoprene isoxidized before being emitted in the atmosphere, especially whenplants produce ROS or take up ozone during warm and sunnydays.
Acknowledgments
This study was financially supported by the European Com-mission’s Seventh Framework Programme (FP7/2007-2013) as aEuropean Research Council Advanced Grant (no. 233366, POPFULL)as well as by the Flemish Hercules Foundation as Infrastructurecontract ZW09-06. Joris Cools is greatly acknowledged for his help
with set-up installation and maintenance. We also thank Alessan-dro Zaldei for his contribution during the set-up installation andEugen Hartungen for PTR–TOF–MS assistance during the field cam-paign.
3 Forest
A
i2
R
A
A
A
A
B
B
B
B
C
C
C
C
E
F
FF
F
F
F
F
F
F
F
F
G
G
4 F. Brilli et al. / Agricultural and
ppendix A. Supplementary data
Supplementary data associated with this article can be found,n the online version, at http://dx.doi.org/10.1016/j.agrformet.013.11.006.
eferences
sensio, D., Penuelas, J., Filella, I., Llusià, J., 2007. On-line screening of soil VOCsexchange responses to moisture, temperature and root presence. Plant Soil 291,249–261.
shworth, K., Wild, O., Hewitt, C.N., 2013. Impacts of biofuel cultivation on mortalityand crop yields. Nat. Clim. Change, http://dx.doi.org/10.1038/NCLIMATE1788.
tkinson, R., Arey, J., 2003. Atmospheric degradation of volatile organic compounds.Chem. Rev. 103, 4605–4638.
ubinet, M., Grelle, A., Ibrom, A., Rannik, Ü., Moncrieff, J., Foken, T., Kowalski,A.S., Martin, P.H., Berbigier, P., Bernhofer, C., Clement, R., Elbers, J., Granier, A.,Grunwald, T., Morgenstern, K., Pilegaard, K., Rebmann, C., Snijders, W., Valentini,R., Vesala, T., 2000. Estimates of the annual net carbon and water exchange offorests: the EUROFLUX methodology. Adv. Ecol. Res. 30, 113–175.
rilli, F., Hörtnagl, L., Bamberger, I., Schnitzhofer, R., Ruuskanen, T.M., Hansel, A.,Loreto, F., Wohlfahrt, G., 2012. Qualitative and quantitative characterization ofvolatile organic compound emissions from cut grass. Environ. Sci. Techol. 46,3859–3865.
rilli, F., Ciccioli, P., Frattoni, M., Prestininzi, M., Spanedda, A.F., Loreto, F.,2009. Constitutive and herbivore-induced monoterpenes emitted by Popu-lus × euroamericana leaves are key volatiles that orient Chrysomela populibeetles. Plant Cell Environ. 32, 542–552.
rilli, F., Barta, C., Fortunati, A., Lerdau, M., Loreto, F., Centritto, M., 2007. Response ofisoprene emission and carbon metabolism to drought in white poplar (Populusalba) saplings. New Phytol. 175, 244–254.
roeckx, L.S., Verlinden, M.S., Vangronsveld, J., Ceulemans, R., 2012. Importance ofcrown architecture for leaf area index of different Populus genotypes in a high-density plantation. Tree Physiol. 32, 1214–1226.
ai, T.B., Price, D.T., Orchansky, A.L., Thomas, B.R., 2011. Carbon, water, and energyexchanges of a hybrid poplar plantation during the first five years followingplanting. Ecosystems 14, 658–671.
hameides, W.L., Lindsay, R.W., Richardson, J., Kiang, C.S., 1988. The role of biogenichydrocarbons in urban photochemical smog: Atlanta as a case study. Science241, 1473–1475.
laeys, M., Graham, B., Vas, G., Wang, W., Vermeylen, R., Pashynska, Cafmeyer, J.,Guyon, P., Andreae, M.O., Artaxo, P., Maenhaut, W., 2013. Formation of secondaryorganic aerosols through photooxidation of isoprene. Science 303, 1173–1176.
alfapietra, C., Gielen, B., Karnosky, D., Ceulemans, R., Scarascia-Mugnozza, S., 2010.Response and potential of agroforestry crops under global change. Environ. Pol-lut. 158, 1095–1104.
U, 2009. In: Union OjotE (Ed.), Directives 2001/77/EC and 2003/30/EC. O. J. o. t. E.Union. EU, Brussels, Directive 2009/28/EC of the European Parliament and of theCouncil of 23 April 2009 on the promotion of the use of energy from renewablesources and amending and subsequently repealing.
all, R., Karl, T., Jordan, A., Lindinger, W., 2001. Biogenic C5VOCs: release from leavesafter freeze-thaw wounding and occurrence in air at a high mountain observa-tory. Atm. Environ. 35, 3905–3916.
armer, E.E., 2001. Surface-to-air signals. Nature 411, 854–856.ares, S., Park, J.H., Gentner, D.R., Weber, R., Ormeno, E., Karlik, J., Goldstein, A.H.,
2012. Seasonal cycles of biogenic volatile organic compound fluxes and concen-trations in a California citrus orchard. Atmos. Chem. Phys. 12, 9865–9880.
argione, J., Hill, J., Tilman, D., Polasky, S., Hawthorne, P., 2008. Land clearing and thebiofuel carbon debt. Science 319, 1235–1238.
inkelstein, P.L., Sims, P.F., 2001. Sampling error in eddy correlation flux measure-ments. J. Geophys. Res. 27, 3503–3509.
isher, G., Prieler, S., van Velthuizen, H., Berndes, G., Faaij, A., Londo, M., de Wit, M.,2010. Biofuel production potentials in Europe: sustainableuse of cultivated landand pastures. Part II: Land use scenarios. Biomass and Bioenergy 34, 173–187.
olkers, A., Huve, K., Ammann, C., Dindorf, T., Kesselmeier, J., Kleist, E., Kuhn, U.,Uerlings, R., Wildt, J., 2008. Methanol emissions from deciduous tree species:dependence on temperature and light intensity. Plant Biol. 10, 65–75.
ortunati, A., Barta, C., Brilli, F., Centritto, M., Zimmer, I., Schnitzler, J.P., Loreto, F.,2008. Isoprene emission is not temperature-dependent during and after severedrought-stress: a physiological and biochemical analysis. Plant J. 55, 687–697.
ratini, G., Ibrom, A., Arriga, N., Burba, G., Papale, D., 2012. Relative humidity effectson water vapour fluxes measured with closed-path eddy-covariance systemswith short sampling lines. Agric. For. Meteorol. 147, 209–232.
renkel, C., Peters, J.S., Tieman, D.M., Tiznado, M.E., Handa, A.K., 1998. Pectinmethylesterase regulates methanol and ethanol accumulation in ripeningtomato (Lycopersicon esculentum) fruit. J. Biol. Chem. 273, 4293–4295.
uentes, J.D., Wang, D., Gu, L., 1999. Seasonal variations in isoprene emissions froma boreal aspen forest. J. Appl. Meteorol. 38, 855–869.
affe, J., Tuieman, D.M., Handa, A.K., 1994. Pectin methylesterase isoforms in
tomato (Lycopersicon esculentum) tissues. Effects of expression of a pectinmethylesterase antisense gene. Plant Physiol. 105, 199–203.öckede, M., Rebmann, C., Foken, T., 2004. A combination of quality assessment toolsfor eddy covariance measurements with footprint modelling for the character-isation of complex sites. Agric. For. Meteorol. 127, 175–188.
Meteorology 187 (2014) 22– 35
Graus, M., Müller, M., Hansel, A., 2010. High resolution PTR–TOF quantificationand formula confirmation of VOC in real time. J. Am. Soc. Mass Spectrom. 21,1037–1044.
Guenther, A., Zimmerman, P., Harley, P., Monson, R., Fall, R., 1993. Isoprene andmonoterpene emission rate variability: model evaluation and sensitivity analy-sis. J. Geophys. Res. 98, 12609–12617.
Guidolotti, G., Calfapietra, C., Loreto, F., 2011. The relationship between isopreneemission, CO2 assimilation and water use efficiency across a range of poplargenotypes. Physiol. Plant 142, 297–304.
Hakola, H., Rinne, J., Laurila, T., 1998. The hydrocarbon emission rates of tea-leafedwillow (Salix phylicipolia), silver birch (Betula pendula) and European aspen (Pop-ulus tremula). Atmos. Environ. 32, 1825–1833.
Horst, T.W., Lenschow, D.H., 2009. Attenuation of scalar fluxes measured withspatially-displaced sensors. BoundaryLayer Meteorol. 130, 275–300.
Hörtnagl, L., Bamberger, I., Graus, M., Ruuskanen, T.M., Schnitzhofer, R., Müller, M.,Hansel, A., Wohlfahrt, G., 2011. Biotic, abiotic, and management controls onmethanol exchange above a temperate mountain grassland. J. Geophys. Res.116, G03021.
Hüve, K., Christ, M.M., Kleist, E., Uerlings, R., Niinemets, U., Walter, A., Wildt, J.,2007. Simultaneous growth and emission measurements demonstrate an inter-active control of methanol release by leaf expansion and stomata. J. Exp. Bot. 58,1783–1793.
Ibrom, A., Dellwik, E., Flyvbjerg, H., Jensen, N.O., Pilegaard, K., 2007. Strong low-pass filtering effects on water vapour flux measurements with closed-path eddycorrelation systems. Agric. For. Meteorol. 147, 140–156.
International Poplar Commission (IPC), 24th Session and 46th Executive CommitteeMeeting, 2013. http://www.fao.org/forestry/ipc2012/en/
Jardine, K.J., Monson, R.K., Abrell, L., Saleska, S.R., Arneth, A., Jardine, A., Ishida, F.Y.,Serrano, A.M.Y., Artaxo, P., Karl, T., Fares, S., Goldstein, A., Loreto, F., Huxman,T., 2012. Within-plant isoprene oxidation confirmed by direct emission of oxi-dation products methyl vinyl ketone and methacrolein. Global Change Biol. 18,973–984.
Jordan, A., Haidacher, S., Hanel, G., Hartungen, E., Märk, L., Seehauser, H., Schot-tkowsky, R., Sulzer, P., Märk, T.D., 2009. A high resolution and high sensitivityproton-transfer-reaction time-of-flight mass spectrometer (PTR–TOF–MS). Int.J. Mass Spectrom. 286, 122–128.
Karl, T., Harley, P., Emmons, L., Thornton, B., Guenther, A., Basu, C., Turnipseed, A.,Jardine, K., 2010. Efficient atmospheric cleansing of oxidized organic trace gasesby vegetation. Science 330, 816–819.
Karl, T., Guenther, A., Turnipseed, A., Tyndall1, G., Artaxo, P., Martin, S., 2005. Rapidformation of isoprene photo-oxidation products observed in Amazonia. Atmos.Chem. Phys. 9, 7753–7767.
Kesselmeier, J., Kuhn, U., Rottenberger, S., Biesenthal, T., Wolf, A., Schebeske, G.,Andreae, M.O., Ciccioli, P., Brancaleoni, E., Frattoni, M., Oliva, S.T., Botelho, M.L.,Silva, C.M.A., Tavares, T.M., 2002. Concentrations and species composition ofatmospheric volatile organic compounds (VOCs) as observed during the wet anddry season in Rondonia (Amazonia). J. Geophys. Res. Atmos. 107 (D20), 8053.
Kesselmeier, J., Staudt, M., 1999. Biogenic volatile compounds (VOC): an overviewon emission, physiology and ecology. J. Atmos. Chem. 33, 23–88.
Kiendler-Scharr, A., Wildt, J., Dal Maso, M., Hohaus, T., Kleist, E., Mentel, T.F., Till-mann, R., Uerlings, R., Schurr, U., Wahner, A., 2009. New particle formation inforest inhibited by isoprene emission. Nature 461, 381–384.
Kuhn, U., Andreae, M.O., Ammann, C., Araüjo, A.C., Brancaleoni, E., Ciccioli, P., Din-dorf, T., Frattoni, M., Gatti, L.V., Ganzeveld, L., Kruijt, B., Lelieveld, J., Lloyd, J.,Meixner, F.X., Nobre, A.D., Poschl, U., Spirig, C., Stefani, P., Thielmann, A., Valen-tini, R., Kesselmeier, J., 2007. Isoprene and monoterpene fluxes from CentralAmazonian rainforest inferred from towerbased and airborne measurements,and implications on the atmospheric chemistry and the local carbon budget.Atmos. Chem. Phys. 7, 2855–2879.
Kulmala, M., Hameri, K., Aalto, P.O., Makela, J.M., Pirjola, L., Nilsson, E.D., Buzorius,G., Rannik, U., Dal Maso, M., Seidl Hoffman, T., Janson, R., Hansson, H.C., Viisanen,Y., Laaksonen, A., O’Dowd, C.D., 2001. Overview of the international project onbiogenic aerosol formation in the boreal forest (BIOFOR). Tellus 53, 324–343.
Laffineur, Q., Aubinet, M., Schoon, N., Amelynck, C., Müller, J.-F., Dewulf, J., Van Lan-genhove, H., Steppe, K., Heinesch, B., 2011. Abiotic and biotic control of methanolexchanges in a temperate mixed forest. Atmos. Chem. Phys. 12, 577–590.
Langford, B., Misztal, P.K., Nemitz, E., Davison, B., Helfter, C., Pugh, T.A.M., MacKenzie,A.R., Lim, S.F., Hewitt, S.F.C.N., 2010. Fluxes and concentrations of volatile organiccompounds from a south-east Asian tropical rainforest. Atmos. Chem. Phys. 10,8391–8412.
Laothawornkitkul, J., Paul, N.D., Vickers, C.E., Possel, M., Taylor, J.E., Mullineaux, P.M.,Hewitt, C.N., 2008. Isoprene emissions influence herbivore feeding decisions.Plant Cell Environ. 31, 1410–1415.
Lerdau, M., 2007. A positive feedback with negative consequences. Science 316,212–213.
Loivamaäki, M., Mumm, R., Dicke, M., Schnitzler, J.-P., 2008. Isoprene interferes withthe attraction of bodyguards by herbaceous plants. PNAS 105, 17430–17435.
Loreto, F.J.P., Schnitzler, 2010. Abiotic stresses and induced BVOCs. Trends Plant Sci.15, 154–166.
Loreto, F., Fares, S., 2007. Is ozone flux inside leaves only a damage indicator? Cluesfrom volatile isoprenoid studies. Plant Physiol. 143, 1096–1100.
Loreto, F., Velikova, V., 2001. Isoprene produced by leaves protects the photosyn-thetic apparatus against ozone damage, quenches ozone products, and reduceslipid peroxidation of cellular membranes. Plant Physiol. 127, 1781–1787.
Loreto, F., Sharkey, T., 1990. A gas-exchange study of photosynthesisand isopreneemission in Quercus rubra L. Planta 182, 523–531.

Forest
L
M
M
M
M
M
M
M
M
M
M
N
N
N
O
Ö
P
P
plantation after conversion from agricultural land. Agric. For. Metereol. 169,
F. Brilli et al. / Agricultural and
loyd, J., Taylor, J.A., 1994. On the temperature dependence of soil respiration. Funct.Ecol. 8, 315–323.
ayrhofer, S., Teuber, M., Zimmer, I., Louis, S., Fischbach, R.J., Schnitzler, P.J., 2005.Diurnal and seasonal variation of isoprene biosynthesis-related genes in greypoplar leaves. Plant Physiol. 139, 474–484.
igliavacca, M., Meroni, M., Manca, G., Matteucci, G., Montagnani, L., Grassi, G.,Zenone, T., Teobaldelli, M., Goded, I., Colombo, R., Seufert, G., 2009. Seasonal andinterannual patterns of carbon and water fluxes of a poplar plantation underpeculiar eco-climatic conditions. Agric. For. Meteorol. 147, 209–232.
illet, D.B., Jacob, D.J., Boersma, K.F., Fu, T.M., Kurosu, T.P., Chance, K.,Heald, C.L., Guenther, A., 2008. Spatial distribution of isoprene emissionsfrom North America derived from formaldehyde column measurementsby the OMI satellite sensor. J. Geophys. Res. Atmos. 113, D02307,http://dx.doi.org/10.1029/2007jd008950.
isztal, P.K., Nemitz, E., Langford, B., Di Marco, C.F., Phillips, G.J., Hewitt, C.N.,MacKenzie, A.R., Owen, S.N., Fowler, D., Heal, M.R., Cape, J.N., 2011. Direct ecosys-tem fluxes of volatile organic compounds from oil palms in south-east Asia.Atmos. Chem. Phys. 11, 8995–9017.
offat, A.M., Papale, D., Reichstein, M., Hollinger, D.Y., Richardson, A.D., Barr,A.G., Beckstein, C., Braswell, B.H., Churkina, G., Desai, A.R., Falge, E., Gove, J.H.,Heimann, M., Hui, D., Jarvis, A.J., Kattge, J., Noormets, A., Stauch, V.J., 2007. Com-prehensive comparison of gap-filling techniques for eddy covariance net carbonfluxes. Agric. For. Meteorol. 147, 209–232.
oncrieff, J., Clement, R., Finnigan, J., Meyers, T., 2004. In: Lee, X., Massman, W., Law,B. (Eds.), Handbook of Micrometeorology: A Guide for Surface Flux Measurementand Analysis. Kluwer Academic Publisher, Dordrecht, pp. 7–32.
oncrieff, J.B., Massheder, J.M., deBruin, H., Elbers, J., Friborg, T., Heusinkveld, B.,Kabat, P., Scott, S., Soegaard, H., Verhoef, A., 1997. A system to measure surfacefluxes of momentum, sensible heat, water vapour and carbon dioxide. J. Hydrol.189, 589–611.
onson, R.K., Jaeger, C.H., Adams III, W.W., Driggers, E.M., Silver, G.M., Fall, R., 1992.Relationships among isoprene emission rate, photosynthesis, and isoprene syn-thase activity as influenced by temperature. Plant Physiol. 98, 1175–1180.
üller, M., Graus, M., Ruuskanen, T.M., Schnitzhofer, R., Bamberger, I., Kaser, L.,Titzmann, T., Hörtnagl, L., Wohlfahrt, G., Karl, T., Hansel, A., 2010. First eddycovariance flux measurements by PTR–TOF. Atmos. Meas. Tech. 3, 387–395.
üller, M., Mikoviny, T., Jud, W., D’Anna, B., Wisthaler, A., 2013. A new software toolfor the analysis of high resolution PTR–TOF mass spectra. Chemom. Intell. Lab.Syst. 127, 158–165.
emecek-Marshall, M., Macdonald, R.C., Franzen, F.J., Wojciechowski, C.L., Fall,R., 1995. Methanol emission from leaves–enzymatic detection of gas-phasemethanol and relation of methanol fluxes to stomatal conductance and leafdevelopment. Plant Physiol. 108, 1359–1368.
iinemets, Ü., Loreto, F., Reichstein, M., 2004. Physiological and physicochemicalcontrols on foliar volatile organic compound emissions. Trends Plant Sci. 9,180–186.
iinemets, Ü., Reichstein, M., 2003. Controls on the emission of plant volatilesthrough stomata: differential sensitivity of emission rates to stomatal closureexplained. J. Geophys. Res. 108, 4208.
ikawa, P.Y., Giebel, B.M., Sternberg, D.L.D.O., Li, L., Timko, M.P., Swart, P.K., Riemer,D.D., Mak, J.E., Lerdau, M.T., 2011. Leaf and root pectin methylesterase activityand C-13/C-12 stable isotopic ratio measurements of methanol emissions giveinsight into methanol production in Lycopersicon esculentum. New Phytol. 191,1031–1040.
zdemir, E.D., Härdtlein, M., Eltrop, L., 2009. Land substitution effects of biofuel sideproducts and implications on the land area requirement for EU 2020 biofueltargets. Energy Policy 37, 2986–2996.
apale, D., Reichstein, M., Aubinet, M., Canfora, E., Bernhofer, C., Kutsch, W., Longdoz,B., Rambal, S., Valentini, R., Vesala, T., Yakir, D., 2006. Towards a standardized
processing of Net Ecosystem Exchange measured with eddy covariance tech-nique: algorithms and uncertainty estimation. Biogeosciences 3, 571–583.ierotti, D., Wofsy, S.C., Jacob, D., Rasmussen, R.A., 1990. Isoprene and its oxidation-products—methacrolein and methyl vinyl ketone. J. Geophys. Res. Atmos. 95,1871–1881.
Meteorology 187 (2014) 22– 35 35
Pinho, P.G., Pio, C.A., Jenkin, M.E., 2005. Evaluation of isoprene degradation inthe detailed tropospheric chemical mechanism, MCM v3, using environmentalchamber data. Atmos. Environ. 39, 130–1322.
Rannik, Ü., Vesala, T., 1999. Autoregressive filtering versus linear detrending in esti-mation of fluxes by the eddy covariance method. BoundaryLayer Meteorol. 91,259–280.
Reichstein, M., Falge, E., Baldocchi, D., Papale, D., Aubinet, M., Berbigier, P., Bern-hofer, C., Buchmann, N., Gilmanov, T., Granier, A., Grunwald, T., Havrankova, K.,Ilvesniemi, H., Janous, D., Knohl, A., Laurila, T., Lohila, A., Loustau, D., Matteucci,G., Meyers, T., Miglietta, F., Ourcival, J.-M., Pumpanen, J., Rambal, S., Rotenberg,E., Sanz, M., Tenhunen, J., Seufert, G., Vaccari, F., Vesala, T., Yakir, D., Valentini, R.,2005. On the separation of net ecosystem exchange into assimilation and ecosys-tem respiration: review and improved algorithm. Global Change Biol. Bioenergy11 (9), 1424–1439.
Ruuskanen, T.M., Müller, M., Schnitzhofer, R., Karl, T., Graus, M., Bamberger, I., Hört-nagl, L., Brilli, F., Wohlfahrt, G., Hansel, A., 2011. Eddy covariance VOC emissionand deposition fluxes above grassland using PTR–TOF. Atmos. Chem. Phys. 11,611–625.
Searchinger, T., Heimlich, R., Houghton, R.A., Dong, F., Elobeid, A., Fabiosa, J., Tok-goz, S., Hayes, D., Yu, T.H., 2008. Use of U.S. cropland for biofuels increasesgreenhouse gasses through emissions from land-use change. Science 319,1238–1240.
Sharkey., T.D., Wiberley, A.E., Donohue, A.R., 2008. Isoprene emission from plants:why and how. Ann. Bot. 101, 5–18.
Sharkey, T.D., Yeh, S., 2001. Isoprene emission from plants. Annu. Rev. Plant Biol. 52,407–436.
Staudt, M., Lhoutellier, L., 2011. Monoterpene and sesquiterpene emissions fromQuercus coccifera exhibit interacting responses to light and temperature. Bio-geosciences 8, 2757–2771.
Tani, A., Tobe, S., Shimizu, S., 2010. Uptake of methacrolein and methyl vinyl ketoneby tree saplings and implications for forest atmosphere. Environ. Sci. Technol.44, 7096–7101.
U.S., 2011. Renewable Fuel Standard RFS. Environmental Protection Agency, EPA,Washington, DC http://www.epa.gov/otaq/fuels/renewablefuels/index.htm
Velikova, V., La Mantia, T., Lauteri, M., Michelozzi, M., Nogues, I., Loreto, F., 2012.The impact of winter flooding with saline water on foliar carbon uptake and thevolatile fraction of leaves and fruits of lemon (Citrus × limon) trees. Funct. PlantBiol. 39, 199–213.
Velikova, V., Pinelli, P., Pasqualini, S., Reale, L., Ferranti, F., Loreto, F., 2005. Isoprenedecreases the concentration of nitric oxide in leaves exposed to elevated ozone.New Phytol. 166, 419–426.
Vickers, C.E., Gershenzon, J., Lerdau, M.T., Loreto, F., 2009. A unified mechanismof action for volatile isoprenoids in plant abiotic stress. Nat. Chem. Ecol. 5,283–291.
Vitousek, P.M., 1991. Can planted forests counteract increasing atmospheric carbondioxide? J. Environ. Qual. 20, 348–354.
Weih, M., 2004. Intensive short rotation forestry in boreal climates: present andfuture perspectives. Can. J. For. Res. 34, 1369–1378.
Wiberley, A.E., Linskey, A.R., Falbel, T.G., Sharkey, T.D., 2005. Developmentof the capacity for isoprene emission in kudzu. Plant Cell Environ. 28,898–905.
Wilczak, J.M., Oncley, S.P., Stage, S.A., 2001. Sonic anemometer tilt correction algo-rithms. Boundary-Layer Meteorol. 99, 127–150.
Zona, D., Janssens, I., Gioli, B., Jungkunst, E.F., Serrano, M.C., Ceulemans, R., 2012.N2O fluxes of a bio-energy poplar plantation during a two years rotation period.Global Change Biol. Bioenergy, http://dx.doi.org/10.1111/gcbb.12019.
Zona, D., Janssens, I., Aubinet, M., Gioli, B., Vicca, S., Fichot, R., Ceulemans, R., 2013.Fluxes of the greenhouse gases (CO2, CH4 and N2O) above a short-rotation poplar
100–110.Zona, D., Gioli, B., Fares, S., De Groote, T., Pilegaard, K., Ibrom, A., Ceulemans, R.,
2014. Environmental controls on ozone fluxes in a poplar plantation in westernEurope. Environ. Poll. 184, 201–210.