Embed Size (px)
Citation preview

Grant Agreement
612133
Understanding the policy impacts
using Open Data: The Policy Compass approach
Dr. Yury Glikman
Fraunhofer FOKUS
30 June 2015 Samos Summit 2015
http://policycompass.eu

• Project start: 1 October 2013
• Duration: 36 months
• Project Coordinator: Fraunhofer FOKUS (Germany)
• Consortium: 7 organizations from 5 different countries
Policy Compass Consortium
30 June 2015 Samos Summit 2015 2

Policy Compass in 3 words
Learning from Data
30 June 2015 Samos Summit 2015 3

Traditional Open Data Platforms
• Metadata registry
• Data storage (optional)
• Basic visualisation of single data files (optional)
• Different data file formats:
• Machine processing friendly: csv, well structured excel files
• Human reader friendly: pdf
• Different data structures
• Metadata and data in local language only (the usual case)
30 June 2015 Samos Summit 2015 4

The Problem
• Difficulty of objectively assessing
the impact of government policies
• Political discussions about policies
impacts are highly emotional and
often are not based on any factual
data
• Poor use of available open data
resources in the internet
• Different perception by people
about a suitable metric for
measuring progress
The Opportunity
The Problem and the Opportunity
The Opportunity: learning from data
30 June 2015 Samos Summit 2015
ONLINE DELIBERATION
AND ARGUMENT MAPPING
BUILDING
CAUSAL MODELS
DEFINING OWN
PROGRESS METRICS
5

Policy Compass key facts
• Policy Compass is an Online Web platform
• Policy compass works with time series data
• Users can define own metrics by providing a formula for its
computation
• Policy Compass draws line charts for selected by the user data or
metrics
• User can annotate charts by the policy changing events information
• User can define causal models explaining behavior of the chart
curves and simulate future behaviour
• Users can discuss the causal models, charts, etc
• Discussion results can be formalized as an argumentation graph
• Policy Compass is not an A.I. tool
30 June 2015 Samos Summit 2015 6

Policy Compass key facts
• Policy Compass is a Online Web platform
• Policy compass works with time series data
• Users can define own metrics by providing a formula for its
computation
• Policy Compass draws line charts for selected by the user data or
metrics
• User can annotate charts by the policy changing events information
• User can define causal models explaining behavior of the chart
curves and simulate future behaviour
• Users can discuss the causal models, charts, etc
• Discussion results can be formalized as an argumentation graph
• Policy Compass is not an A.I. tool
30 June 2015 Samos Summit 2015 7

Policy Compass key facts
• Policy Compass is a Online Web platform
• Policy compass works with time series data
• Users can define own metrics by providing a formula for its
computation
• Policy Compass draws line charts for selected by the user data or
metrics
• User can annotate charts by the policy changing events information
• User can define causal models explaining behavior of the chart
curves and simulate future behaviour
• Users can discuss the causal models, charts, etc
• Discussion results can be formalized as an argumentation graph
• Policy Compass is not an A.I. tool
30 June 2015 Samos Summit 2015 8

Policy Compass key facts
• Policy Compass is a Online Web platform
• Policy compass works with time series data
• Users can define own metrics by providing a formula for its
computation
• Policy Compass draws line charts for selected by the user data or
metrics
• User can annotate charts by the policy changing events information
• User can define causal models explaining behavior of the chart
curves and simulate future behaviour
• Users can discuss the causal models, charts, etc
• Discussion results can be formalized as an argumentation graph
• Policy Compass is not an A.I. tool
30 June 2015 Samos Summit 2015 9

Policy Compass key facts
• Policy Compass is a Online Web platform
• Policy compass works with time series data
• Users can define own metrics by providing a formula for its
computation
• Policy Compass draws line charts for selected by the user data or
metrics
• User can annotate charts by the policy changing events information
• User can define causal models explaining behavior of the chart
curves and simulate future behaviour
• Users can discuss the causal models, charts, etc
• Discussion results can be formalized as an argumentation graph
• Policy Compass is not an A.I. tool
30 June 2015 Samos Summit 2015 10

Policy Compass key facts
• Policy Compass is a Online Web platform
• Policy compass works with time series data
• Users can define own metrics by providing a formula for its
computation
• Policy Compass draws line charts for selected by the user data or
metrics
• User can annotate charts by the policy changing events information
• User can define causal models explaining behavior of the chart
curves and simulate future behaviour
• Users can discuss the causal models, charts, etc
• Discussion results can be formalized as an argumentation graph
• Policy Compass is not an A.I. tool
30 June 2015 Samos Summit 2015 11

Policy Compass key facts
• Policy Compass is a Online Web platform
• Policy compass works with time series data
• Users can define own metrics by providing a formula for its
computation
• Policy Compass draws line charts for selected by the user data or
metrics
• User can annotate charts by the policy changing events information
• User can define causal models explaining behavior of the chart
curves and simulate future behaviour
• Users can discuss the causal models, charts, etc
• Discussion results can be formalized as an argumentation graph
• Policy Compass is not an A.I. tool
30 June 2015 Samos Summit 2015 12

Policy Compass key facts
• Policy Compass is a Online Web platform
• Policy compass works with time series data
• Users can define own metrics by providing a formula for its
computation
• Policy Compass draws line charts for selected by the user data or
metrics
• User can annotate charts by the policy changing events information
• User can define causal models explaining behavior of the chart
curves and simulate future behaviour
• Users can discuss the causal models, charts, etc
• Discussion results can be formalized as an argumentation graph
• Policy Compass is not an A.I. tool
30 June 2015 Samos Summit 2015 13

Policy Compass key facts
• Policy Compass is a Online Web platform
• Policy compass works with time series data
• Users can define own metrics by providing a formula for its
computation
• Policy Compass draws line charts for selected by the user data or
metrics
• User can annotate charts by the policy changing events information
• User can define causal models explaining behavior of the chart
curves and simulate future behaviour
• Users can discuss the causal models, charts, etc
• Discussion results can be formalized as an argumentation graph
• Policy Compass is not an A.I. tool
30 June 2015 Samos Summit 2015 14

Policy Compass key facts
• Policy Compass is a Online Web platform
• Policy compass works with time series data
• Users can define own metrics by providing a formula for its
computation
• Policy Compass draws line charts for selected by the user data or
metrics
• User can annotate charts by the policy changing events information
• User can define causal models explaining behavior of the chart
curves and simulate future behaviour
• Users can discuss the causal models, charts, etc
• Discussion results can be formalized as an argumentation graph
• Policy Compass is not an A.I. tool
30 June 2015 Samos Summit 2015 15
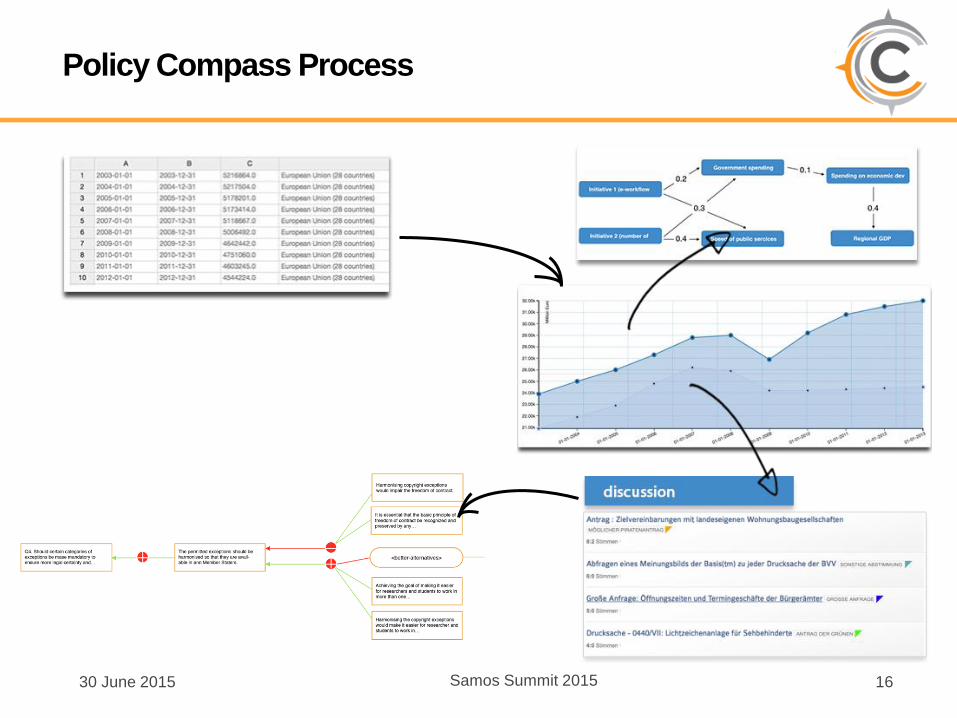
Policy Compass Process
30 June 2015 Samos Summit 2015 16

The Policy Compass Concept Components
MetricsDefine own data based metrics
VisualisationsVisualise and compare metrics
Historical eventsAnnotate metrics visualisations by
policy relevant events
ArgumentationTransforms statements and
opinions into structured argument
maps
DeliberationDiscuss metrics and policy models
Fuzzy Cognitive MapsModel policy impacts and
interrelations
30 June 2015 Samos Summit 2015 17

Find or upload time series data
• Policy Compass has already some data uploaded by other users
• If interesting for you data is missing, try to look at Open Data or
Statistical portals, like Eurostat, for example
• Provide for uploaded data infomation about ist name, origin and other
attributes
• Specify for which indicator(s) are these data. Think about indicators as
about a group to which these data belong.
30 June 2015 Samos Summit 2015 18

Find metrics of your interest or define your own
• There are already some
metrics defined by other
users.
• If you want to define you
own one you can do it
by providing a formula
for it.
• In your metric formula
you can use available in
the platform indicators
(you can add new if
necessary), other
metrics and standard
mathematic operations.
30 June 2015 Samos Summit 2015 19
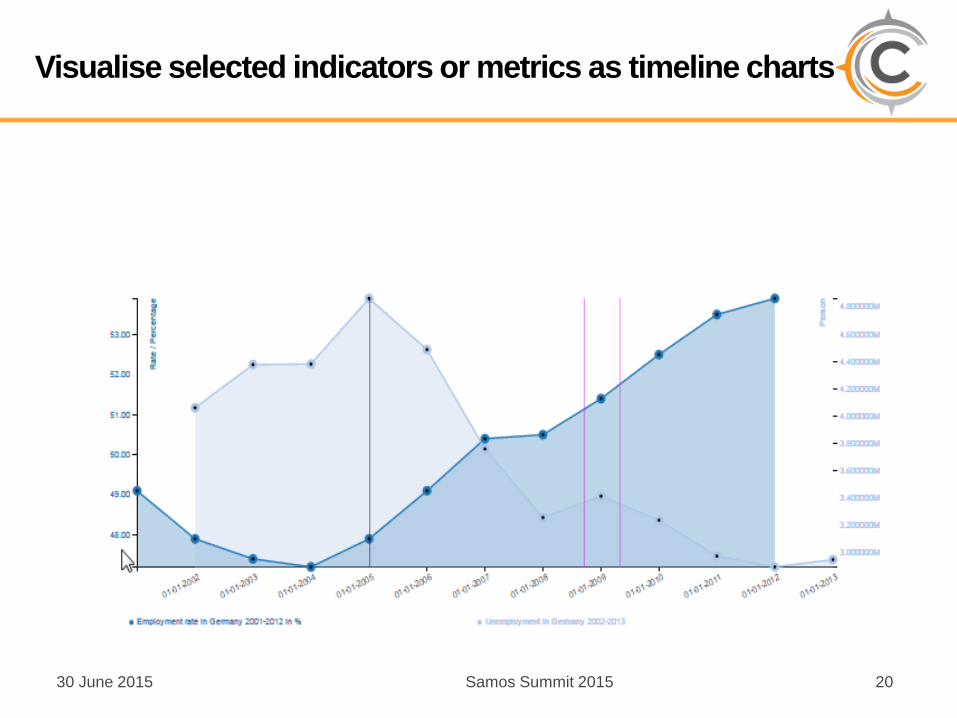
Visualise selected indicators or metrics as timeline charts
30 June 2015 Samos Summit 2015 20

Look for explanations of metrics or indicators change
30 June 2015 Samos Summit 2015
• Annotate the chart by historical events, which could be a reason for
the change
Historical
events
21
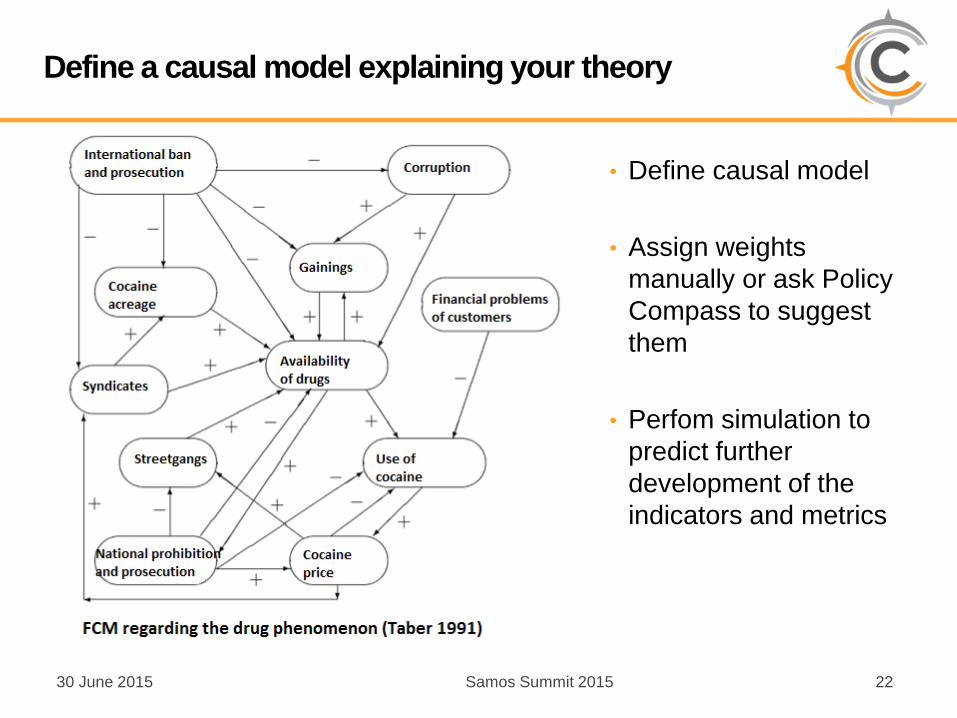
Define a causal model explaining your theory
30 June 2015 Samos Summit 2015
• Define causal model
• Assign weights
manually or ask Policy
Compass to suggest
them
• Perfom simulation to
predict further
development of the
indicators and metrics
22
Discuss your findings with the community
• Discuss your findings with the community
• Embed any of the listed above steps in your blog or web site
• Formalise the discussion outcomes as an argumentation graph
30 June 2015 Samos Summit 2015 23

Correlations can be interesting , but useless
30 June 2015 Samos Summit 2015 24

Correlations can be interesting , but useless
30 June 2015 Samos Summit 2015 25
www.PolicyCompass.eu
www.twitter.com/PolicyCompassEU
www.facebook.com/PolicyCompass
PolicyCompass
Thank you!
Grant Agreement
612133
Yury Glikman

Policy Compass Terminology
• Property: A binary predicate denoting an attribute of an individual.
‒ Example: prosperity, health, criminality
• Indicator: A property correlated with some other property.
‒ Example: average income, number of deaths, number of drug law offences
• Dataset: A table for some property of a set of individuals over a time
period, where each row is a time series and each column is a time
point, e.g. year, and the cells contain the value of the property for a
particular individual and time point.
‒ Example: Average income in UK in the years 2000-2014; number of deaths in Spain
in 2001; number of drug law offences for European countries in 2000-2013.
• Metric: A measure of some property, a mathematical function
(formula) from the set of individuals to data values, defined using
indicators.
‒ Example: Deaths rate = number of deaths / country population
2730 June 2015 Samos Summit 2015