Embed Size (px)
Citation preview

Quantification of methane fluxes from local sites
using a combination of a tracer
release method, a Gaussian Model and an
atmospheric statistical inversion approach
S. Ars, G. Broquet, C. Yver Kwok, P. Bousquet
LSCE – CEA/UVSQ/CNRS, Gif-sur-Yvette, France
1 ICOS Conference – September 28th 2016
The tracer release method
Methane concentrations
Acetylene concentrations
1860 ppb
2100 ppb
ICOS Conference – September 28th 2016

The tracer release method
Methane concentrations
Acetylene concentrations
1860 ppb
2100 ppb
ICOS Conference – September 28th 2016

ICOS Conference – September 28th 2016
The tracer release method
Pros Cons
• Simple to implement • Enable the estimation of a large
number of sites
• Non-collocation of the tracer • Multiple sources • Spread sources
Wind Methane
Acetylene

ICOS Conference – September 28th 2016
The Gaussian model
Wind conditions
Emission rates
Gaussian model
Use of meteorological conditions that are stationary in time and homogeneous in space within the study period and area.
Cannot account precisely for the local topography and buildings.

Polyphemus Gaussian model developped by CEREA
Doury
Briggs
Pasquill
Q : source emission rate ū : mean wind speed velocity y : crosswind horizontal direction ys : source coordinate z : vertical coordinate zp : plume height above the ground
sy and sz : gaussian plume standard deviations in the horizontal (crosswind) and vertical directions
sy & sz
?
AGU 2015 – December 15 2015 6
The Gaussian model

Polyphemus Gaussian model developped by CEREA
Briggs
Q : source emission rate ū : mean wind speed velocity y : crosswind horizontal direction ys : source coordinate z : vertical coordinate zp : plume height above the ground
sy and sz : gaussian plume standard deviations in the horizontal (crosswind) and vertical directions
sy & sz
?
AGU 2015 – December 15 2015 7
The Gaussian model

ICOS Conference – September 28th 2016
The Gaussian model
Use of the tracer data: Configuration optimization of
the model parameterization
Assessment of the model uncertainty for the configuration of the observation errors in the statistical inversion

fa = fb + BHT (HBHT+R)-1 (y0 – Hfb)
A = (B-1 + HTR-1H)-1
fa Inverted fluxes
fb Prior fluxes
y0 Observations
A Covariance matrix
B Covariance matrix of the prior
fluxes error
R Covariance matrix of the
observations and model errors
H Observation operator
9
Statistical inversion
ICOS Conference – September 28th 2016

ICOS Conference – September 28th 2016
Tested configurations: Config. 1: Methane and acetylene collocated (blue) Config. 2: Methane located downwind in comparison with the tracer (orange) Config. 3: Lateral shift between methane and acetylene (green) Config. 4: Two sources of methane with and one source of acetylene (grey)
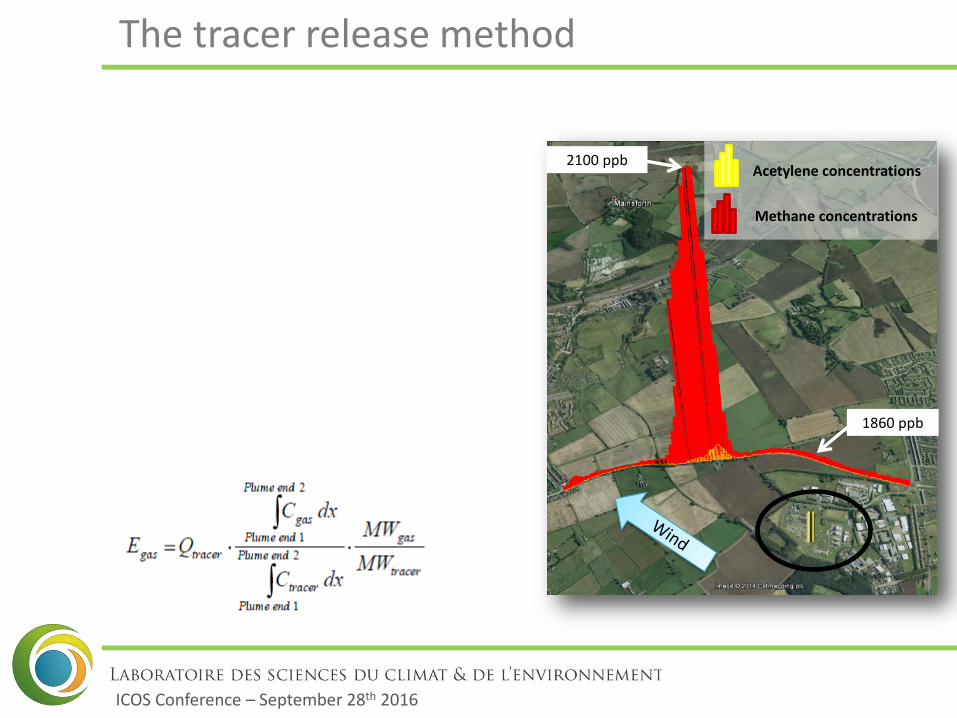
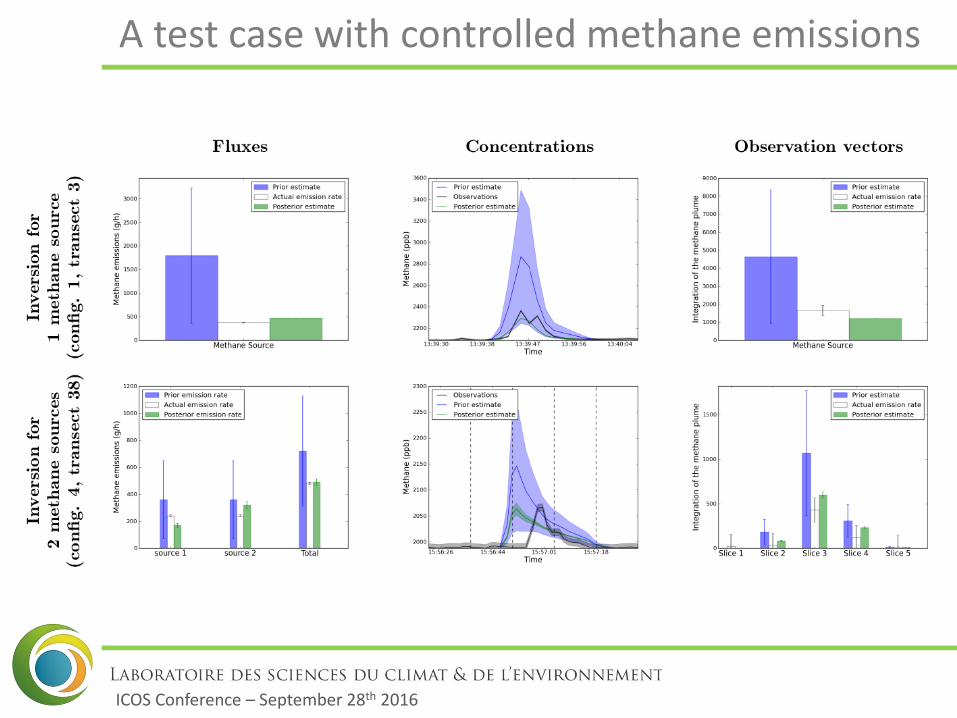
A test case with controlled methane emissions

ICOS Conference – September 28th 2016
A test case with controlled methane emissions
As expected, tracer release method gives better estimates than the combined approach when the tracer and the methane sources are perfectly collocated because the tracer is a better proxy than the model in this case.
When the tracer is not perfectly collocated or when there are several sources within a site, the combined approach gives better estimates.
ICOS Conference – September 28th 2016
A test case with controlled methane emissions

ICOS Conference – September 28th 2016
Estimate of the tracer mislocation error in an OSSE framework
The methane and acetylene concentrations are modeled with the Gaussian model at known emission rates. The emission plumes transects of both gases are integrated and used to calculate the methane emission rate with the same formula than the tracer release technique. The calculated emission rates are compared with the actual methane emission rates used in the Gaussian model. Errors are estimated for a downwind shift (a), an upwind shift (b) and a lateral shift (c).

ICOS Conference – September 28th 2016
Combined method applied to a concrete case
a
b
The Grignon farm

ICOS Conference – September 28th 2016
Combined method applied to a concrete case
Prior and posterior emission rates from the statistical inversion:

ICOS Conference – September 28th 2016
Combined method applied to a concrete case
Examples of plume transects simulated with prior and posterior emission rates:

ICOS Conference – September 28th 2016
Conclusions and perspectives
The combination of the tracer release method, a Gaussian transport model and a statistical atmospheric inversion approach has been tested with controlled methane emissions and compared to the classic tracer release technique for several configuration of tracer and methane sources. The combined method gives generally better estimates of the global emission rate of a site except in the case of a perfect collocation of the tracer and the methane which is extremely rare in real industrial cases. The combined method is applied to a concrete case in order to estimate methane emissions from a farm. The method gives a good estimate of the total amount of methane emitted but it also diagnoses itself to have some difficulties to target all individual facilities through its diagnostic of the individual uncertainties. However the method still manage to separate some parts of the site.