Embed Size (px)
Citation preview

Optimization of sample configurations for variogram estimation*
Alessandro Samuel-Rosa(1), Gerard Heuvelink(2),Gustavo Vasques(3), Lúcia Anjos(1)
* Presented at Pedometrics 2015, 14 – 18 September 2015, Córdoba, Spain(1) Universidade Federal Rural do Rio de Janeiro, Seropédica, Brazil.(2) ISRIC – World Soil Information, Wageningen, the Netherlands.(3) Embrapa Soils, Rio de Janeiro, Brazil. Student
Presentation

Optimization of sample configurations for variogram estimation
Alessandro Samuel-Rosa, Gerard Heuvelink, Gustavos Vasques, Lúcia Anjos
Separation distance
Sem
ivar
ianc
e
The problem at hand
● The variogram is a key tool in modern soil mapping
● How to design a sample to identify the form of the variogram model and estimate its parameters?
Z (s)=m(s)+ϵ(s)
NuggetPartial sill
Range
SmoothnessExponential
SphericalGaussian
Matérn
CircularAnisotropy

Optimization of sample configurations for variogram estimation
Alessandro Samuel-Rosa, Gerard Heuvelink, Gustavos Vasques, Lúcia Anjos
Separation distance
Sem
ivar
ianc
e
What are the existing solutions?
● “Simple” designs– Regular squared grids are still commonly used
● “Less complex” designs (1980s)– Number of point-pairs per lag (Warrick and Myers, 1987)
– Commonly produces a large cluster of points
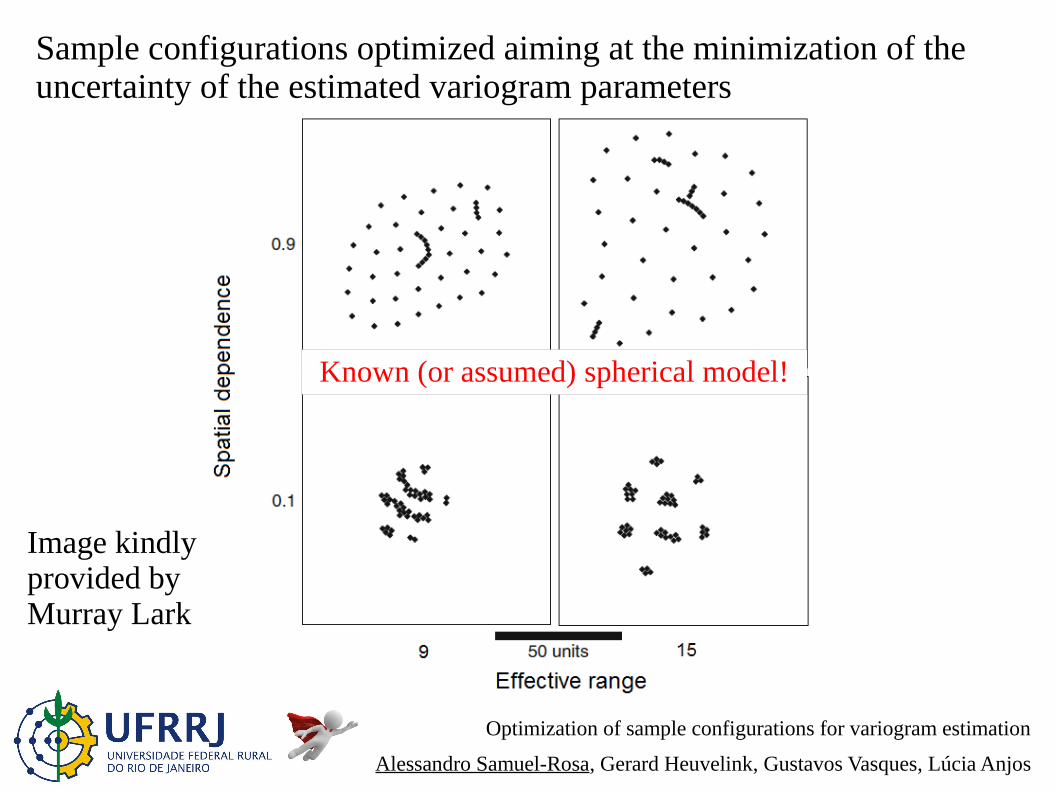
● “More complex” designs (>1990s)– Minimize the uncertainty of estimated parameters
– Require the form of the variogram to be known
Optimization of sample configurations for variogram estimation
Alessandro Samuel-Rosa, Gerard Heuvelink, Gustavos Vasques, Lúcia Anjos
Separation distance
Sem
ivar
ianc
eSample configurations optimized aiming at the minimization of the uncertainty of the estimated variogram parameters
Image kindly provided by Murray Lark
Known (or assumed) spherical model!

Optimization of sample configurations for variogram estimation
Alessandro Samuel-Rosa, Gerard Heuvelink, Gustavos Vasques, Lúcia Anjos
Separation distance
Sem
ivar
ianc
e
We came up with an idea!
● Maximize the quantity of information carried by every sample point– Maximum likelihood estimators (MLE)
● Accurately estimate the variogram intercept– The nugget variance is in the spotlight
– Concentrate on the short separation distances
● “Ideal” sample configuration– Multiple small clusters spread out across the area

Optimization of sample configurations for variogram estimation
Alessandro Samuel-Rosa, Gerard Heuvelink, Gustavos Vasques, Lúcia Anjos
Separation distance
Sem
ivar
ianc
e
A reasonable solution would be to...
● Define an objective function aiming at the distribution of the number of unique Points Per Lag
where li* is the wanted distribution and li is the observed
distribution of points per lag, and w is a vector of weights, with i = 1, 2, …, n, n being the number of lags.
● Goal: to have each point contributing to every lag
PPL=∑i=1
nwi(li
∗−li)
Optimization of sample configurations for variogram estimation
Alessandro Samuel-Rosa, Gerard Heuvelink, Gustavos Vasques, Lúcia Anjos
Separation distance
Sem
ivar
ianc
e
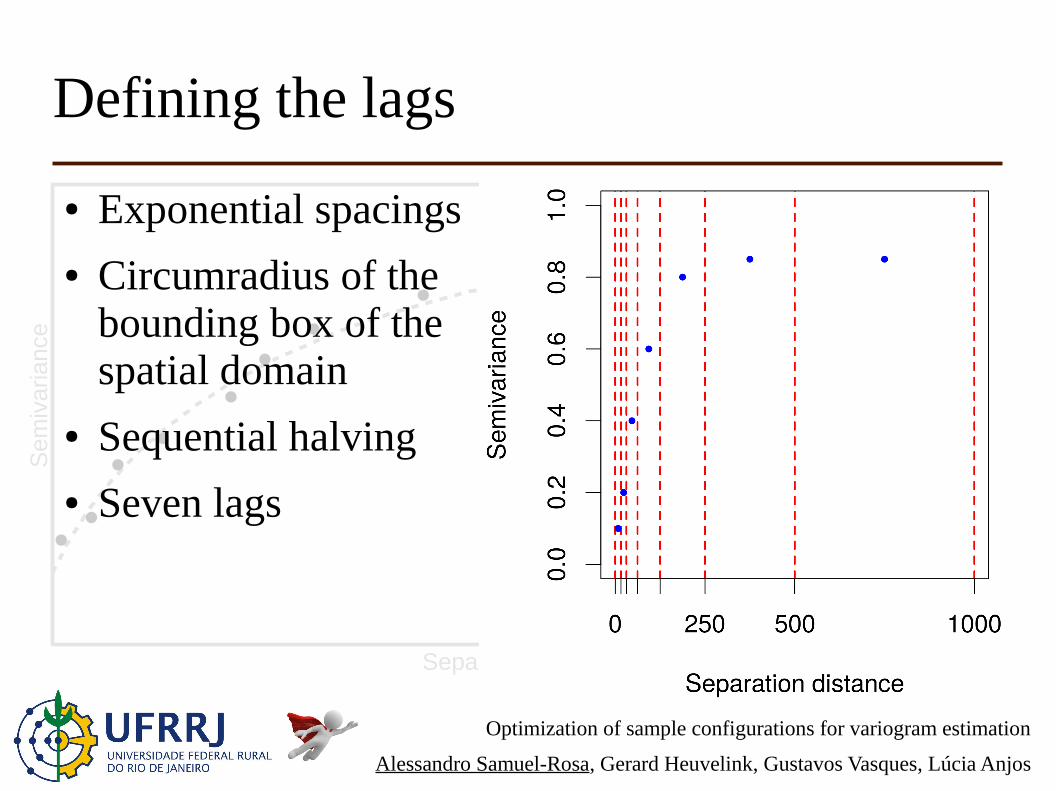
Defining the lags
● Exponential spacings● Circumradius of the
bounding box of the spatial domain
● Sequential halving● Seven lags

Optimization of sample configurations for variogram estimation
Alessandro Samuel-Rosa, Gerard Heuvelink, Gustavos Vasques, Lúcia Anjos
Separation distance
Sem
ivar
ianc
e
Testing
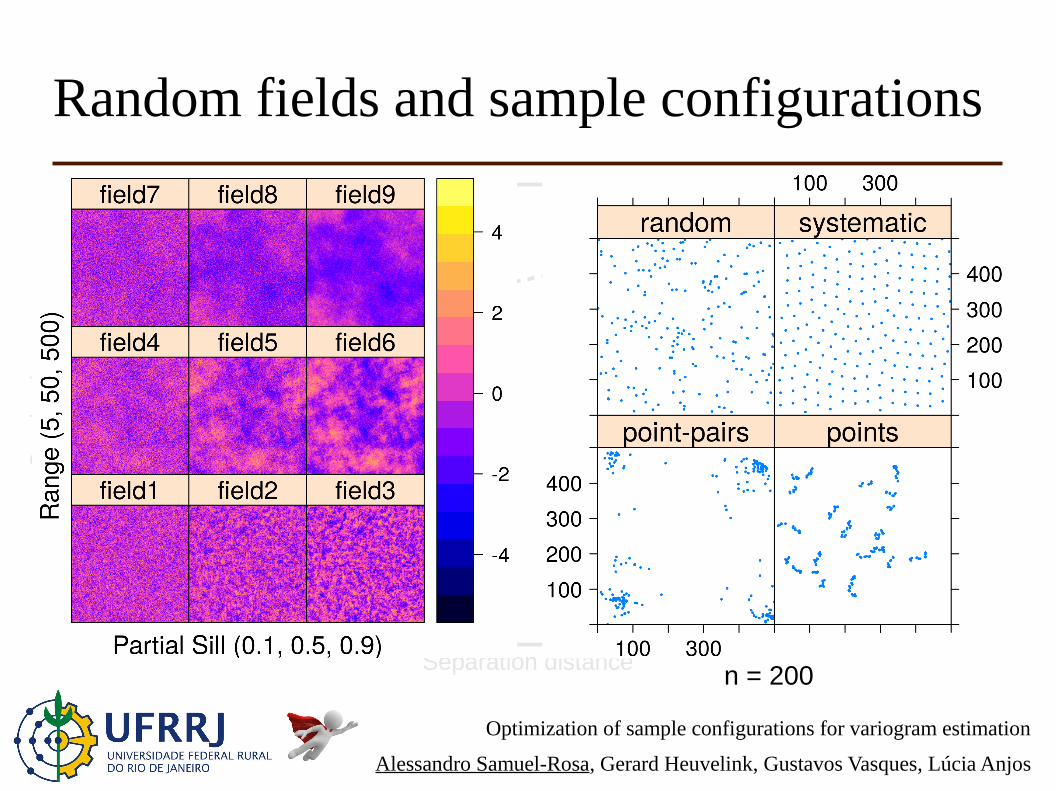
● How well do we estimate the variogram parameters?– Unconditional sequential simulation of isotropic
Gaussian random fields● Nugget/sill (0.1, 0.5, 0.9) and range/extent (0.01, 0.1, 1.0)
– Random, systematic, point-pairs per lag, points per lag● Three samples with three sizes (50, 100, 200)
– Estimate the variogram parameters using REML (geoR)
NuggetPartial sill
RangeExponential
Optimization of sample configurations for variogram estimation
Alessandro Samuel-Rosa, Gerard Heuvelink, Gustavos Vasques, Lúcia Anjos
Separation distance
Sem
ivar
ianc
e
Random fields and sample configurations
n = 200

Optimization of sample configurations for variogram estimation
Alessandro Samuel-Rosa, Gerard Heuvelink, Gustavos Vasques, Lúcia Anjos
Separation distance
Sem
ivar
ianc
e
Preliminary results – Nugget
● Best: points per lag and point-pairs per lag– Regardless of the sample size
● More accurate with moderate to long range– More samples for short range
● Random and systematic: too few points in the first lags– Accuracy of systematic sample increased with size

Nugget (n = 50)
True
Est
imat
ed
0.4
0.6
0.8
1.0
1.2
0.2 0.4 0.6 0.8
●●
●
●
●
●
●●
●
points5
0.0
0.2
0.4
0.6
0.8
1.0
0.2 0.4 0.6 0.8
●
●
●
●
●●
●
●
●
pairs5
0.0
0.5
1.0
1.5
0.2 0.4 0.6 0.8
●
●
●
●
●
●
●
●●
random5
0.0
0.5
1.0
0.2 0.4 0.6 0.8
●●●
●
●
●
●
●●
systematic5
0.2
0.4
0.6
0.8
1.0
0.2 0.4 0.6 0.8
●
●
●
●
●
●
●
●
●
points50
0.2
0.4
0.6
0.8
1.0
0.2 0.4 0.6 0.8
●
●
●
●
●
●
●
●
●
pairs50
0.6
0.8
1.0
1.2
1.4
0.2 0.4 0.6 0.8
●
●
●
●
●
●
●
●
●
random50
0.0
0.5
1.0
0.2 0.4 0.6 0.8
●
●
●
●
●
●
●
●
●
systematic50
0.2
0.4
0.6
0.8
1.0
0.2 0.4 0.6 0.8
●
●
●
●
●
●
●
●
●
points500
0.2
0.4
0.6
0.8
1.0
0.2 0.4 0.6 0.8
●
●
●
●
●
●
●
●
●
pairs500
0.5
1.0
1.5
0.2 0.4 0.6 0.8
●
●
●
●
●
●
●
●
●
random500
0.0
0.5
1.0
0.2 0.4 0.6 0.8
●●●
●
●
●
●
●
●
systematic500

Optimization of sample configurations for variogram estimation
Alessandro Samuel-Rosa, Gerard Heuvelink, Gustavos Vasques, Lúcia Anjos
Separation distance
Sem
ivar
ianc
e
Preliminary results – Partial sill
● Somewhat difficult– More than three replicates to get consistent conclusions
– Tuning of the optimizer
● Accuracy increased with sample size– For all sample configurations
– Moderate range (50 units)
– Systematic sampling

Partial sill (n = 100)
True
Est
imat
ed
0.0
0.5
1.0
0.2 0.4 0.6 0.8
●
●
●
● ●
●
●
●
●
points5
0.0
0.2
0.4
0.6
0.8
1.0
0.2 0.4 0.6 0.8
●
●
●
●
●
●
●
●
●
pairs5
0.0
0.5
1.0
0.2 0.4 0.6 0.8
●●
●
●
●
●
●
●
●
random5
0.0
0.5
1.0
1.5
0.2 0.4 0.6 0.8
●
●
●
●
●
●
●
●
●
systematic5
0.0
0.2
0.4
0.6
0.8
0.2 0.4 0.6 0.8
●
●
●
●
●
●
●
●
●
points50
0.2
0.4
0.6
0.2 0.4 0.6 0.8
●
●
●
●●
●
●
●
●
pairs50
0.0
0.5
1.0
0.2 0.4 0.6 0.8
●
●
●●
●
●
●
●
●
random50
0.2
0.4
0.6
0.8
1.0
1.2
0.2 0.4 0.6 0.8
●
●
●
●
●
●
●
●
●
systematic50
02
46
0.2 0.4 0.6 0.8
● ●
●
● ● ●
●
●
●
points500
0.0
0.2
0.4
0.6
0.2 0.4 0.6 0.8
●
●
●
●
●
●
●
●
●
pairs500
0.0
0.5
1.0
0.2 0.4 0.6 0.8
●
●
●● ●●
●
●
●
random500
01
23
45
0.2 0.4 0.6 0.8
●
●
●
● ●
●
●
●
●
systematic500

Optimization of sample configurations for variogram estimation
Alessandro Samuel-Rosa, Gerard Heuvelink, Gustavos Vasques, Lúcia Anjos
Separation distance
Sem
ivar
ianc
e
Preliminary results – Range
● Short to moderate (5 and 50 units)– Higher accuracy as expected
● More accurate as the sample size increases– Regardless of the sample configuration
● Small sample size, moderate to low nugget– Points per lag had the highest accuracy

Range (n = 50)
True
Est
imat
ed
020
000
6000
0
0 100 300 500
●
●
●
● ● ●●
●
●
points0.1
050
000
1500
00
0 100 300 500
● ●
●
● ● ●●
●
●
pairs0.1
050
100
150
0 100 300 500
●
● ●● ● ●● ● ●
random0.1
24
68
10
0 100 300 500
● ●
●
● ● ●
●
●
●
systematic0.1
010
000
3000
0
0 100 300 500
● ●
●
● ● ●● ● ●
points0.5
050
0015
000
2500
0
0 100 300 500
● ●
●
● ● ●● ●
●
pairs0.5
020
000
6000
0
0 100 300 500
● ● ●
●
● ●● ● ●
random0.5
020
000
5000
0
0 100 300 500
●
●
●●
●
●●
●
●
systematic0.5
050
100
200
0 100 300 500
●
●
●
●
●
●
●
●
●
points0.9
020
000
6000
0
0 100 300 500
● ●●
●
● ●● ●●
pairs0.9
020
040
060
0
0 100 300 500
●
● ●
●
● ●● ● ●
random0.9
050
0015
000
0 100 300 500
●
●
●●
●
●●●
●
systematic0.9

Optimization of sample configurations for variogram estimation
Alessandro Samuel-Rosa, Gerard Heuvelink, Gustavos Vasques, Lúcia Anjos
Separation distance
Sem
ivar
ianc
e
Final considerations
● Accurate estimation of the nugget variance– Distribution of points or point-pairs per lag
● Remember that these are “suboptimal”● Directional constraints are not included
● Points per lag and small samples● Systematic sampling is efficient with large samples● More than three samples for consistent conclusions

Optimization of sample configurations for variogram estimation
Alessandro Samuel-Rosa, Gerard Heuvelink, Gustavos Vasques, Lúcia Anjos
Separation distance
Sem
ivar
ianc
e
More info
● This presentation is available at
– slideshare.net/alessandrosamuelrosa● Source code:
– github.com/samuel-rosa/spsann● R-package (on CRAN):
– spsann (optimization of sample configurations using SPatial Simulated ANNealing)

Optimization of sample configurations for variogram estimation
Alessandro Samuel-Rosa, Gerard Heuvelink, Gustavos Vasques, Lúcia Anjos
Separation distance
Sem
ivar
ianc
e
Now we want to hear you!
● Critiques● Questions● Comments● Suggestions
Contact: alessandrosamuelrosa at gmail.com