Embed Size (px)
Citation preview
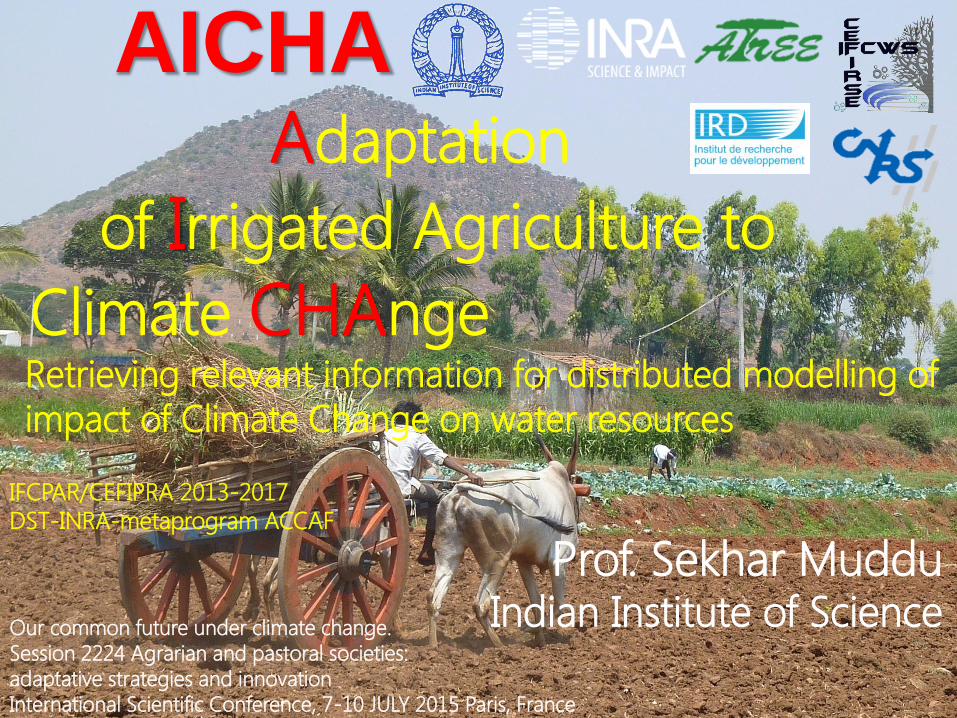
Prof. Sekhar Muddu Indian Institute of Science
AICHA Adaptation
of Irrigated Agriculture to
Climate CHAnge Retrieving relevant information for distributed modelling of
impact of Climate Change on water resources
IFCPAR/CEFIPRA 2013-2017
DST-INRA-metaprogram ACCAF
Our common future under climate change.
Session 2224 Agrarian and pastoral societies:
adaptative strategies and innovation
International Scientific Conference, 7-10 JULY 2015 Paris, France

Recharge
Recharge
Pum
ping
Groundwater Model
Crop Model
Spatia
lisin
g c
ouple
d m
odel
Coupled STICS + AMBHAS-GW
2
GW
InflowDraft
Recharge
Sy h/tWater table fluctuations
GW
outflow
Recharge
Precipitation
Evapotranspiration
Runoff
θ/t
Groundwater
Model
Soil moisture
balance model
Soil moisture changes
GW
InflowDraft
Recharge
Sy h/tWater table fluctuations
GW
outflow
Recharge
Precipitation
Evapotranspiration
Runoff
θ/t
Groundwater
Model
Soil moisture
balance model
Soil moisture changes
GW
InflowDraft
Recharge
Sy h/tWater table fluctuations
GW
outflow
Recharge
Precipitation
Evapotranspiration
Runoff
θ/t
Groundwater
Model
Soil moisture
balance model
Soil moisture changes
Crop model
Calibration of the DHM and simulation of future scenarios
Characterization of the system for the distributed hydrological model – Estimation of soil
hydraulic properties, Calibration of crop & groundwater models, Scale issues for water
balance.
Future simulations of the coupled model- Would require cropping choice & ground water
pumping scenarios. 2

Estimation of Soil Hydraulic Properties using inversion
Inversion of Crop Model: Variables: Surface soil moisture [Surface soil moisture, Leaf Area Index (LAI) ] Parameters: Field Capacity, Wilting point and soil depth.
Inversion of crop model
Inversion model (GLUE) applied with FIVE crop
types to develop a map of soil hydraulic
properties in Berambadi WS using SAR data
(10-30 cm)
(50-150 cm)
(>150 cm)
3

Estimation of root zone SHP’s using satellite data
Crop model inversion method
Adaptation of the method to the catchment scale
0
5
10
15
20
25
30
0 5 10 15 20 25 30
Esti
ma
ted
Val
ues
Observed Values
Field Capacity Layer-1
0
5
10
15
20
25
30
0 5 10 15 20 25 30
Esti
mat
ed V
alu
es
Observed Values
Field Capacity Layer-2
4

Major crops – Sunflower, Marigold, Sorghum, Maize, Turmeric = 64%
5
October 2013
Major crops – Sunflower, Marigold, Sorghum, Maize, Turmeric = 66%
September 2014
Comparison of ET from Energy & Water balance
0
5
10
15
20
25
May-12 Jun-12 Jul-12 Aug-12 Sep-12 Oct-12 Nov-12 Dec-12 Jan-13
Water balance
Energy balance
Evap
otr
ansp
irat
ion
(m
m)
Eswar, Sekhar, Bhattacharya (2013) Journal of Geophysical Res- Atmosphere
450 484
9611071
681
997927
848 867 841
539652
806
-517 -473
24 25
-310
43
-136 -179 -206 -164
-444-317
-194
-800
-300
200
700
1200
2002 2004 2006 2008 2010 2012 Mean
Rainfall (mm/y)
ET in mm/year
Rai
nfa
ll,(P
-ET
)
P-ET mm/y
0
2
4
6
8
25
-11
-20
01
02
-02
-20
02
15
-04
-20
02
26
-06
-20
02
06
-09
-20
02
17
-11
-20
02
25
-01
-20
03
07
-04
-20
03
18
-06
-20
03
29
-08
-20
03
09
-11
-20
03
17
-01
-20
04
29
-03
-20
04
09
-06
-20
04
20
-08
-20
04
31
-10
-20
04
09
-01
-20
05
22
-03
-20
05
02
-06
-20
05
13
-08
-20
05
24
-10
-20
05
01
-01
-20
06
14
-03
-20
06
25
-05
-20
06
05
-08
-20
06
16
-10
-20
06
27
-12
-20
06
06
-03
-20
07
17
-05
-20
07
28
-07
-20
07
08
-10
-20
07
19
-12
-20
07
26
-02
-20
08
08
-05
-20
08
19
-07
-20
08
29
-09
-20
08
10
-12
-20
08
18
-02
-20
09
01
-05
-20
09
12
-07
-20
09
22
-09
-20
09
03
-12
-20
09
10
-02
-20
10
23
-04
-20
10
04
-07
-20
10
14
-09
-20
10
25
-11
-20
10
02
-02
-20
11
15
-04
-20
11
26
-06
-20
11
06
-09
-20
11
17
-11
-20
11
25
-01
-20
12
06
-04
-20
12
17
-06
-20
12
28
-08
-20
12
08
-11
-20
12
17
-01
-20
13
30
-03
-20
13
10
-06
-20
13
21
-08
-20
13
01
-11
-20
13
Mean daily Evapotranspiration (mm)
Evap
otr
ansp
irat
ion
(mm
)
Mean (P-ET) = 200 mm For 10 years = 2000 mm = 2m GWL change = 2m / Sy =20 m

Groundwater Budget
underflowrunoffy QQETPhS ~ zero
5.0
7.5
10.0
12.5
15.0
17.5
20.0
22.5
25.0
27.5
30.0
Apr-10 Apr-11 Apr-12 Apr-13 Apr-14
Dep
th t
o g
rou
nd
wa
ter
(m)
# 131
5.0
10.0
15.0
20.0
Apr-10 Apr-11 Apr-12 Apr-13 Apr-14
Dep
th t
o g
rou
nd
wa
ter
(m)
# 200 6
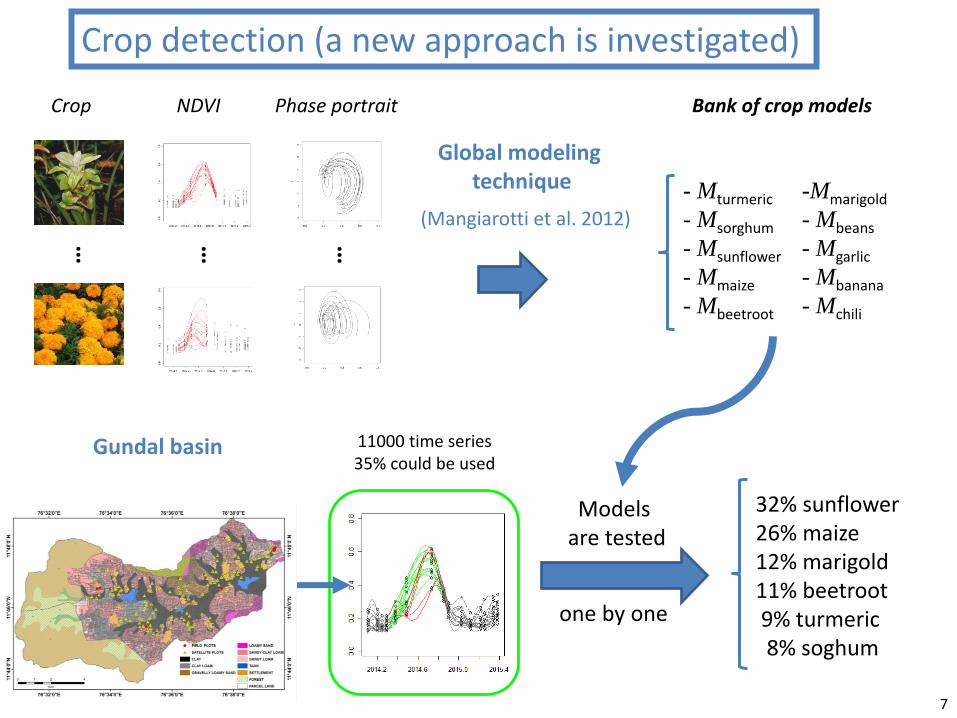
Crop detection (a new approach is investigated)
…
NDVI Crop Phase portrait
- Mturmeric
- Msorghum
- Msunflower
- Mmaize
- Mbeetroot
…
…
Bank of crop models
-Mmarigold
- Mbeans
- Mgarlic
- Mbanana
- Mchili
Global modeling technique
(Mangiarotti et al. 2012)
Models are tested
one by one
Gundal basin
32% sunflower 26% maize 12% marigold 11% beetroot 9% turmeric 8% soghum
11000 time series 35% could be used
7

1976-2005.
19 GCMs of CMIP-3 & 3 RCMs from CORDEX:
COSMO-CLM, RegCM4-LMDZ, and SMHI-RCA.
Climate projections to assess sustainability of current practices
Pumping: Business as usual
8

Climate projections to assess adaptation with realistic scenarios
Policy and market interventions that
promote environmentally sound
cropping practices e.g. Electricity
for Pumping, fertilizers and pesticides,
technology (drought tolerant varieties,
drip irrigation…)
Pumping: Reduced
9