Embed Size (px)
Citation preview
Submitted to the Astrophysical Journal LettersPreprint typeset using LATEX style emulateapj v. 04/17/13
LYMAN-ALPHA EMISSION FROM A LUMINOUS z=8.68 GALAXY: IMPLICATIONS FOR GALAXIES ASTRACERS OF COSMIC REIONIZATION
Adi Zitrin1,2, Ivo Labbe3, Sirio Belli1, Rychard Bouwens3, Richard S. Ellis1, Guido Roberts-Borsani3,4, DanielP. Stark5, Pascal A. Oesch6,7, Renske Smit8
Submitted to the Astrophysical Journal Letters
ABSTRACT
We report the discovery of Lyman-alpha emission (Lyα) in the bright galaxy EGSY-2008532660(hereafter EGSY8p7) using the MOSFIRE spectrograph at the Keck Observatory. First reported byRoberts-Borsani et al. (2015), it was selected for spectroscopic observations because of its photometricredshift (zphot = 8.57+0.22
−0.43), apparent brightness (H160 = 25.26 ± 0.09) and red Spitzer/IRAC [3.6]-[4.5] color indicative of contamination by strong oxygen emission in the [4.5] band. With a totalintegration of ∼ 4.3 hours, our data reveal an emission line at ' 11776 A which we argue is likely Lyαat a redshift zspec = 8.68, in good agreement with the photometric estimate. The line was detectedindependently on two nights using different slit orientations and its detection significance is ∼ 7.5σ.An overlapping sky line contributes significantly to the uncertainty on the total line flux but not theoverall significance. By direct addition and a Gaussian fit, we estimate a 95% confidence range of 1.0 -2.5 ×10⁻¹⁷ ergs cm−2 sec−1, corresponding to a rest-frame equivalent width of 17 - 42 A . EGSY8p7 isthe most distant galaxy confirmed spectroscopically to date, and the third luminous source in the EGSfield beyond zphot & 7.5 with detectable Lyα emission viewed at a time when the intergalactic mediumis expected to be fairly neutral. Although the reionization process was probably patchy, we discusswhether luminous sources with prominent IRAC color excesses may harbor harder ionizing spectrathan the dominant fainter population thereby creating earlier ionized bubbles. Further spectroscopicfollow-up of such bright sources promises important insight into the early formation of galaxies.
Subject headings: cosmology: observations — galaxies: high-redshift — galaxies: evolution — galaxies:formation
1. INTRODUCTION
Our understanding of the early Universe has improvedconsiderably in recent years through the photometric dis-covery of large numbers of high-redshift galaxies in bothdeep and gravitationally-lensed fields observed with theHubble Space Telescope (e.g. Ellis et al. 2013; McLureet al. 2013; Bradley et al. 2014; Oesch et al. 2014; Zhenget al. 2014; Bouwens et al. 2015b). Although uncertain-ties remain, the demographics and limited spectroscopicfollow-up of this early population has been used to ar-gue that star-forming galaxies played a significant role incompleting the reionization of the intergalactic medium(IGM) by a redshift z ∼ 6 (Robertson et al. 2013, 2015;Bouwens et al. 2015a). A key observation delineatingthe end of the reionization epoch is the marked declinebeyond z '6 in the visibility of Lyman alpha (Lyα)emission seen in continuum-selected galaxies (Stark et al.
1 Cahill Center for Astronomy and Astrophysics, CaliforniaInstitute of Technology, MC 249-17, Pasadena, CA 91125, USA;[email protected]
2 Hubble Fellow3 Leiden Observatory, Leiden University, NL-2300 RA Leiden,
The Netherlands4 Department of Physics and Astronomy, University College
London, Gower Street, London WC1E 6BT, UK5 Steward Observatory, University of Arizona, 933 N Cherry
Ave, Tucson, AZ 85721 USA6 Yale Center for Astronomy and Astrophysics, Physics De-
partment,New Haven, CT 06520, USA7 Department of Astronomy, Yale University, New Haven, CT
06520, USA8 Centre for Extragalactic Astronomy, Department of Physics,
Durham University, South Road, Durham DH1 3LE, UK
2010; Fontana et al. 2010; Ono et al. 2012; Schenker et al.2012, 2014). As Lyα represents a resonant transition itis readily scattered by the presence of neutral gas andthus acts as a valuable proxy for the state of the IGM.
There are, however, several limitations in using Lyαas a probe of reionization. Firstly, converting the declin-ing visibility of Lyα into a neutral gas fraction involvescomplex radiative transfer calculations and several un-certain assumptions. The currently observed decline (e.g.Schenker et al. 2014) implies a surprisingly rapid endto the process (Choudhury et al. 2014; Mesinger et al.2015). Secondly, simulations suggest that reionizationis likely to be a patchy process (Taylor & Lidz 2014)and thus conclusions drawn from the modest samplesof spectroscopically-targeted galaxies may be misleading(Treu et al. 2012; Pentericci et al. 2014; Tilvi et al. 2014).Finally, the absence of a Lyα detection in the spectrumof a proposed high redshift candidate may simply im-ply the source is a foreground galaxy. Ideally targetsin such studies would be spectroscopically confirmed in-dependently of Lyα, for example using UV metal lines(Stark et al. 2015b,a, see also Zitrin et al. 2015 ).
Although observational progress is challenged by thefaintness of targets selected in deep fields such as theHubble Ultra Deep Field (typically mAB ' 27), an im-portant development has been the identification of muchbrighter z > 7 candidates from the wider area, some-what shallower, Cosmic Assembly Near-infrared DeepExtragalactic Legacy Survey (CANDELS, Grogin et al.2011; Koekemoer et al. 2011). Surprisingly, some ofthese brighter targets reveal Lyα despite lying inside the
arX
iv:1
507.
0267
9v2
[as
tro-
ph.G
A]
13
Jul 2
015

2 Zitrin et al.
11700 11750 11800 11850 11900ï2
ï1
0
1
2
x 10ï18
h [Ang]
Flux
den
sity
[erg
/ (c
m2 s
A)]
FluxSmoothGauss1m
10
20
30
40
50
ï101
Pixe
l
Signal
Fig. 1.— Spectroscopic detection of emission in EGSY8p7 with MOSFIRE. The Upper panel shows the 2D spectrum below which we plotthe raw (black line) and smoothed (blue line) 1D spectrum and its error (red shading). The red line shows an example best-fit model ofthe data (§3).Vertical lines mark OH skyline positions. The upperleft panel shows a normalized signal map extracted along the slit withina 5 pixel (' 6.5 A) wide box centered on the line. The pattern of two negative peaks bracketing the positive peak exactly matches thatexpected from the dithering scheme used. Arrows show the predicted locations of other lines for a lower redshift interpretation of the line(see §3 for details).
putative partially neutral era. Finkelstein et al. (2013,hereafter F13) reported Lyα with a rest-frame equivalentwidth (EW) of 8 A at z=7.508 in a HAB=25.6 galaxy;Oesch et al. (2015, hereafter O15) find Lyα emission atz=7.73 with EW=21 A in an even brighter source atHAB=25.03; and Roberts-Borsani et al. (2015, hereafterRB15) identified a tentative Lyα emission (4.7σ) in aHAB=25.12 galaxy at a redshift z=7.477, which we havenow confirmed (Stark et al, in prep). In addition to theirextreme luminosities (MUV ' −22), these three sourceshave red [3.6] - [4.5] Spitzer/IRAC colors, indicative ofcontamination from strong [O III] and Balmer Hβ emis-sion.
Using the Multi-Object Spectrometer For Infra-RedExploration (MOSFIRE, McLean et al. 2012) on theKeck 1 telescope, we report the detection of a promi-nent emission line in a further bright candidate drawnfrom the CANDELS program. EGSY-2008532660 (here-after EGSY8p7; RA=14:20:08.50, DEC=+52:53:26.60)is a HAB=25.26 galaxy with a photometric redshift of8.57+0.22
−0.43 and a red IRAC [3.6]-[4.5] color, recently dis-covered by RB15. We discuss the likelihood that the lineis Lyα at a redshift zspec = 8.68 making this the most dis-tant spectroscopically-confirmed galaxy. Detectable Lyαemission at a redshift well beyond z ' 8 raises severalquestions regarding both the validity of earlier claims fornon-detections of Lyα in fainter sources, and the physicalnature of the luminous sources now being verified spec-
troscopically. Even if these bright systems are not rep-resentative of the fainter population that dominate theionization budget, they offer new opportunities to makespectroscopic progress in understanding early galaxy for-mation.
The paper is organized as follows: In §2 we reviewthe object selection, spectroscopic observations, and datareduction. The significance of the line detection and itsinterpretation as Lyα is discussed in §3. We discuss theimplications of the detectability of Lyα in the context ofthe earlier work in §4. Throughout we use a standardΛCDM cosmology with Ωm0 = 0.3, ΩΛ0 = 0.7, H0 = 100h km s−1Mpc−1, h = 0.7, and magnitudes are givenusing the AB convention. Errors are 1σ unless otherwisestated.
2. DATA
The galaxy EGSY8p7 was detected in the ExtendedGroth Strip (EGS; Davis et al. 2007) from deep (& 27.0)multi-band images in the CANDELS survey and first re-ported as one of four unusually bright (H160 < 25.5)candidate z > 7 galaxies by RB15. One of these, EGS-zs8-1, with zphot = 7.92±0.36 was spectroscopically con-firmed at z = 7.73 by O15. Normally such objects wouldbe selected as Y -band dropouts but, given Y -band ob-servations are not yet available over the full CANDELSfield, an alternative selection criterion was adopted thattakes advantage of red IRAC [3.6]-[4.5] colors, indicatingprominent [O III]+Hβ emission within the 4.6 µm band
Spectroscopic Measurement of a Redshift z=8.68 Galaxy 3
1.15 1.2 1.25 1.3 1.35x 10⁴
ï4
ï2
0
2
4
6
h [Ang]
Inte
grat
ed S
NR
Night 2
SNR3m
1.15 1.2 1.25 1.3 1.35x 10⁴
ï4
ï2
0
2
4
6
h [Ang]
Inte
grat
ed S
NR
Night 1
SNR3m
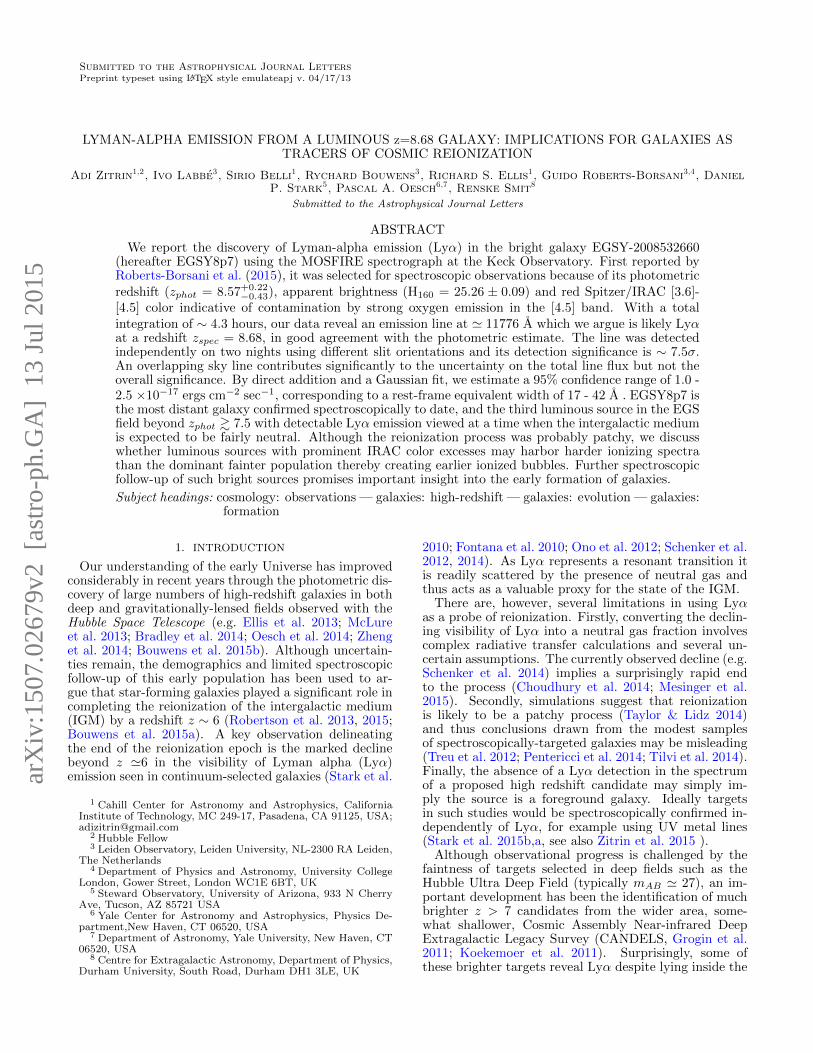
Fig. 2.— Confirmation of line detection in EGSY8p7 over two nights. Left: Hubble Space Telescope F160W image of the EGSY8p7 fieldwith the slit orientations adopted in two successive nights. Right: Extracted 1D signal/noise spectra across the J band for each night, witha zoom of the 2D data around the line, marked with a vertical blue line. The spectrum is smoothed with a Gaussian of σ = 5 A, comparableto the measured line width. The Y axis is scaled so that the peak signal/noise matches the integrated value (e.g. F13). Horizontal dashedlines mark the ±3σ region. On both nights, the signal/noise at the line location significantly exceeds that elsewhere.
(see also Labbe et al. 2013; Smit et al. 2015). Of the ob-jects listed by RB15, EGSY8p7 is the only one for whichY-band data is not available. As a result, its photometricredshift derived from HST data alone is fairly uncertain(5.6 < zphot < 9.2, see Fig. 5 of RB15) but including itsIRAC [3.6]-[4.5] color of 0.76 ±0.14 narrows the range tozphot = 8.57+0.22
−0.43.We observed EGSY8p7, the highest redshift candidate
in RB15’s list, on June 10 and 11 2015 with MOSFIREon the Keck 1 telescope. Observations in the J bandspanned the wavelength range 11530A < λ < 13520Ausing an AB dithering pattern of ±1.25′′ along the slitwith individual frames of 120 s. The slit masks on thetwo nights differed by 120 degrees in orientation bothwith a slit width of 0.7′′. In each mask we allocatedone slit to a nearby star to monitor changes in seeing,
transparency, and possible positional drifts. Conditionswere clear throughout, with an average seeing of 0.60′′ forthe first night and 0.76′′ for the second night. The nightlyexposure times, excluding frames contaminated by worsethan average seeing, are 158 min and 102 minutes, for atotal of 4.33 hours. Calibrations were obtained via long-slit observations of standard A0V stars.
Data reduction was performed using the standardMOSFIRE reduction pipeline9. For each flat-fielded slitwe extracted the 1D spectrum using a 11 pixel boxcarcentered on the expected position of the target. A simi-lar procedure was adopted in quadrature to derive the 1σerror distribution. To ensure that the derived error spec-trum reflects the noise properties of the data, we mea-sured the standard deviation of the pixel-by-pixel signal-
9 http://www2.keck.hawaii.edu/inst/mosfire/drp.html
4 Zitrin et al.
to-noise ratio, which should be unity for a set of indepen-dent values drawn from Gaussian distributions. We ob-tained a value of 1.3, implying that the errors are slightlyunderestimated by the pipeline, and corrected the errorspectrum accordingly. Data from both nights were co-added by inverse-variance averaging the calibrated 1Dspectra. We also allowed for relative shifts along the slitof 2 pixels ('0.2′′) and across the slit of 0.2′′(which af-fects the expected slit loss correction) and propagated theassociated uncertainty into our error budget. All reduc-tions and calibration steps were performed independentlyby two authors (AZ, SB).
To calibrate the spectra we scaled a Vega model10 toeach standard star to determine a wavelength-dependentrelative flux calibration and telluric correction using theprocedure described in Vacca et al. (2003). Independenttelluric calibrations derived from three standard starsagree to within 5% at the location of the detected emis-sion line. The absolute calibration for each night was de-rived by comparing the spectroscopic magnitude of thestars on the slitmask with photometric measures in theJ band obtained from the 3D-HST catalog (Brammeret al. 2012; Skelton et al. 2014). Note that this proceduretakes into account differential slit losses due to varyingseeing. The absolute calibration factors obtained for thetwo nights are consistent with differences arising fromseeing effects. We adopt a conservative absolute calibra-tion error of 30%, taking into account the nightly vari-ation, differences between the independent reductions,and other contributions mentioned above. The final 2Dand 1D spectra are shown in Fig. 1.
3. LYMAN α AT A REDSHIFT 8.68
Fig. 1 reveals a prominent line at λ ' 11776 A flankedby a skyline on its blue side. Examining the signal andassociated noise in a circular aperture of 6 pixels in radius– corresponding to ∼ 2 times the line width found below– we estimate a significance of 7.6σ in the 2D spectrumand, within the extracted 1D spectrum over the samespectral range, 7.5σ. This significance holds over a rangeof integration wavelengths both including and excludingthe sky line. Additionally, the line is detected indepen-dently on each night (6.0σ on night 1, 3.8σ on night 2),despite the changed slit orientation (Fig. 2). Taking thesignal/noise on the first night, and assuming it scalesas√t/FWHM, where t is the exposure and FWHM the
seeing, for the second night (where the exposure was lessand seeing worse) we predict a signal/noise similar tothat observed.
We estimate the observed line properties by using aMonte Carlo Markov Chain to fit a truncated Gaussianto the data (in a similar way to O15), taking into ac-count instrumental broadening. We leave the truncationpoint a free parameter, and mask out pixels contami-nated by strong skyline residuals. The proximate skylinesignificantly affects the fit, and different masking con-figurations yield different results. To span the range ofpossible solutions we repeat the model fitting, as well asdirect integration measurements, with a variety of mask-ing configurations. For each of these resulting modelswe calculate the 95% confidence level intervals. For each
10 http://kurucz.harvard.edu/stars/vega/
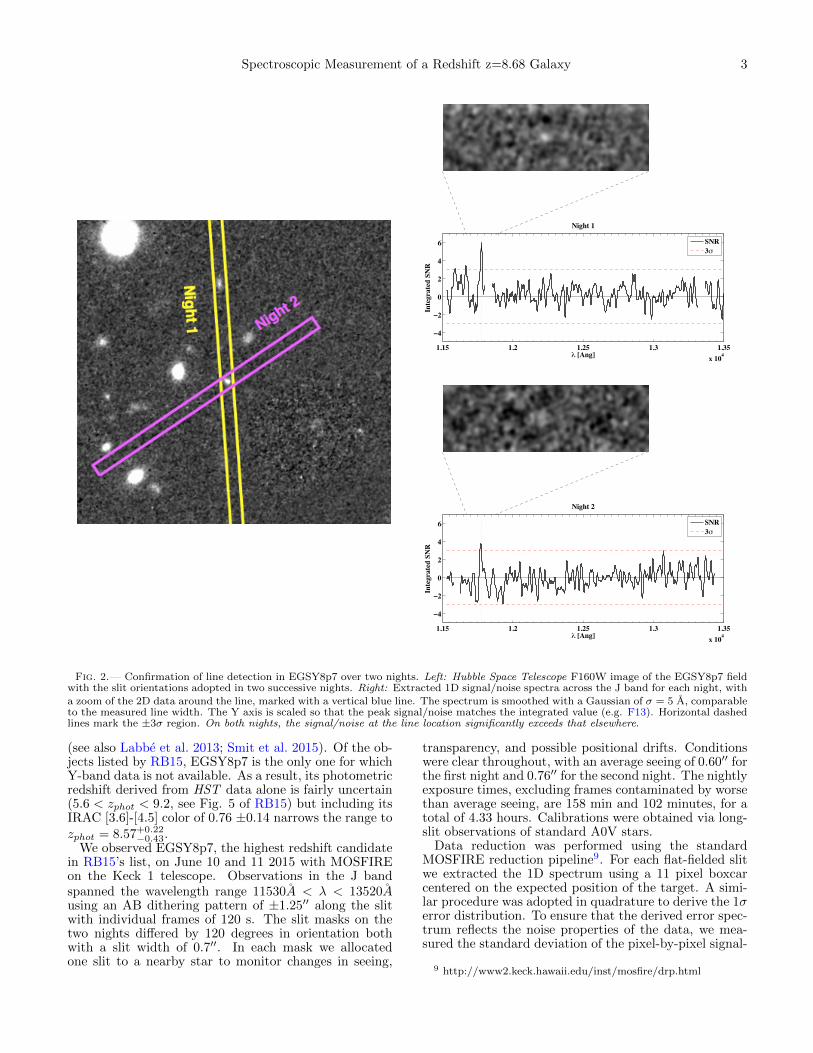
TABLE 1Emission Line properties
Name Fiducial model 95% C.I.
f(Lyα)a 1.7 [1.0 - 2.5]µb 11774 A [11770 - 11776] Azc 8.683 [8.679 - 8.684]EWd 28 A [17 - 42] Aσe 4.7 A [2.0 - 8.4] AVσ f 118 km s−1 [51 -214] km s−1
VFWHMg 277 km s−1 [120 -503] km s−1
Note. —Emission line properties derived from a truncated Gaus-sian fit (Fig.1), corrected for instrumental broadening,and not corrected for IGM absorption. The 95% rangequoted is adopted from a set of fits as described in thetext.a Total flux in units 10−17 erg cm−2 sec−1
b Peak of Gaussianc Redshiftd Rest frame EWe Gaussian line widthf Velocity width, corresponding to the Gaussian widthg Velocity FWHM (' 2.35× σ)
parameter we then take the union of the intervals fromdifferent models and report them in Table 1.
The line may be asymmetric with some attenuation onits blue side, but this is difficult to ascertain given theproximate skyline, and the best-fit models (Fig. 1) aremostly symmetric. The line peak lies between 11770 and11776 A which, for Lyα, implies a redshift of 8.68. Notethe typical peak wavelength is a few A bluer than theraw peak in Fig. 1. The line width ranges from 2.0 - 8.4A, corresponding to a velocity broadening, corrected forinstrumental effects, of Vσ = 51 - 214 km sec−1. Theline flux ranges from 1.0 − 2.5 × 10⁻¹⁷ erg cm−2 sec−1
(excluding the 30% uncertainties in the absolute calibra-tion). Importantly, the significance of the line remainsat the &7 σ level for all chosen integration methods andvariations in the masking of the skyline.
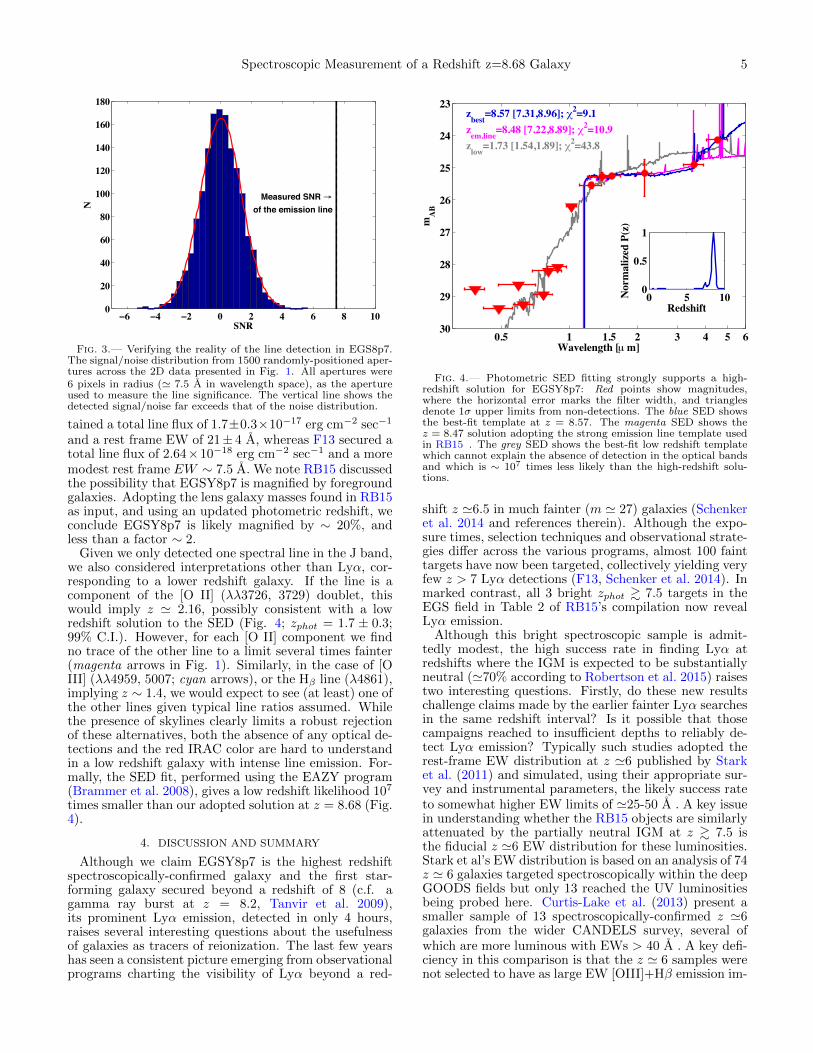
We can estimate the chance of finding such a line by ex-amining the signal/noise distribution in our combined 2Dspectral data at 1500 random locations taking the sameaperture used for measuring the line properties above.The resulting histogram in Fig. 3 reveals a very low prob-ability of finding such a feature by chance. Our measuredsignal/noise represents a 6σ deviation in the distribution(which has a width larger than unity due to correlatednoise). Together with the facts that the positive andnegative line positions in the 2D spectrum match thedithering pattern used (Fig. 1) and the line position isastrometrically centered on the target position along theslit on both nights, we conclude the probability for thedetection to be an artifact is negligibly small.
Adopting the identification of Lyα, the inferred red-shift of z=8.68 is satisfactorily close to the photometricestimate, zphot = 8.57+0.22
−0.43 reported by RB15. Usingthe HST H-band photometry unaffected by line emis-sion, for a reasonable UV slope (β = −2), the range ofline fluxes (Table 1) translates to a rest-frame equivalentwidth (EW) of 17 - 42 A. While formally fairly uncertain,it is comparable to line properties secured with MOS-FIRE for the other bright galaxies at zphot & 7.5 selectedin CANDELS with red IRAC colors (F13, O15). O15 ob-
Spectroscopic Measurement of a Redshift z=8.68 Galaxy 5
ï6 ï4 ï2 0 2 4 6 8 100
20
40
60
80
100
120
140
160
180
SNR
N
Measured SNR Aof the emission line
Fig. 3.— Verifying the reality of the line detection in EGS8p7.The signal/noise distribution from 1500 randomly-positioned aper-tures across the 2D data presented in Fig. 1. All apertures were6 pixels in radius (' 7.5 A in wavelength space), as the apertureused to measure the line significance. The vertical line shows thedetected signal/noise far exceeds that of the noise distribution.
tained a total line flux of 1.7±0.3×10⁻¹⁷ erg cm−2 sec−1
and a rest frame EW of 21± 4 A, whereas F13 secured atotal line flux of 2.64×10⁻¹⁸ erg cm−2 sec−1 and a moremodest rest frame EW ∼ 7.5 A. We note RB15 discussedthe possibility that EGSY8p7 is magnified by foregroundgalaxies. Adopting the lens galaxy masses found in RB15as input, and using an updated photometric redshift, weconclude EGSY8p7 is likely magnified by ∼ 20%, andless than a factor ∼ 2.
Given we only detected one spectral line in the J band,we also considered interpretations other than Lyα, cor-responding to a lower redshift galaxy. If the line is acomponent of the [O II] (λλ3726, 3729) doublet, thiswould imply z ' 2.16, possibly consistent with a lowredshift solution to the SED (Fig. 4; zphot = 1.7 ± 0.3;99% C.I.). However, for each [O II] component we findno trace of the other line to a limit several times fainter(magenta arrows in Fig. 1). Similarly, in the case of [OIII] (λλ4959, 5007; cyan arrows), or the Hβ line (λ4861),implying z ∼ 1.4, we would expect to see (at least) one ofthe other lines given typical line ratios assumed. Whilethe presence of skylines clearly limits a robust rejectionof these alternatives, both the absence of any optical de-tections and the red IRAC color are hard to understandin a low redshift galaxy with intense line emission. For-mally, the SED fit, performed using the EAZY program(Brammer et al. 2008), gives a low redshift likelihood 107
times smaller than our adopted solution at z = 8.68 (Fig.4).
4. DISCUSSION AND SUMMARY
Although we claim EGSY8p7 is the highest redshiftspectroscopically-confirmed galaxy and the first star-forming galaxy secured beyond a redshift of 8 (c.f. agamma ray burst at z = 8.2, Tanvir et al. 2009),its prominent Lyα emission, detected in only 4 hours,raises several interesting questions about the usefulnessof galaxies as tracers of reionization. The last few yearshas seen a consistent picture emerging from observationalprograms charting the visibility of Lyα beyond a red-
0.5 1 1.5 2 3 4 5 6
23
24
25
26
27
28
29
30Wavelength [µ m]
mA
B
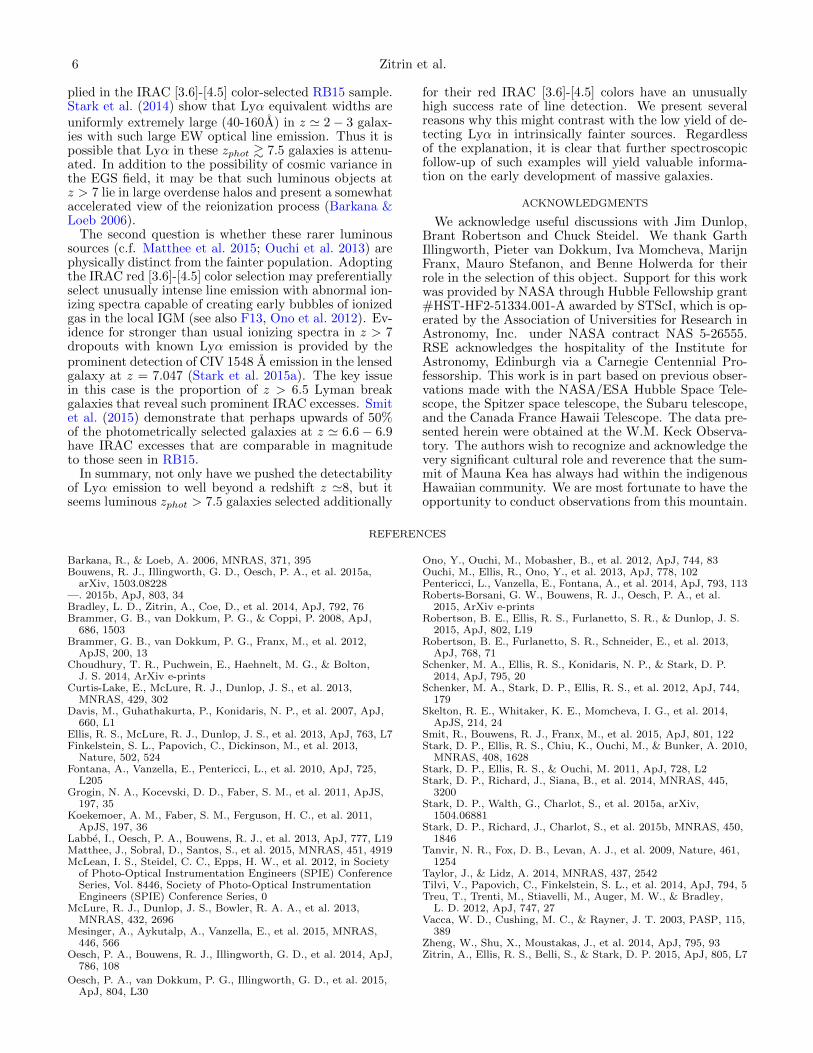
zbest=8.57 [7.31,8.96]; r2=9.1zem.line=8.48 [7.22,8.89]; r2=10.9zlow=1.73 [1.54,1.89]; r2=43.8
0 5 100
0.5
1
Redshift
Nor
mal
ized
P(z
)
Fig. 4.— Photometric SED fitting strongly supports a high-redshift solution for EGSY8p7: Red points show magnitudes,where the horizontal error marks the filter width, and trianglesdenote 1σ upper limits from non-detections. The blue SED showsthe best-fit template at z = 8.57. The magenta SED shows thez = 8.47 solution adopting the strong emission line template usedin RB15 . The grey SED shows the best-fit low redshift templatewhich cannot explain the absence of detection in the optical bandsand which is ∼ 107 times less likely than the high-redshift solu-tions.
shift z '6.5 in much fainter (m ' 27) galaxies (Schenkeret al. 2014 and references therein). Although the expo-sure times, selection techniques and observational strate-gies differ across the various programs, almost 100 fainttargets have now been targeted, collectively yielding veryfew z > 7 Lyα detections (F13, Schenker et al. 2014). Inmarked contrast, all 3 bright zphot & 7.5 targets in theEGS field in Table 2 of RB15’s compilation now revealLyα emission.
Although this bright spectroscopic sample is admit-tedly modest, the high success rate in finding Lyα atredshifts where the IGM is expected to be substantiallyneutral ('70% according to Robertson et al. 2015) raisestwo interesting questions. Firstly, do these new resultschallenge claims made by the earlier fainter Lyα searchesin the same redshift interval? Is it possible that thosecampaigns reached to insufficient depths to reliably de-tect Lyα emission? Typically such studies adopted therest-frame EW distribution at z '6 published by Starket al. (2011) and simulated, using their appropriate sur-vey and instrumental parameters, the likely success rateto somewhat higher EW limits of '25-50 A . A key issuein understanding whether the RB15 objects are similarlyattenuated by the partially neutral IGM at z & 7.5 isthe fiducial z '6 EW distribution for these luminosities.Stark et al’s EW distribution is based on an analysis of 74z ' 6 galaxies targeted spectroscopically within the deepGOODS fields but only 13 reached the UV luminositiesbeing probed here. Curtis-Lake et al. (2013) present asmaller sample of 13 spectroscopically-confirmed z '6galaxies from the wider CANDELS survey, several ofwhich are more luminous with EWs > 40 A . A key defi-ciency in this comparison is that the z ' 6 samples werenot selected to have as large EW [OIII]+Hβ emission im-
6 Zitrin et al.
plied in the IRAC [3.6]-[4.5] color-selected RB15 sample.Stark et al. (2014) show that Lyα equivalent widths areuniformly extremely large (40-160A) in z ' 2− 3 galax-ies with such large EW optical line emission. Thus it ispossible that Lyα in these zphot & 7.5 galaxies is attenu-ated. In addition to the possibility of cosmic variance inthe EGS field, it may be that such luminous objects atz > 7 lie in large overdense halos and present a somewhataccelerated view of the reionization process (Barkana &Loeb 2006).
The second question is whether these rarer luminoussources (c.f. Matthee et al. 2015; Ouchi et al. 2013) arephysically distinct from the fainter population. Adoptingthe IRAC red [3.6]-[4.5] color selection may preferentiallyselect unusually intense line emission with abnormal ion-izing spectra capable of creating early bubbles of ionizedgas in the local IGM (see also F13, Ono et al. 2012). Ev-idence for stronger than usual ionizing spectra in z > 7dropouts with known Lyα emission is provided by theprominent detection of CIV 1548 A emission in the lensedgalaxy at z = 7.047 (Stark et al. 2015a). The key issuein this case is the proportion of z > 6.5 Lyman breakgalaxies that reveal such prominent IRAC excesses. Smitet al. (2015) demonstrate that perhaps upwards of 50%of the photometrically selected galaxies at z ' 6.6− 6.9have IRAC excesses that are comparable in magnitudeto those seen in RB15.
In summary, not only have we pushed the detectabilityof Lyα emission to well beyond a redshift z '8, but itseems luminous zphot > 7.5 galaxies selected additionally
for their red IRAC [3.6]-[4.5] colors have an unusuallyhigh success rate of line detection. We present severalreasons why this might contrast with the low yield of de-tecting Lyα in intrinsically fainter sources. Regardlessof the explanation, it is clear that further spectroscopicfollow-up of such examples will yield valuable informa-tion on the early development of massive galaxies.
ACKNOWLEDGMENTS
We acknowledge useful discussions with Jim Dunlop,Brant Robertson and Chuck Steidel. We thank GarthIllingworth, Pieter van Dokkum, Iva Momcheva, MarijnFranx, Mauro Stefanon, and Benne Holwerda for theirrole in the selection of this object. Support for this workwas provided by NASA through Hubble Fellowship grant#HST-HF2-51334.001-A awarded by STScI, which is op-erated by the Association of Universities for Research inAstronomy, Inc. under NASA contract NAS 5-26555.RSE acknowledges the hospitality of the Institute forAstronomy, Edinburgh via a Carnegie Centennial Pro-fessorship. This work is in part based on previous obser-vations made with the NASA/ESA Hubble Space Tele-scope, the Spitzer space telescope, the Subaru telescope,and the Canada France Hawaii Telescope. The data pre-sented herein were obtained at the W.M. Keck Observa-tory. The authors wish to recognize and acknowledge thevery significant cultural role and reverence that the sum-mit of Mauna Kea has always had within the indigenousHawaiian community. We are most fortunate to have theopportunity to conduct observations from this mountain.
REFERENCES
Barkana, R., & Loeb, A. 2006, MNRAS, 371, 395Bouwens, R. J., Illingworth, G. D., Oesch, P. A., et al. 2015a,
arXiv, 1503.08228—. 2015b, ApJ, 803, 34Bradley, L. D., Zitrin, A., Coe, D., et al. 2014, ApJ, 792, 76Brammer, G. B., van Dokkum, P. G., & Coppi, P. 2008, ApJ,
686, 1503Brammer, G. B., van Dokkum, P. G., Franx, M., et al. 2012,
ApJS, 200, 13Choudhury, T. R., Puchwein, E., Haehnelt, M. G., & Bolton,
J. S. 2014, ArXiv e-printsCurtis-Lake, E., McLure, R. J., Dunlop, J. S., et al. 2013,
MNRAS, 429, 302Davis, M., Guhathakurta, P., Konidaris, N. P., et al. 2007, ApJ,
660, L1Ellis, R. S., McLure, R. J., Dunlop, J. S., et al. 2013, ApJ, 763, L7Finkelstein, S. L., Papovich, C., Dickinson, M., et al. 2013,
Nature, 502, 524Fontana, A., Vanzella, E., Pentericci, L., et al. 2010, ApJ, 725,
L205Grogin, N. A., Kocevski, D. D., Faber, S. M., et al. 2011, ApJS,
197, 35Koekemoer, A. M., Faber, S. M., Ferguson, H. C., et al. 2011,
ApJS, 197, 36Labbe, I., Oesch, P. A., Bouwens, R. J., et al. 2013, ApJ, 777, L19Matthee, J., Sobral, D., Santos, S., et al. 2015, MNRAS, 451, 4919McLean, I. S., Steidel, C. C., Epps, H. W., et al. 2012, in Society
of Photo-Optical Instrumentation Engineers (SPIE) ConferenceSeries, Vol. 8446, Society of Photo-Optical InstrumentationEngineers (SPIE) Conference Series, 0
McLure, R. J., Dunlop, J. S., Bowler, R. A. A., et al. 2013,MNRAS, 432, 2696
Mesinger, A., Aykutalp, A., Vanzella, E., et al. 2015, MNRAS,446, 566
Oesch, P. A., Bouwens, R. J., Illingworth, G. D., et al. 2014, ApJ,786, 108
Oesch, P. A., van Dokkum, P. G., Illingworth, G. D., et al. 2015,ApJ, 804, L30
Ono, Y., Ouchi, M., Mobasher, B., et al. 2012, ApJ, 744, 83Ouchi, M., Ellis, R., Ono, Y., et al. 2013, ApJ, 778, 102Pentericci, L., Vanzella, E., Fontana, A., et al. 2014, ApJ, 793, 113Roberts-Borsani, G. W., Bouwens, R. J., Oesch, P. A., et al.
2015, ArXiv e-printsRobertson, B. E., Ellis, R. S., Furlanetto, S. R., & Dunlop, J. S.
2015, ApJ, 802, L19Robertson, B. E., Furlanetto, S. R., Schneider, E., et al. 2013,
ApJ, 768, 71Schenker, M. A., Ellis, R. S., Konidaris, N. P., & Stark, D. P.
2014, ApJ, 795, 20Schenker, M. A., Stark, D. P., Ellis, R. S., et al. 2012, ApJ, 744,
179Skelton, R. E., Whitaker, K. E., Momcheva, I. G., et al. 2014,
ApJS, 214, 24Smit, R., Bouwens, R. J., Franx, M., et al. 2015, ApJ, 801, 122Stark, D. P., Ellis, R. S., Chiu, K., Ouchi, M., & Bunker, A. 2010,
MNRAS, 408, 1628Stark, D. P., Ellis, R. S., & Ouchi, M. 2011, ApJ, 728, L2Stark, D. P., Richard, J., Siana, B., et al. 2014, MNRAS, 445,
3200Stark, D. P., Walth, G., Charlot, S., et al. 2015a, arXiv,
1504.06881Stark, D. P., Richard, J., Charlot, S., et al. 2015b, MNRAS, 450,
1846Tanvir, N. R., Fox, D. B., Levan, A. J., et al. 2009, Nature, 461,
1254Taylor, J., & Lidz, A. 2014, MNRAS, 437, 2542Tilvi, V., Papovich, C., Finkelstein, S. L., et al. 2014, ApJ, 794, 5Treu, T., Trenti, M., Stiavelli, M., Auger, M. W., & Bradley,
L. D. 2012, ApJ, 747, 27Vacca, W. D., Cushing, M. C., & Rayner, J. T. 2003, PASP, 115,
389Zheng, W., Shu, X., Moustakas, J., et al. 2014, ApJ, 795, 93Zitrin, A., Ellis, R. S., Belli, S., & Stark, D. P. 2015, ApJ, 805, L7


![Spektroskopie von Lyman-alpha Übergängen schwerster ... · Lamb und Retherford [Lam47, Lam50, Lam51, Lam52a, Lam52b] der Nachweis, daß die Beschreibung des Wasserstoffatoms im](https://img.dokumen.tips/doc/110x75/60c563ae95723a5585275ff4/spektroskopie-von-lyman-alpha-oebergngen-schwerster-lamb-und-retherford-lam47.jpg)