Embed Size (px)
Citation preview

Application of UAS photogrammetry forassessment of flood driven fluvial
dynamics of montane stream
Jakub Langhammer1, Jakub Miřijovský2
1 Charles University in Prague, Faculty of Science, Dept. Of Physical Geography and Geoecology
2 Palacký University in Olomouc, Faculty of Science, Department of Geoinformatics

Outline
I. Aims, context and methodology
II. Study area
III. RPAS monitoring
o UAS photogrammetry
o UAS granulometry
IV. Results – case study, flood in June, 2013
V. ConclusionsResearch is supported by Czech Science Foundation Project P209/12/0997The impact of disturbance on the dynamics of fluvial processes in mountain landscapes

I. AIMS, CONTEXT METHODOLOGY

Research aims and context
Research aim
- Assessment of the dynamics of fluvial processes in
montane area under disturbance
Key tasks
- Acquirement of relevant spatial data for analysis of
geomorphological changes in montane streams
- Dynamics of fluvial processes in the basins
- Spatial distribution and volumes of bank erosion
and fluvial accumulations
- Simulation of potential future changes of riverbed
dynamics

Spatial data for small catchments
- Small catchments have specific requirements for spatial data
- High spatial resolution and accuracy for detailed analysis
- High temporal resolution for analyis of multitemporal changes
- High operability and flexibility of survey
- Reasonable operation costs
- ... but meet with frequent problems
- Lack of relevant data
- Data of unsatisfactory spatial or temporal resolution or quality
- Potential for application of new technologies
in surveying, monitoring and modeling
- Need of multidisciplinary approach

II. STUDY AREA, METHODOLOGY OFDATA ACQUISITION AND TREATMENT

Upper Vydra basin• Upper Vydra basin
– Sumava mts., Central Europe– Avg altitude 1100 m a.s.l., 90 sq km.– Effect of climate change
• Rise of air temperature since 1980‘s• Rising frequency of low magnitude flood events
– Extensive forest disturbance• Bark beetle outbreak since 1990‘s• Deforestation at 18 % of basin area

Roklanský + Javoří brook
• Study site– Experimental catchments
– Monitoring of rainfall-runoff processes since 2005
– Historical changes of stream planform
– Recent dynamics of bank erosion
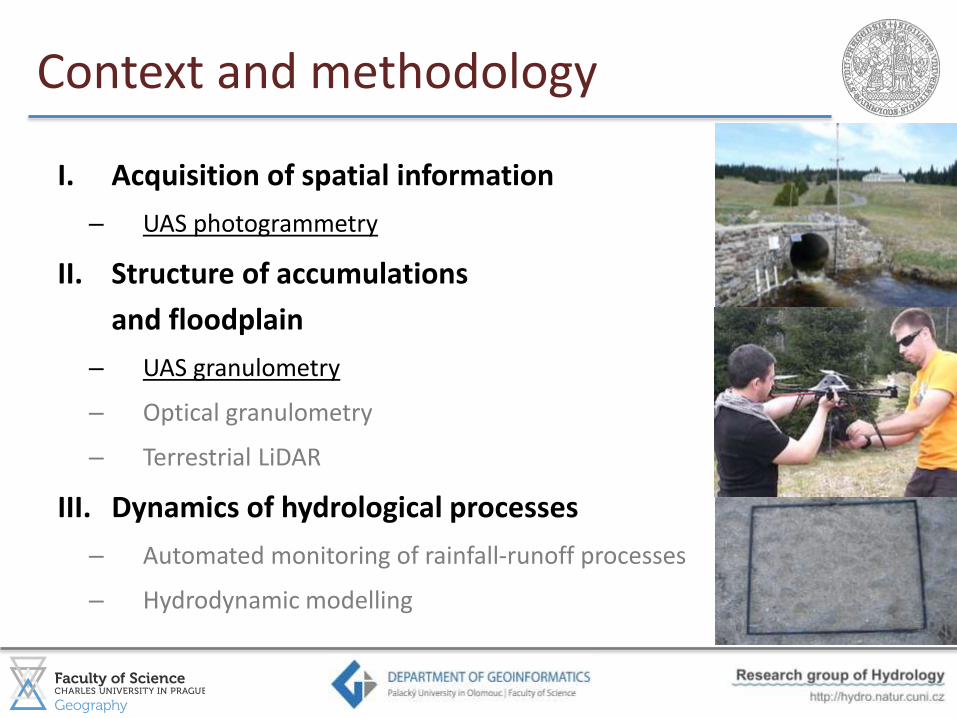
Context and methodology
I. Acquisition of spatial information
– UAS photogrammetry
II. Structure of accumulations
and floodplain
– UAS granulometry
– Optical granulometry
– Terrestrial LiDAR
III. Dynamics of hydrological processes
– Automated monitoring of rainfall-runoff processes
– Hydrodynamic modelling

UAS photogrammetry- applied technology
• Purpose– Data for precise DEM
acquisition
– Monitoring changes in fluvialmorphology
• Technology– UAS platform Mikrokopter
hexacopter
– Average flight alt. 50-90 m
– Calibrated camera
– Geodetic GPS for GCP capture
– SfM method

UAS photogrammetry- data acquisition– Monitoring using UAV system
– Hexacopter XL
– Copter with six propellers
– Advantages of UAV systems
• Operability
• Relatively cheap technology
• Spatial resolution from 1 cmTechnical specifications - Hexakopter
Action range 1 km
Flight Altitude 5 - 500 m
Take off and landing 0 m
Curb weight 1,5 kg
Speed flight 0 - 20 km/h
Autonomy Up to 30 min.
Wind condition 0 - 30 km/h
Wingspan size -
Engine Electric
Payload 1,5 kg

UAS photogrammetry- image processing• Image processing by Structure from Motion (SfM) methods
• Special case of the stereophotogrammetry (multiple views of the object)
• Agisoft Photoscan professional software
1. Photos aligning 2. Dense point cloud 3. Classification of the point cloud
4. DSM creation – 2 900 000 vertices 5. Orthophoto

Optical granulometry- principle
• Image analysistechnique
• Automated identificationof objects– Coarse-grained sediments
• Calibration
• Automatic calculationof grain size curves
• MatLab tool BaseGrain
• Data acquisition– UAS
– Field survey

• Setting up the parameters of classification- image analysis thresholds- connectivity- object distance- object area
Optical granulometry- identification of objects

• Automatic granullometric curve calculation
• Methodology - Fehr 1987– image analysis– photo analysis– line sampling– grading curve
Optical granulometry- analysis of results

III. RESULTS

Case studyFlood 2013-06
• Roklanský/Javoří cr.
1 flood
3 events 26-27.5. 30.5-2.6. 11.6.
Source data– Sensor network
2 monitoring profiles
– UAV scans
• 9.5.2013
• 27.9.2013
– Opticalgranulometry

UAS – Deriving the DEM

UAS – Deriving the DEM
Parameter Javori br.
Number of images 41
Flying altitude (m) 88
Ground sample distance (cm)
2
Number of Ground control points
34
Number of Tie points
215803
Error of the image coordinates (pix)
0,67
Point density(points/m2)
201
The average error in Z (m)
0,001
RMSEZ (m) 0,021

UAS – Deriving the DEM

21
UAS – change detection- lateral erosion after flood 2013

22River bank between May
2013, September 2013 and September 2014
Max. difference = 2,5 m
A
D
B
C

23
May
2013
(m3)
September
2013
(m3)
Difference
(m3)
8.984 5.841 3.143
Volumetric changeThe volume of material above the reference plane
Most active zone of erosion
September2013
May 2013

UAV based optical granulometry
• Selected zone ofactive fluvialaccummulations
• Low-altitude scanning
• Test field 40 x 20 m

UAV based optical granulometry
• Calibrated digital image
• Automated gravelometryclassification
– Coarse-grained sediments
– Calculation of grain size curves
– Sedimetrics
– BaseGrain2Parameter Javori br.
Number of images 86
Flying altitude (m) 8
Ground sample distance (mm) 1,7

A B
C
D
E
FG
H
I
Test fields
• Test fields– 1x1 m– 48 fields
• Transects– 8 transects A-I– fresh x old accumulations – expected differentiated
gradation

stream
Old deposits Fresh deposits
I-6 I-5 I-4 I-3 I-2 I-1
Example - transect I

• Calibration of parameters- recognition of objects- appropriate object size
• Corrections of classification- removing redundant objects (sand,
vegetation)- merging and splitting
of objects- deleting of redundant objects
Data calibration and corrections
I-3

I-3 I-4
I-5 I-4 I-3 I-2 I-1
Grading curves

River bankBar 1Fresh alluvial deposits
Bar 2Old alluvial deposits
Grain size distribution

IV. CONCLUSIONS

Conclusions
Contribution of UAS in fluvial morpohology• Acquisition of spatially precise data
– Highly accurate DEM for river channel model,
– Monitoring of changes in riverbed and floodplain,
– Analysis of volumetric changes in floodplain,
– Relevant resolution for detailed analyses in fluvial morphology, far beyond the traditional data sources.
• Operability
– Quick acquisition of necessary data for assessment and formodel building,
– Operation according the needs of research plan,
– Acquisition of data in remote and uncovered areas.

Further application in research
• Sediment transport modeling– Coupling the hydrodynamic model
with sediment transport and bank erosion
• Detailed analysis of bed changes – Terrestrial LiDAR– Terrestrial photogrammetry– Start of repeated scanning 2013/09
• In-stream bed load tracking– RFID object tracking– Experiment started 2014/01

Jakub Miřijovský, Jakub Langhammer
THANK YOUFOR YOUR ATTENTION


![mu all 20111204 - KEKR. Roth, J. Langhammer, A. Calci, S. Binder, and P. Navratil, arXiv:1105.3173 [nucl‐th] Excitation spectra of carbon‐12 Excited states: alpha dependence is](https://img.dokumen.tips/doc/110x75/6095485090a06768bd6b8813/mu-all-20111204-kek-r-roth-j-langhammer-a-calci-s-binder-and-p-navratil.jpg)
![Template for high-resolution river landscape …...2017/12/01 · submerged topography [6,25,31,32]. In addition, Miřijovský and Lan-ghammer [26] have described a legislative process](https://img.dokumen.tips/doc/110x75/5f6d5b6a8fd63a12d6243bf3/template-for-high-resolution-river-landscape-20171201-submerged-topography.jpg)


