Embed Size (px)
Citation preview

MinEx Consulting Strategic advice on mineral economics & exploration
The Importance of the Junior Sector
for mineral discovery in NSW Richard Schodde Managing Director, MinEx Consulting Adjunct Professor, University of Western Australia
Keynote presentation to the Exploration in the House 2015 16th June 2015, Sydney
MinEx Consulting Strategic advice on mineral economics & exploration
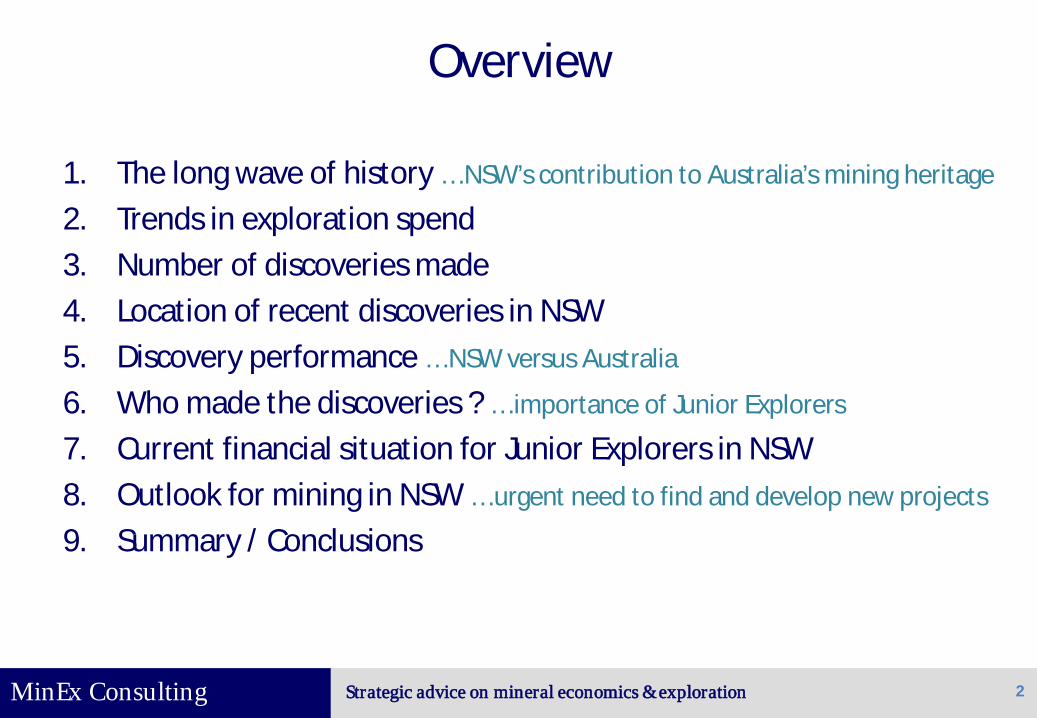
Overview
1. The long wave of history … NSW’s contribution to Australia’s mining heritage
2. Trends in exploration spend 3. Number of discoveries made 4. Location of recent discoveries in NSW 5. Discovery performance … NSW versus Australia
6. Who made the discoveries ? … importance of Junior Explorers
7. Current financial situation for Junior Explorers in NSW 8. Outlook for mining in NSW … urgent need to find and develop new projects
9. Summary / Conclusions
2
MinEx Consulting Strategic advice on mineral economics & exploration
1. THE LONG WAVE OF HISTORY Over the last 160 years Australia has gone through several waves of discovery
3
MinEx Consulting Strategic advice on mineral economics & exploration
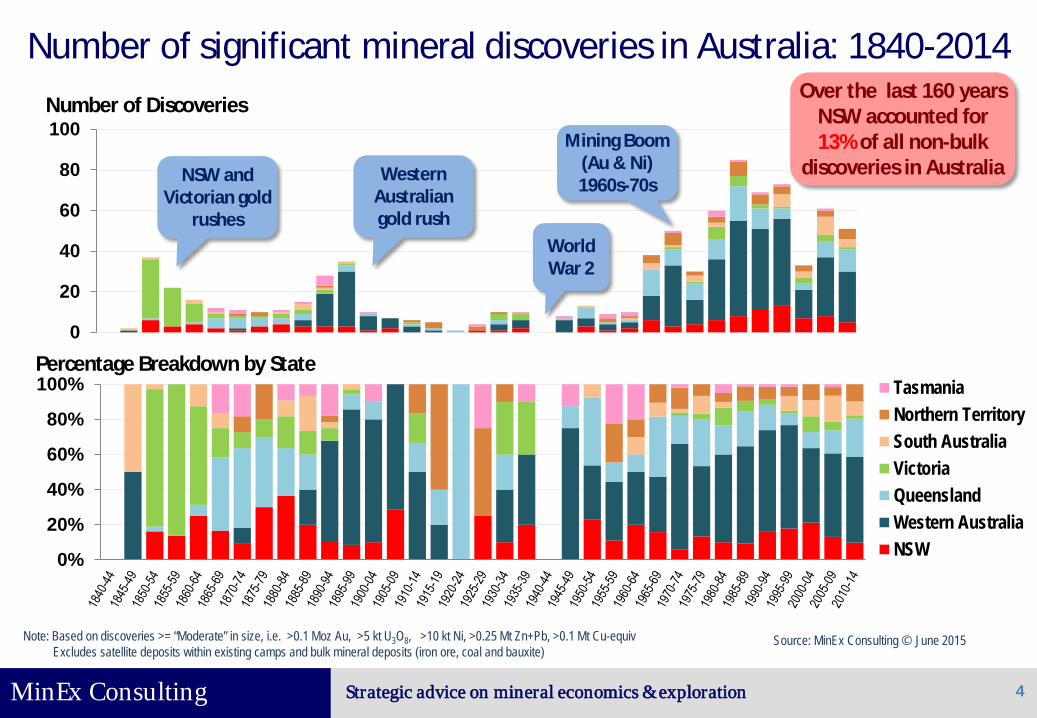
Number of significant mineral discoveries in Australia: 1840-2014
0
20
40
60
80
100
4
0%
20%
40%
60%
80%
100% TasmaniaNorthern TerritorySouth AustraliaVictoriaQueenslandWestern AustraliaNSW
NSW and Victorian gold
rushes
Western Australian gold rush
World War 2
Mining Boom (Au & Ni) 1960s-70s
Number of Discoveries
Percentage Breakdown by State
Note: Based on discoveries >= “Moderate” in size, i.e. >0.1 Moz Au, >5 kt U3O8, >10 kt Ni, >0.25 Mt Zn+Pb, >0.1 Mt Cu-equiv Excludes satellite deposits within existing camps and bulk mineral deposits (iron ore, coal and bauxite)
Source: MinEx Consulting © June 2015
Over the last 160 years NSW accounted for 13% of all non-bulk
discoveries in Australia
MinEx Consulting Strategic advice on mineral economics & exploration
2. TRENDS IN EXPLORATION SPEND Exploration expenditures in Australia reached an all-time high in 2012
5
MinEx Consulting Strategic advice on mineral economics & exploration
$0
$1,000
$2,000
$3,000
$4,000
$5,000
Mar-90 Mar-95 Mar-00 Mar-05 Mar-10 Mar-15
Other - BulkCoalIron OreOther - Non BulkDiamondsUraniumBase MetalsGold
6
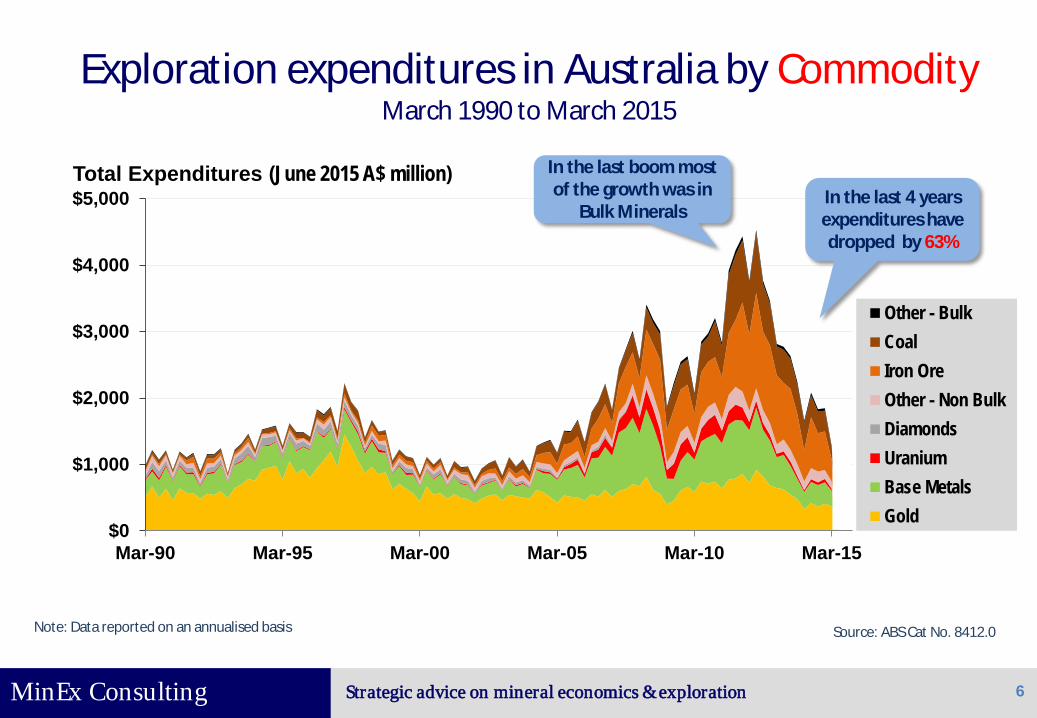
Source: ABS Cat No. 8412.0 Note: Data reported on an annualised basis
Total Expenditures (June 2015 A$ million) In the last boom most of the growth was in
Bulk Minerals
Exploration expenditures in Australia by Commodity March 1990 to March 2015
In the last 4 years expenditures have dropped by 63%
MinEx Consulting Strategic advice on mineral economics & exploration
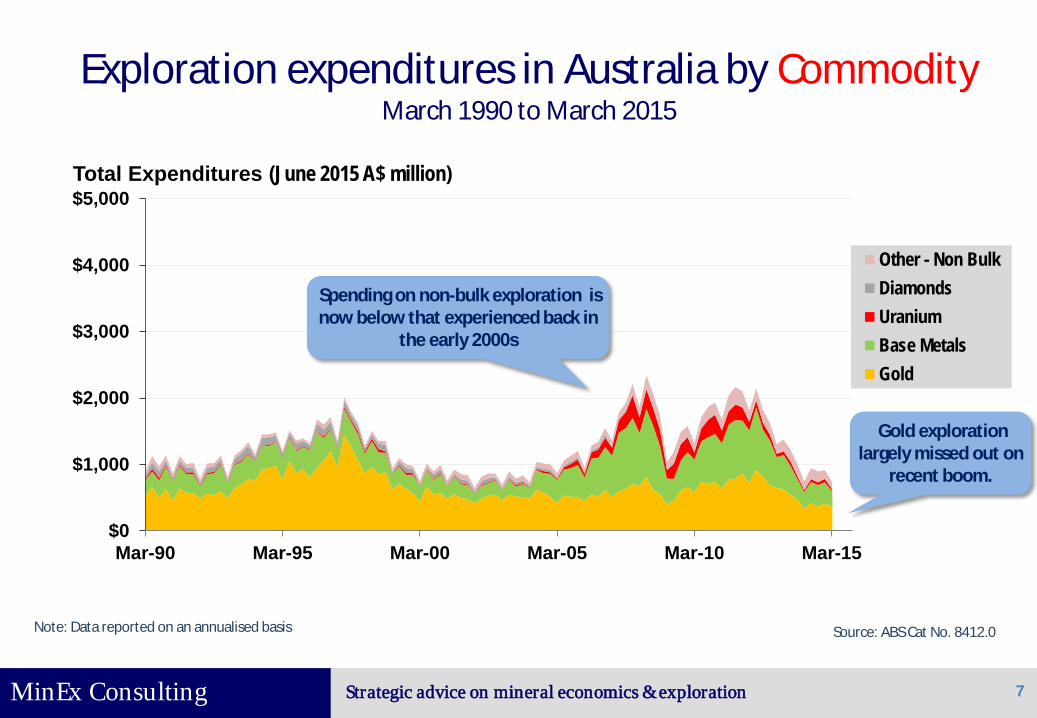
$0
$1,000
$2,000
$3,000
$4,000
$5,000
Mar-90 Mar-95 Mar-00 Mar-05 Mar-10 Mar-15
Other - Non BulkDiamondsUraniumBase MetalsGold
7
Source: ABS Cat No. 8412.0 Note: Data reported on an annualised basis
Total Expenditures (June 2015 A$ million)
Exploration expenditures in Australia by Commodity March 1990 to March 2015
Spending on non-bulk exploration is now below that experienced back in
the early 2000s
Gold exploration largely missed out on
recent boom.
MinEx Consulting Strategic advice on mineral economics & exploration
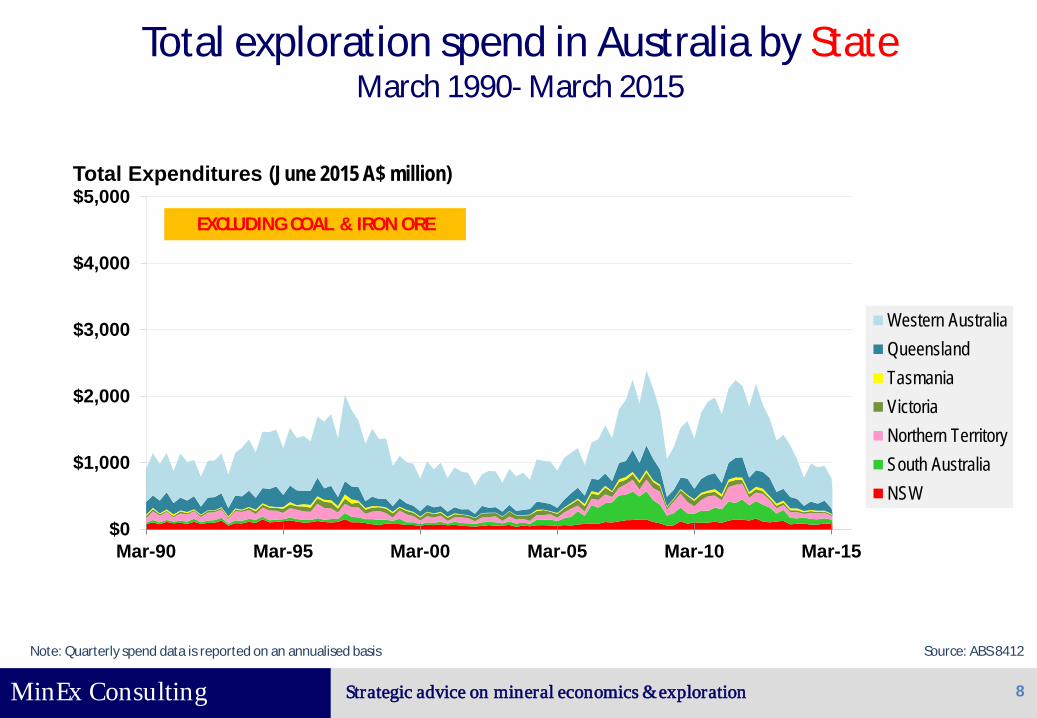
$0
$1,000
$2,000
$3,000
$4,000
$5,000
Mar-90 Mar-95 Mar-00 Mar-05 Mar-10 Mar-15
Western AustraliaQueenslandTasmaniaVictoriaNorthern TerritorySouth AustraliaNSW
8
Source: ABS 8412
Total exploration spend in Australia by State March 1990- March 2015
Note: Quarterly spend data is reported on an annualised basis
Total Expenditures (June 2015 A$ million)
EXCLUDING COAL & IRON ORE
MinEx Consulting Strategic advice on mineral economics & exploration
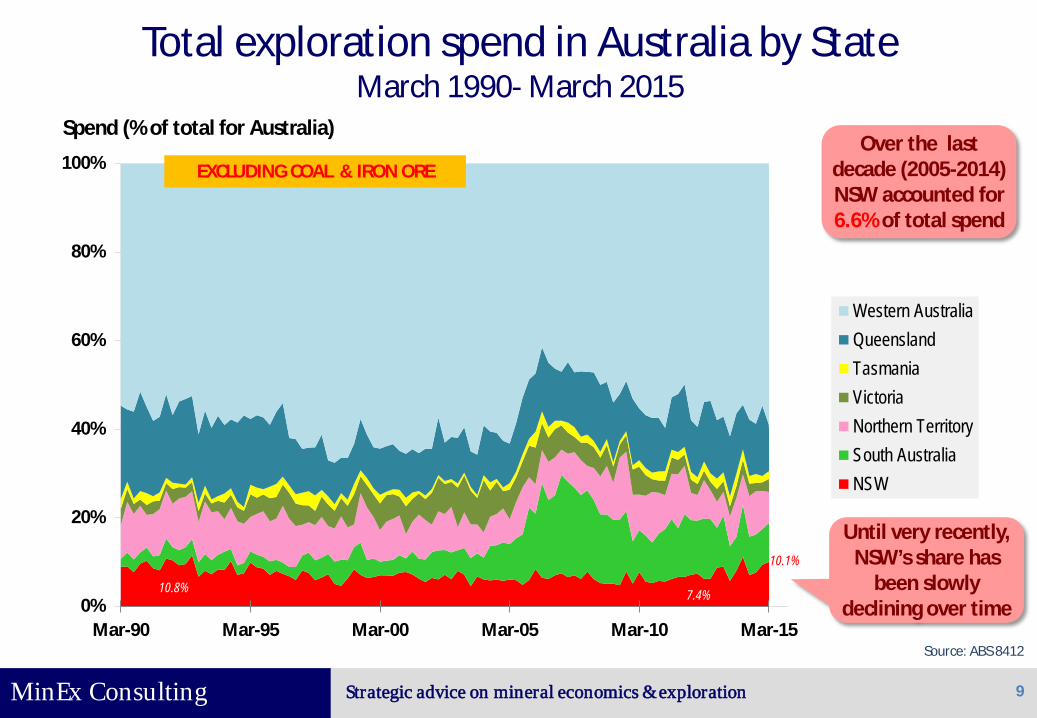
0%
20%
40%
60%
80%
100%
Mar-90 Mar-95 Mar-00 Mar-05 Mar-10 Mar-15
Western AustraliaQueenslandTasmaniaVictoriaNorthern TerritorySouth AustraliaNSW
9
Source: ABS 8412
Total exploration spend in Australia by State March 1990- March 2015
Spend (% of total for Australia)
Until very recently, NSW’s share has
been slowly declining over time
7.4% 10.8%
Over the last decade (2005-2014) NSW accounted for 6.6% of total spend
10.1%
EXCLUDING COAL & IRON ORE
MinEx Consulting Strategic advice on mineral economics & exploration
3. NUMBER OF DISCOVERIES MADE In the last decade NSW accounted for 12% of all discoveries made in Australia
10
MinEx Consulting Strategic advice on mineral economics & exploration
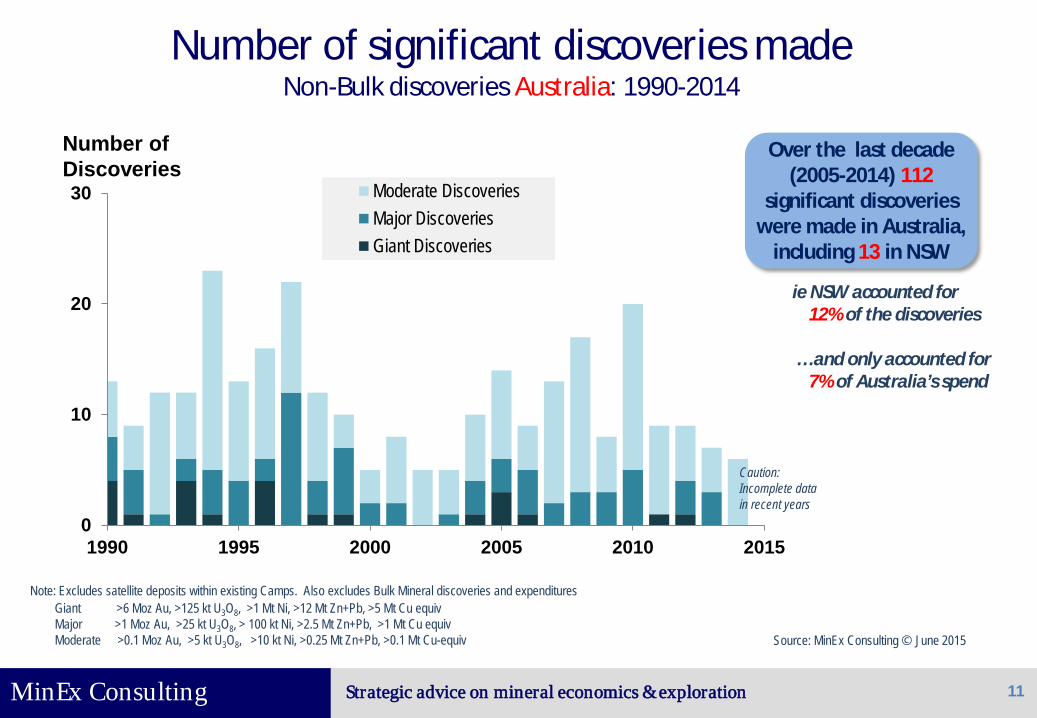
Number of significant discoveries made Non-Bulk discoveries Australia: 1990-2014
0
10
20
30
1990 1995 2000 2005 2010 2015
Moderate DiscoveriesMajor DiscoveriesGiant Discoveries
11
Number of Discoveries
Source: MinEx Consulting © June 2015
Over the last decade (2005-2014) 112
significant discoveries were made in Australia,
including 13 in NSW
ie NSW accounted for 12% of the discoveries … and only accounted for 7% of Australia’s spend
Note: Excludes satellite deposits within existing Camps. Also excludes Bulk Mineral discoveries and expenditures Giant >6 Moz Au, >125 kt U3O8, >1 Mt Ni, >12 Mt Zn+Pb, >5 Mt Cu equiv
Major >1 Moz Au, >25 kt U3O8, > 100 kt Ni, >2.5 Mt Zn+Pb, >1 Mt Cu equiv Moderate >0.1 Moz Au, >5 kt U3O8, >10 kt Ni, >0.25 Mt Zn+Pb, >0.1 Mt Cu-equiv
Caution: Incomplete data in recent years
MinEx Consulting Strategic advice on mineral economics & exploration
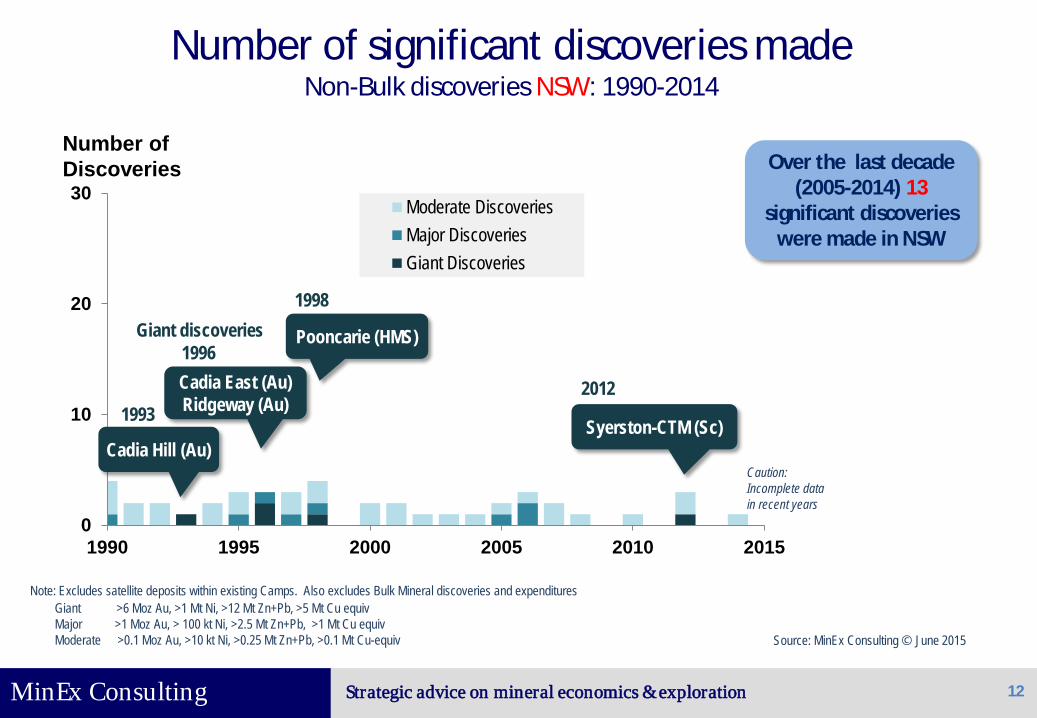
Number of significant discoveries made Non-Bulk discoveries NSW: 1990-2014
0
10
20
30
1990 1995 2000 2005 2010 2015
Moderate DiscoveriesMajor DiscoveriesGiant Discoveries
12
Number of Discoveries
Note: Excludes satellite deposits within existing Camps. Also excludes Bulk Mineral discoveries and expenditures
Source: MinEx Consulting © June 2015
Over the last decade (2005-2014) 13
significant discoveries were made in NSW
Caution: Incomplete data in recent years
Syerston-CTM (Sc) Cadia Hill (Au)
Cadia East (Au) Ridgeway (Au)
Pooncarie (HMS) Giant discoveries
2012
1998
1996
1993
Giant >6 Moz Au, >1 Mt Ni, >12 Mt Zn+Pb, >5 Mt Cu equiv Major >1 Moz Au, > 100 kt Ni, >2.5 Mt Zn+Pb, >1 Mt Cu equiv Moderate >0.1 Moz Au, >10 kt Ni, >0.25 Mt Zn+Pb, >0.1 Mt Cu-equiv
MinEx Consulting Strategic advice on mineral economics & exploration
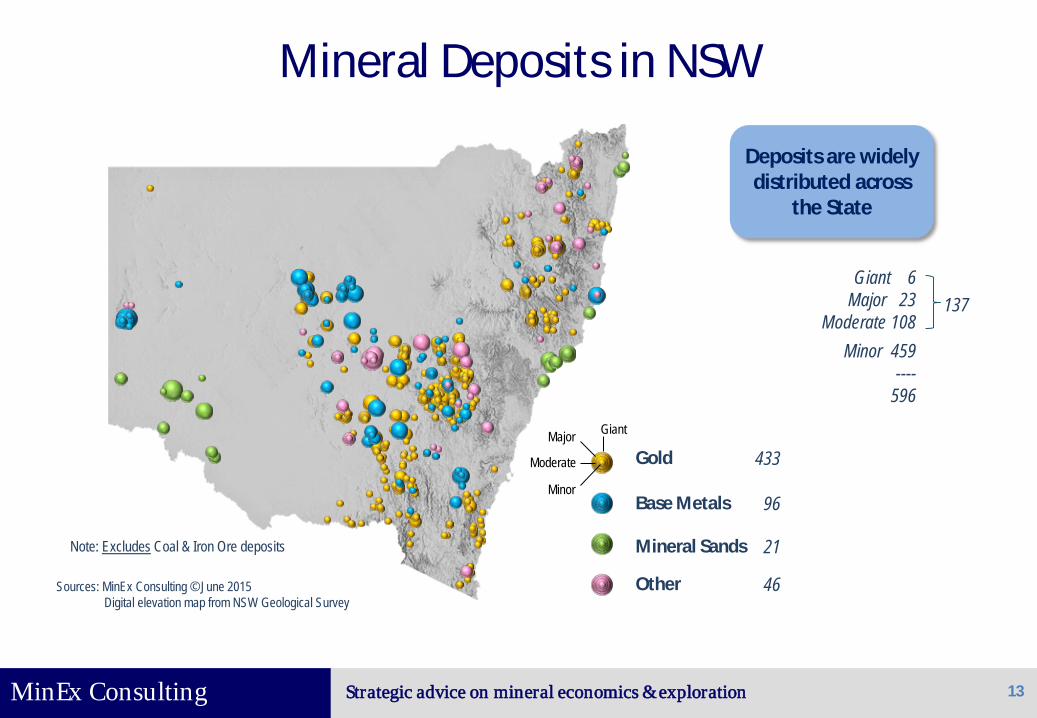
Mineral Deposits in NSW
13
Mineral Sands
Base Metals
Other
Giant Major
Moderate
Minor
Gold
Note: Excludes Coal & Iron Ore deposits Sources: MinEx Consulting © June 2015
Digital elevation map from NSW Geological Survey
Deposits are widely distributed across
the State
433
96
21
46
Giant 6 Major 23
Moderate 108 137
Minor 459 ----
596
MinEx Consulting Strategic advice on mineral economics & exploration
4. LOCATION OF DISCOVERIES IN NSW Over the last decade 13 significant discoveries were made in NSW
14

MinEx Consulting Strategic advice on mineral economics & exploration
Mineral Discoveries in NSW : Since 2005
15
Mineral Sands
Base Metals
Other
Giant Major
Moderate
Minor
Gold
McPhillamys (Au: 2006)
Syerston (Sc : 2012) Atlas-Campaspe
(HMS: 2005)
Note: Excludes Coal & Iron Ore deposits Names & dates refer to “Major” & “Giant” discoveries Sources: MinEx Consulting © June 2015
Digital elevation map from NSW Geological Survey
Collerina (Ni: 2006)
With 5 discoveries being made in since 2010
• 2010 Sorpresa [Au-Ag] Moderate • 2012 Mallee Bull [Cu-Ag-Au-Zn] Moderate • 2012 Syerston - Jervois [Sc] Moderate • 2012 Syerston - CTM [Sc] Giant • 2014 Commonwealth [Au-Zn-Pb] Moderate
Kingsgate (Mo)
Yiddah (Cu)
Culingerai (Cu)
West Balranald Extension (HMS)
Mt Carrington (Ag)
Commonwealth (Au)
Sorpresa (Au) Mallee Bull (Cu)
13 significant discoveries made in
the last decade

MinEx Consulting Strategic advice on mineral economics & exploration
5. DISCOVERY PERFORMANCE
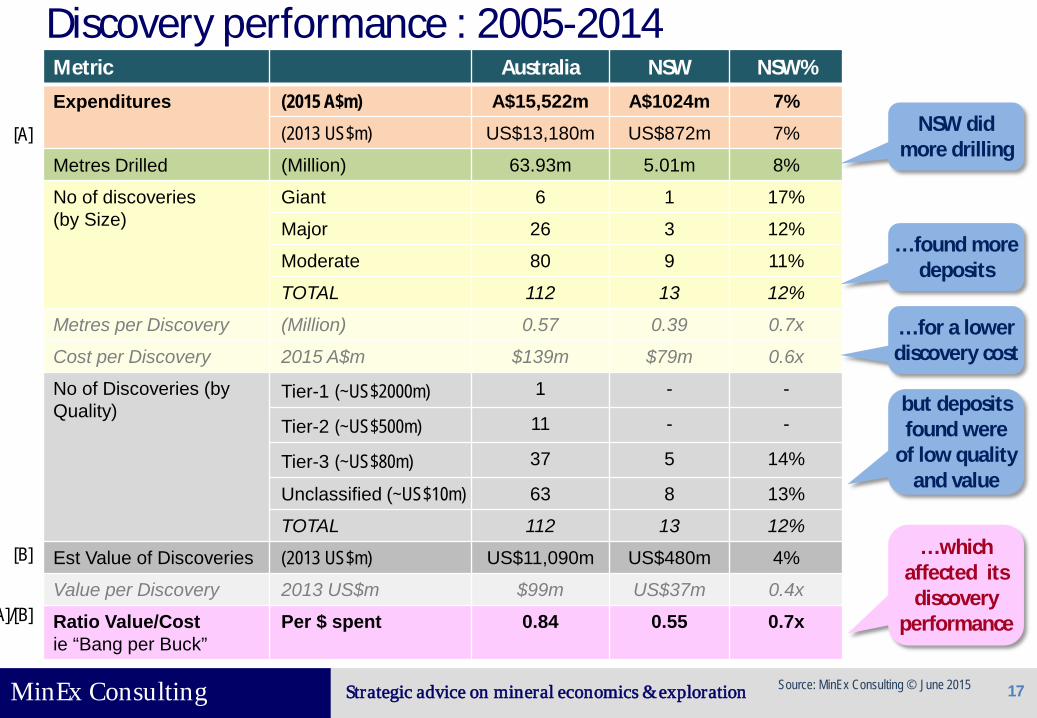
In terms of dollars spent, NSW has found more deposits than the National average. However most of these discoveries were of low value
16
MinEx Consulting Strategic advice on mineral economics & exploration
Discovery performance : 2005-2014 Metric Australia NSW NSW% Expenditures (2015 A$m) A$15,522m A$1024m 7%
(2013 US$m) US$13,180m US$872m 7%
Metres Drilled (Million) 63.93m 5.01m 8%
No of discoveries (by Size)
Giant 6 1 17%
Major 26 3 12%
Moderate 80 9 11%
TOTAL 112 13 12%
Metres per Discovery (Million) 0.57 0.39 0.7x
Cost per Discovery 2015 A$m $139m $79m 0.6x
No of Discoveries (by Quality)
Tier-1 (~US$2000m) 1 - -
Tier-2 (~US$500m) 11 - -
Tier-3 (~US$80m) 37 5 14%
Unclassified (~US$10m) 63 8 13%
TOTAL 112 13 12%
Est Value of Discoveries (2013 US$m) US$11,090m US$480m 4%
Value per Discovery 2013 US$m $99m US$37m 0.4x
Ratio Value/Cost ie “Bang per Buck”
Per $ spent 0.84 0.55 0.7x
17
[A]
[B]
A]/[B]
NSW did more drilling
… found more deposits
… for a lower discovery cost
but deposits found were
of low quality and value
… which affected its
discovery performance
Source: MinEx Consulting © June 2015

MinEx Consulting Strategic advice on mineral economics & exploration
Expenditures versus drilling activity Exploration expenditures and metres drilled non-bulk discoveries NSW: 2000-2014
0.0
0.2
0.4
0.6
0.8
1.0
$0
$25
$50
$75
$100
$125
$150
2000 2005 2010
Expenditures - Non-BulkMillion Metres Drilled - TotalMillion Metres Drilled - Greenfield
18
Note: Excludes expenditures and drilling on coal and iron ore
Million Metres Drilled
Drilling activity (especially
greenfield drilling) has not kept pace with exploration
expenditures
2015 A$ Million
0.11 0.02
0.74
0.43
$129m
$79m
Sources: NSW Geological Survey March 2015 ABS 8412
0.09
0.30

MinEx Consulting Strategic advice on mineral economics & exploration
Discoveries versus Drilling Drilling activity and non-bulk discoveries Australia: 1985-2014
0
5
10
15
0
5
10
15
20
25
1990 2000 2010
Moderate DepositsMajor DepositsGiant DepositsMetres Drilled (rhs)
19
Note: Excludes bulk mineral discoveries (ie coal and iron ore) “Moderate” >100koz Au, >10kt Ni, >100Kt Cu equiv, 250kt Zn+Pb, >5kt U3O8 “Major” >1Moz Au, >100kt Ni, >1Mt Cu equiv, 2.5Mt Zn+Pb, >25kt U3O8 “Giant” >6Moz Au, >1Mt Ni, >5Mt Cu equiv, 12Mt Zn+Pb, >125kt U3O8
Sources: MinEx Consulting © June 2015 and ABS 8412
No of Discoveries Metres Drilled (Million)
Caution: Incomplete data in recent years
Good correlation between drilling and number of
deposits found
“if you don’t drill you won’t discover”

MinEx Consulting Strategic advice on mineral economics & exploration
Number of discoveries made versus metres drilled Metres drilled versus non-bulk discoveries NSW: 2000-2014
0.0
0.2
0.4
0.6
0.8
1.0
0
1
2
3
4
5
2000 2005 2010 2015
Moderate DiscoveriesMajor DiscoveriesGiant DiscoveriesMillion Metres Drilled - TotalMillion Metres Drilled - Greenfield
20
Note: Excludes satellite deposits within existing Camps. Also excludes Bulk Mineral discoveries and expenditures
Sources: NSW Geological Survey March 2015 MinEx Consulting © June 2015
Caution: Incomplete data in recent years
Giant >6 Moz Au, >1 Mt Ni, >12 Mt Zn+Pb, >5 Mt Cu equiv Major >1 Moz Au, > 100 kt Ni, >2.5 Mt Zn+Pb, >1 Mt Cu equiv Moderate >0.1 Moz Au, >10 kt Ni, >0.25 Mt Zn+Pb, >0.1 Mt Cu-equiv
Million Metres Drilled
Over the last decade (2005-2014) 5.0 million metres
was drilled (in 68,219 holes) for 13 discoveries
ie 385,000 metres or 5250 holes per discovery
Number of Discoveries
NSW’s discovery data is “noisy” because very few deposits are
found each year
MinEx Consulting Strategic advice on mineral economics & exploration
6. WHO MADE THE DISCOVERIES ? Over the last decade 80% of all discoveries in NSW were made by Junior Explorers
21
MinEx Consulting Strategic advice on mineral economics & exploration
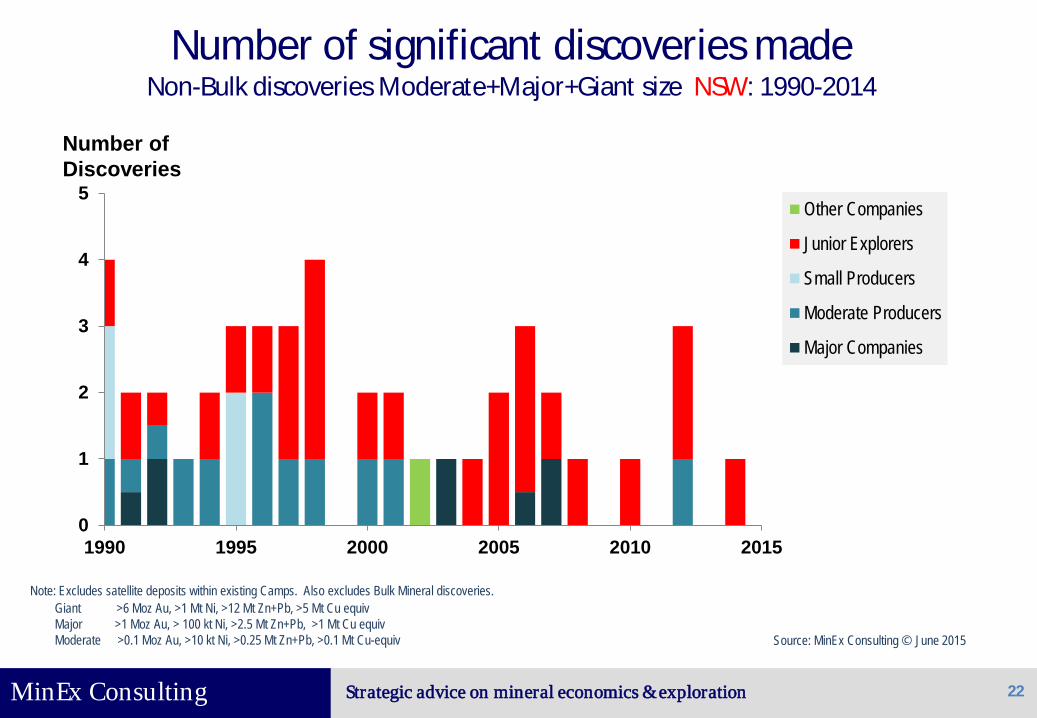
Number of significant discoveries made Non-Bulk discoveries Moderate+Major+Giant size NSW: 1990-2014
0
1
2
3
4
5
1990 1995 2000 2005 2010 2015
Other Companies
Junior Explorers
Small Producers
Moderate Producers
Major Companies
22
Number of Discoveries
Note: Excludes satellite deposits within existing Camps. Also excludes Bulk Mineral discoveries.
Source: MinEx Consulting © June 2015
Giant >6 Moz Au, >1 Mt Ni, >12 Mt Zn+Pb, >5 Mt Cu equiv Major >1 Moz Au, > 100 kt Ni, >2.5 Mt Zn+Pb, >1 Mt Cu equiv Moderate >0.1 Moz Au, >10 kt Ni, >0.25 Mt Zn+Pb, >0.1 Mt Cu-equiv
MinEx Consulting Strategic advice on mineral economics & exploration
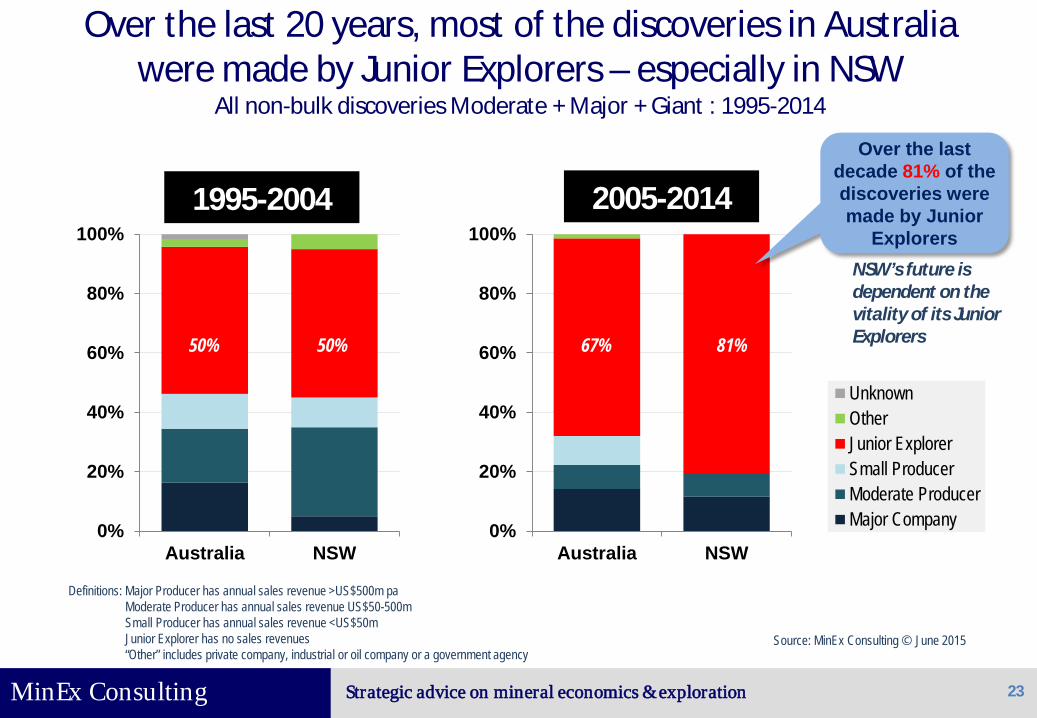
Over the last 20 years, most of the discoveries in Australia were made by Junior Explorers – especially in NSW
All non-bulk discoveries Moderate + Major + Giant : 1995-2014
2005-2014
0%
20%
40%
60%
80%
100%
Australia NSW
UnknownOtherJunior ExplorerSmall ProducerModerate ProducerMajor Company
23
0%
20%
40%
60%
80%
100%
Australia NSW
1995-2004
81% 67% 50% 50%
Source: MinEx Consulting © June 2015
Definitions: Major Producer has annual sales revenue >US$500m pa Moderate Producer has annual sales revenue US$50-500m Small Producer has annual sales revenue <US$50m Junior Explorer has no sales revenues “Other” includes private company, industrial or oil company or a government agency
Over the last decade 81% of the discoveries were made by Junior
Explorers NSW’s future is dependent on the vitality of its Junior Explorers
MinEx Consulting Strategic advice on mineral economics & exploration
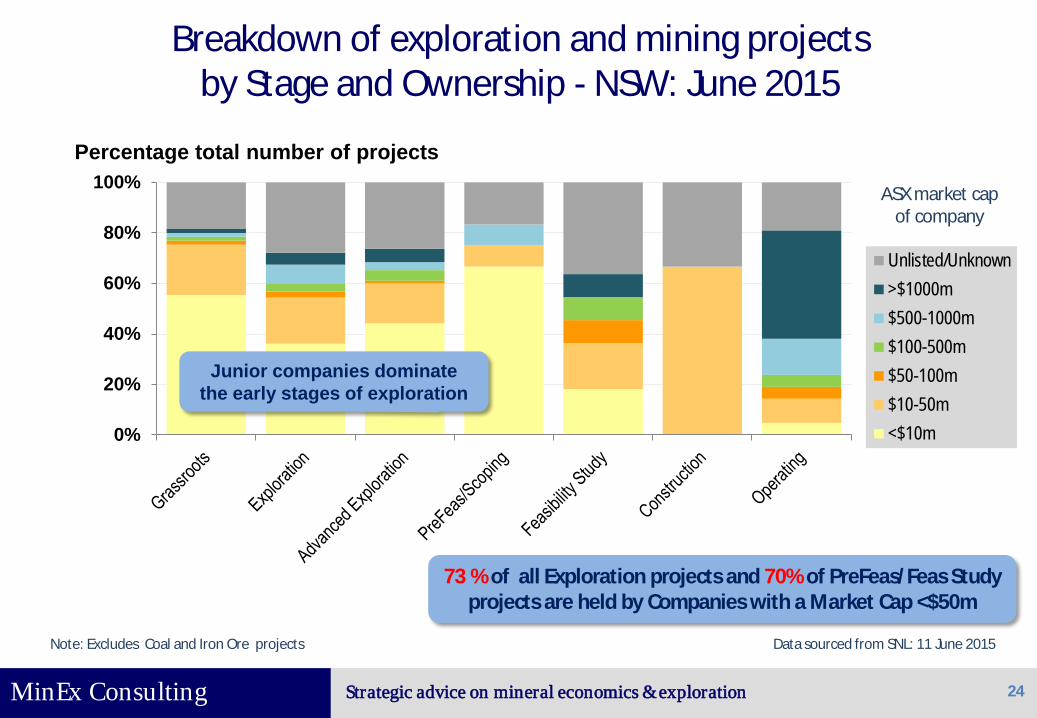
Breakdown of exploration and mining projects by Stage and Ownership - NSW: June 2015
0%
20%
40%
60%
80%
100%
Unlisted/Unknown>$1000m$500-1000m$100-500m$50-100m$10-50m<$10m
24
Percentage total number of projects
ASX market cap of company
Data sourced from SNL: 11 June 2015 Note: Excludes Coal and Iron Ore projects
Junior companies dominate the early stages of exploration
73 % of all Exploration projects and 70% of PreFeas/Feas Study projects are held by Companies with a Market Cap <$50m
MinEx Consulting Strategic advice on mineral economics & exploration
7. CURRENT FINANCIAL SITUATION FOR JUNIOR EXPLORERS IN NSW
Junior companies are doing it “tough”
25
MinEx Consulting Strategic advice on mineral economics & exploration
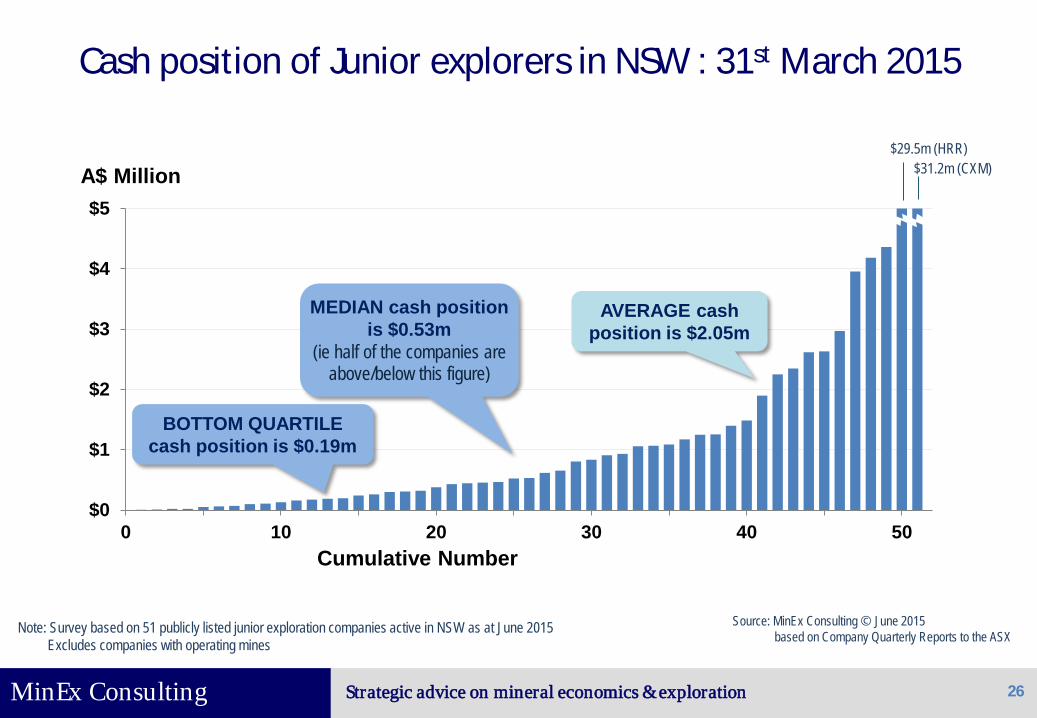
Cash position of Junior explorers in NSW : 31st March 2015
$0
$1
$2
$3
$4
$5
0 10 20 30 40 50
26
A$ Million $29.5m (HRR)
MEDIAN cash position is $0.53m
(ie half of the companies are above/below this figure)
AVERAGE cash position is $2.05m
Cumulative Number
BOTTOM QUARTILE cash position is $0.19m
$31.2m (CXM)
Note: Survey based on 51 publicly listed junior exploration companies active in NSW as at June 2015 Excludes companies with operating mines
Source: MinEx Consulting © June 2015 based on Company Quarterly Reports to the ASX
MinEx Consulting Strategic advice on mineral economics & exploration
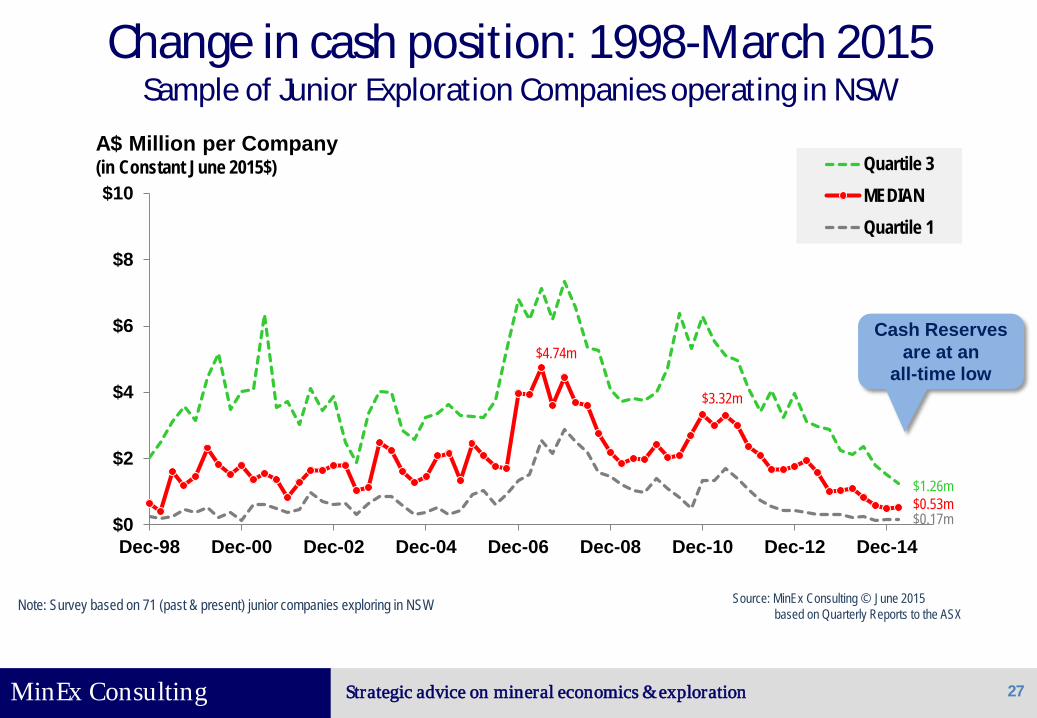
Change in cash position: 1998-March 2015 Sample of Junior Exploration Companies operating in NSW
$0
$2
$4
$6
$8
$10
Dec-98 Dec-00 Dec-02 Dec-04 Dec-06 Dec-08 Dec-10 Dec-12 Dec-14
Quartile 3MEDIANQuartile 1
27
Note: Survey based on 71 (past & present) junior companies exploring in NSW
A$ Million per Company (in Constant June 2015$)
$0.53m $1.26m
$0.17m
Cash Reserves are at an
all-time low $4.74m
$3.32m
Source: MinEx Consulting © June 2015 based on Quarterly Reports to the ASX

MinEx Consulting Strategic advice on mineral economics & exploration
Cash burn rate for NSW Junior Explorers Annualised operating expenditures divided by cash reserves
0
1
2
3
4
5
6
Dec-98 Dec-00 Dec-02 Dec-04 Dec-06 Dec-08 Dec-10 Dec-12 Dec-14
Quartile 3MEDIANQuartile 1
28
Note: Survey based on 71 (past & present) junior companies exploring in NSW.
Years
0.61 Years
1.76 Years
0.28 years
2.18
Source: MinEx Consulting © June 2015 based on Quarterly Reports to the ASX
The Median Cash Burn Rate is normally around 1-2 years
2.97
Currently only have 7 months of
cash reserves

MinEx Consulting Strategic advice on mineral economics & exploration
Cash Reserves and Expenditures for the MEDIAN Junior Exploration Company in NSW : 1998-March 2015
-$2
-$1
$0
$1
$2
$3
$4
$5
Dec-98 Dec-00 Dec-02 Dec-04 Dec-06 Dec-08 Dec-10 Dec-12 Dec-14
29
June 2015 A$ Million pa
Note: Survey based on 71 (past & present) junior companies exploring in NSW. “Net Other” includes production and other costs less interest income, mine revenue, Government Assistance and R&D tax credits Quarterly spend data has been multiplied by 4x to produce an annualised spend rate
Cash Reserves
Exploration & Development
Administration
Net Other
Source: MinEx Consulting © June 2015 based on Quarterly Reports to the ASX
During a downturn, “in-field” exploration &
development expenditures are cut the most
Admin costs tend
to be “fixed”
Cash Reserves are at an
all-time low

MinEx Consulting Strategic advice on mineral economics & exploration
$0
$5
$10
$15
$20
$25
$30
$35
$40
$0 $10 $20 $30 $40 $50
The lack of cash is of most concern to those junior companies with low market caps
30
Cash Reserves (A$ Million) as at 30 March 2015
Market Cap (A$ Million) as at 11 June 2015
Companies can raise cash by issuing new shares ... but that’s difficult if the market cap is low
Note: Survey based on 47 publicly listed junior exploration companies active in NSW as June 2015. Excludes 4 companies currently suspended from trading. Excludes companies with operating mines.
Source: MinEx Consulting © June 2015 based on Company Quarterly Reports to the ASX
Most of NSW’s Junior Explorers
have a market cap <$15m
~20% of Junior Explorers in NSW have a market Cap <$2m and have <$1m in cash reserves
MinEx Consulting Strategic advice on mineral economics & exploration 31
…. But junior explorers are incredibly resilient and most will survive
“Junior companies are like cockroaches … they can both survive a nuclear winter !” Source: Canadian Mining Industry spokesperson (who wishes to remain anonymous) March 2014
MinEx Consulting Strategic advice on mineral economics & exploration
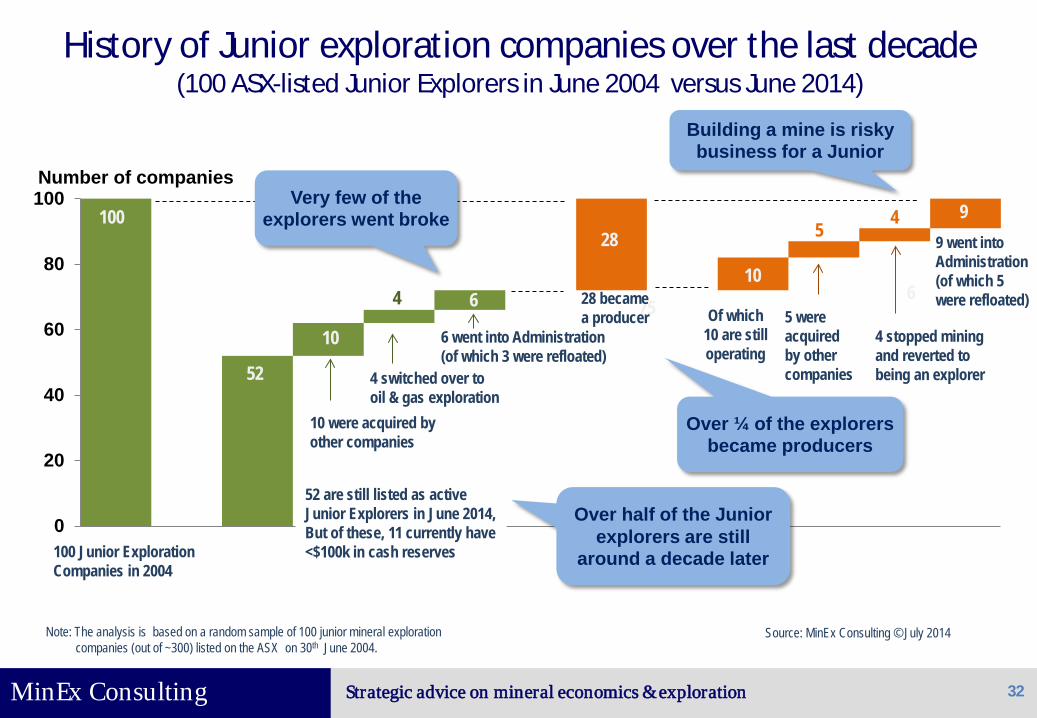
History of Junior exploration companies over the last decade (100 ASX-listed Junior Explorers in June 2004 versus June 2014)
0
20
40
60
80
100
32
100 Junior Exploration Companies in 2004
100
52
10 75
28
10 6
9
Note: The analysis is based on a random sample of 100 junior mineral exploration companies (out of ~300) listed on the ASX on 30th June 2004.
Source: MinEx Consulting © July 2014
52 are still listed as active Junior Explorers in June 2014, But of these, 11 currently have <$100k in cash reserves
4 switched over to oil & gas exploration
6 went into Administration (of which 3 were refloated)
4 28 became a producer Of which
10 are still operating
5 were acquired by other companies
9 went into Administration (of which 5 were refloated)
10 were acquired by other companies
Over half of the Junior explorers are still
around a decade later
Very few of the explorers went broke
Over ¼ of the explorers became producers
Building a mine is risky business for a Junior
6
5 4
4 stopped mining and reverted to being an explorer
Number of companies
MinEx Consulting Strategic advice on mineral economics & exploration
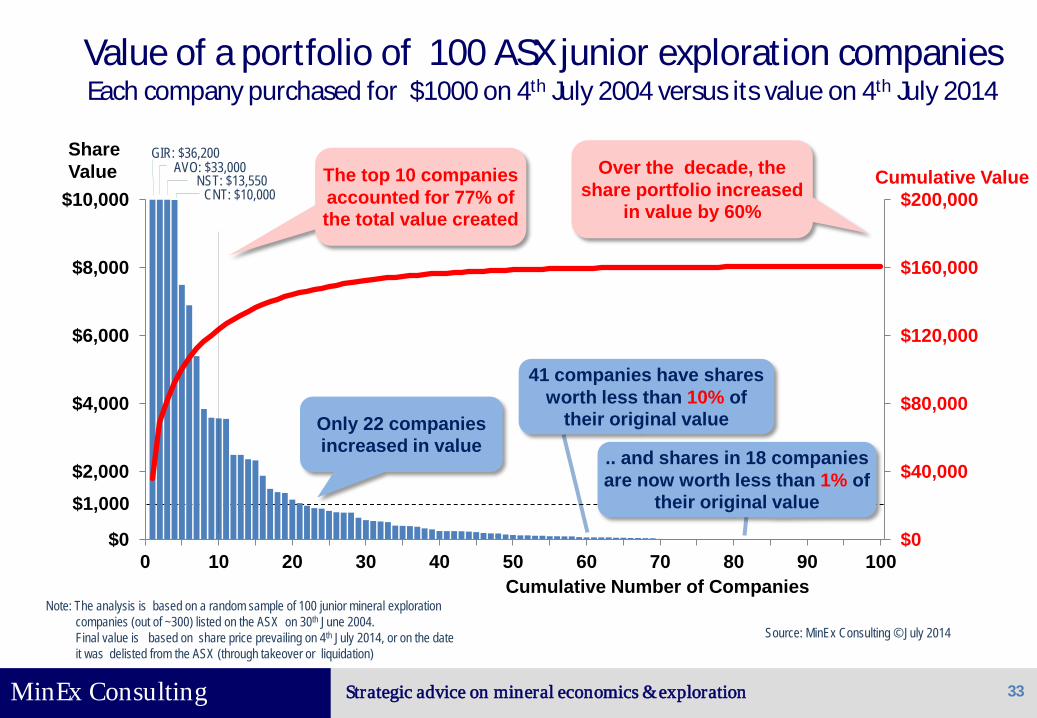
Value of a portfolio of 100 ASX junior exploration companies Each company purchased for $1000 on 4th July 2004 versus its value on 4th July 2014
$0
$40,000
$80,000
$120,000
$160,000
$200,000
$0
$2,000
$4,000
$6,000
$8,000
$10,000
0 10 20 30 40 50 60 70 80 90 100
33
GIR: $36,200 AVO: $33,000
NST: $13,550 CNT: $10,000
Share Value
Cumulative Number of Companies
Source: MinEx Consulting © July 2014
Cumulative Value
Only 22 companies increased in value
$1,000
The top 10 companies accounted for 77% of the total value created
41 companies have shares worth less than 10% of
their original value
.. and shares in 18 companies are now worth less than 1% of
their original value
Note: The analysis is based on a random sample of 100 junior mineral exploration companies (out of ~300) listed on the ASX on 30th June 2004. Final value is based on share price prevailing on 4th July 2014, or on the date it was delisted from the ASX (through takeover or liquidation)
Over the decade, the share portfolio increased
in value by 60%

MinEx Consulting Strategic advice on mineral economics & exploration
8. OUTLOOK FOR MINING IN NSW
For the industry to be sustainable it needs to urgently find and develop new mines
34

MinEx Consulting Strategic advice on mineral economics & exploration
Number of mines operating in NSW: 1990-2040 for operations mining >100 ktpa of ore
35
Note: Limited to operations mining >100ktpa of ore. The forecast figures are based on dividing the current reported Reserves and Resources by the production rate in 2014. Excludes coal and iron ore mines
Source: Estimates by MinEx Consulting © June 2015, based on latest published Reserves & Resources
Number of Mines
Historical Forecast
11
15 16
8
2
8
1 2
In terms of current Reserves, half of NSW’s mines will close by 2020 (ie 5 years time). In terms of current
Resources, half will close by 2028 (ie 13 years time)
The challenge is that it typically takes 10-15 years to turn a new discovery into a mine … to avoid a hiatus in production we need to explore now !
0
5
10
15
20
1990 1995 2000 2005 2010 2015 2020 2025 2030 2035 2040
Forecast (Based on current Resources)Forecast (Based on current Reserves)Historical
MinEx Consulting Strategic advice on mineral economics & exploration
8. SUMMARY / CONCLUSIONS
There is an urgent need to find and develop new mines to replace those closing down. The Junior Explorers have a key role to play in this
36
MinEx Consulting Strategic advice on mineral economics & exploration
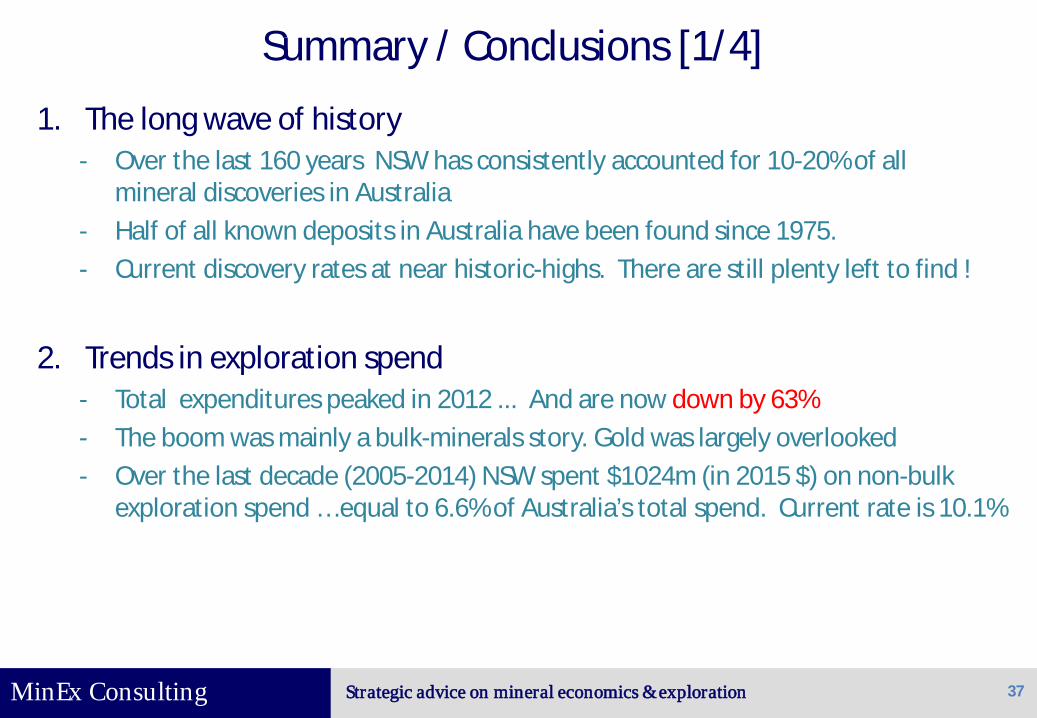
Summary / Conclusions [1/4]
1. The long wave of history - Over the last 160 years NSW has consistently accounted for 10-20% of all
mineral discoveries in Australia - Half of all known deposits in Australia have been found since 1975. - Current discovery rates at near historic-highs. There are still plenty left to find !
2. Trends in exploration spend
- Total expenditures peaked in 2012 ... And are now down by 63% - The boom was mainly a bulk-minerals story. Gold was largely overlooked - Over the last decade (2005-2014) NSW spent $1024m (in 2015 $) on non-bulk
exploration spend … equal to 6.6% of Australia’s total spend. Current rate is 10.1%
37
MinEx Consulting Strategic advice on mineral economics & exploration
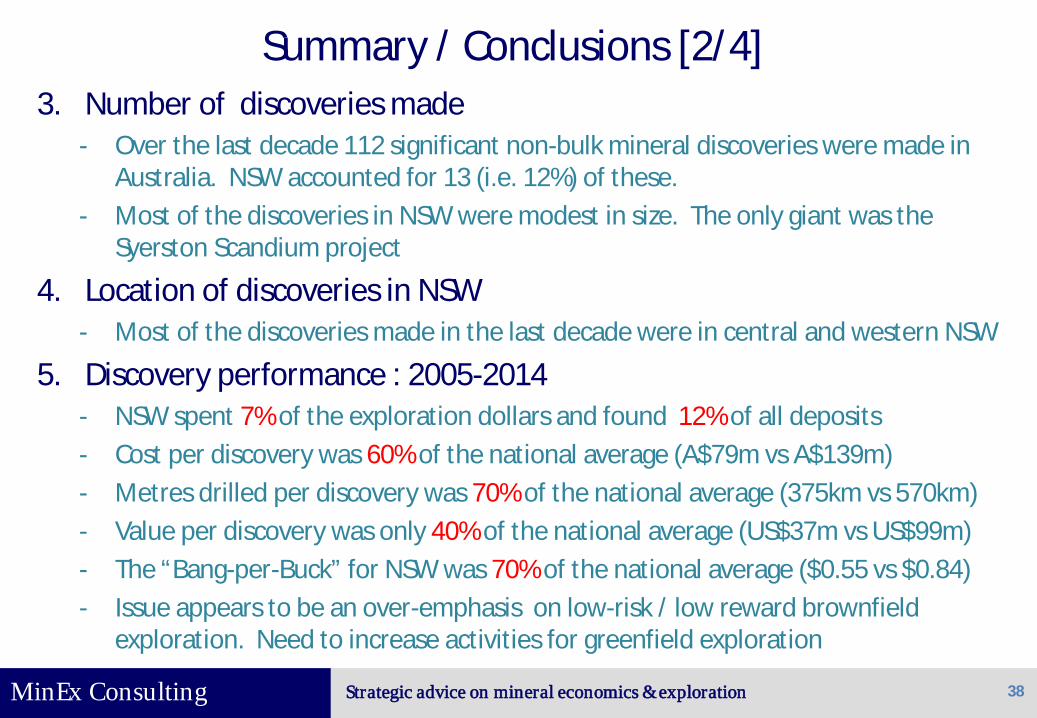
Summary / Conclusions [2/4] 3. Number of discoveries made
- Over the last decade 112 significant non-bulk mineral discoveries were made in Australia. NSW accounted for 13 (i.e. 12%) of these.
- Most of the discoveries in NSW were modest in size. The only giant was the Syerston Scandium project
4. Location of discoveries in NSW - Most of the discoveries made in the last decade were in central and western NSW
5. Discovery performance : 2005-2014 - NSW spent 7% of the exploration dollars and found 12% of all deposits - Cost per discovery was 60% of the national average (A$79m vs A$139m) - Metres drilled per discovery was 70% of the national average (375km vs 570km) - Value per discovery was only 40% of the national average (US$37m vs US$99m) - The “Bang-per-Buck” for NSW was 70% of the national average ($0.55 vs $0.84) - Issue appears to be an over-emphasis on low-risk / low reward brownfield
exploration. Need to increase activities for greenfield exploration
38
MinEx Consulting Strategic advice on mineral economics & exploration
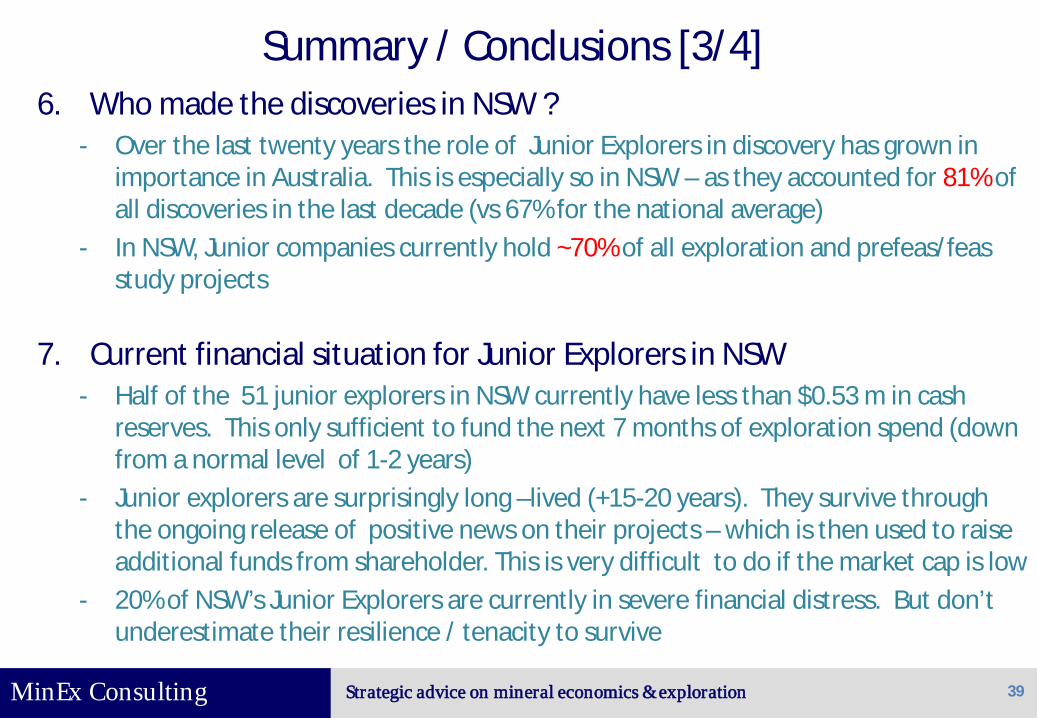
Summary / Conclusions [3/4] 6. Who made the discoveries in NSW ?
- Over the last twenty years the role of Junior Explorers in discovery has grown in importance in Australia. This is especially so in NSW – as they accounted for 81% of all discoveries in the last decade (vs 67% for the national average)
- In NSW, Junior companies currently hold ~70% of all exploration and prefeas/feas study projects
7. Current financial situation for Junior Explorers in NSW - Half of the 51 junior explorers in NSW currently have less than $0.53 m in cash
reserves. This only sufficient to fund the next 7 months of exploration spend (down from a normal level of 1-2 years)
- Junior explorers are surprisingly long –lived (+15-20 years). They survive through the ongoing release of positive news on their projects – which is then used to raise additional funds from shareholder. This is very difficult to do if the market cap is low
- 20% of NSW’s Junior Explorers are currently in severe financial distress. But don’t underestimate their resilience / tenacity to survive
39
MinEx Consulting Strategic advice on mineral economics & exploration
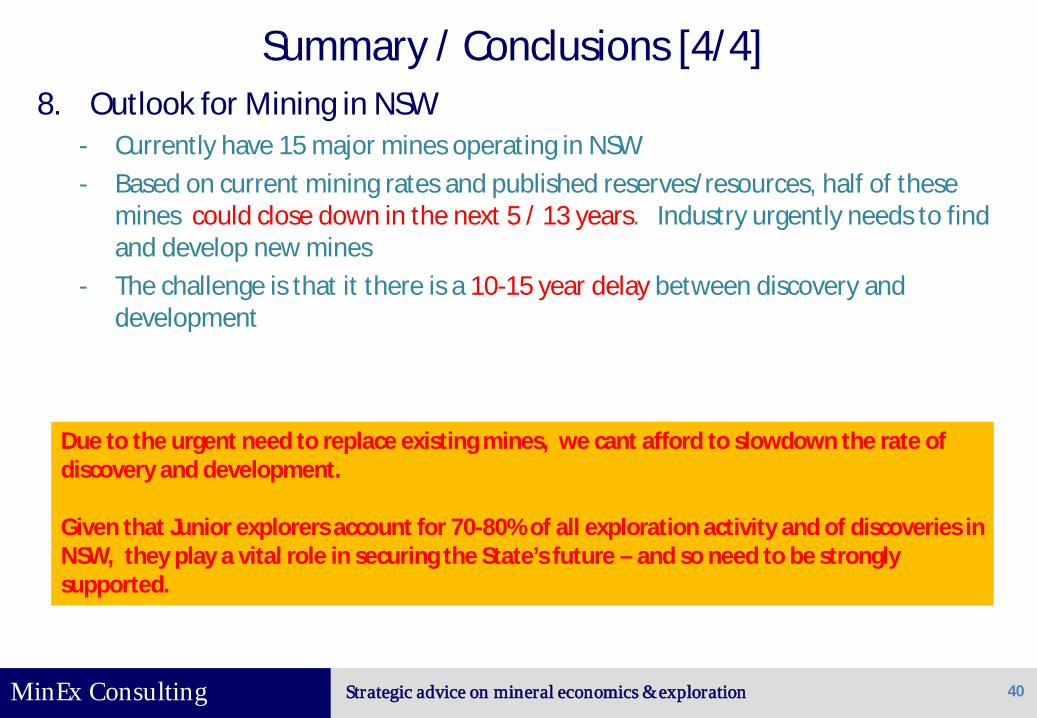
Summary / Conclusions [4/4] 8. Outlook for Mining in NSW
- Currently have 15 major mines operating in NSW - Based on current mining rates and published reserves/resources, half of these
mines could close down in the next 5 / 13 years. Industry urgently needs to find and develop new mines
- The challenge is that it there is a 10-15 year delay between discovery and development
40
Due to the urgent need to replace existing mines, we cant afford to slowdown the rate of discovery and development. Given that Junior explorers account for 70-80% of all exploration activity and of discoveries in NSW, they play a vital role in securing the State’s future – and so need to be strongly supported.
MinEx Consulting Strategic advice on mineral economics & exploration 41
Contact details Richard Schodde Managing Director MinEx Consulting Melbourne, Australia Email: [email protected] Website: MinExConsulting.com
Copies of this and other similar presentations can be downloaded from
my website