Embed Size (px)
Citation preview
IOSR Journal of Applied Physics (IOSR-JAP)
e-ISSN: 2278-4861. Volume 4, Issue 2 (Jul. - Aug. 2013), PP 06-24 www.iosrjournals.org
www.iosrjournals.org 6 | Page
Discovery of Self-Sustained 235
U Fission Causing Sunlight by
Padmanabha Rao Effect
M.A. Padmanabha Rao, PhD (AIIMS) Former Professor of Medical Physics, 114 Charak Sadan, Vikas Puri, New Delhi 110018, India,
Abstract : For the first time in solar physics, this paper reports a comprehensive study how 235Uranium fission
causes Sunlight by the atomic phenomenon, Padmanabha Rao Effect against the theory of fusion. The first major
breakthrough lies in identifying as many as 153 solar lines in the Bharat Radiation range from 12.87 to 31 nm
reported by various researchers since 1960s. The Sunlight phenomenon is explained as follows. For example, the
energy equivalence 72.48 eV of the most intense 17.107 nm emission in the middle of solar spectrum is the energy
lost by β, γ, or X-ray energy of a fission product while passing through core-Coulomb space. This energy loss is the
Bharat Radiation energy that cause EUV, UV, visible, and near infrared emissions on valence excitation. From vast
data of emissions and energies of various fission products, 606.31 keV β (Eβmax) energy of 131I was chosen as the
source of 17.107 nm emission. For the first time a typical Bharat Radiation spectrum was observed when plotted
energy loss against β, γ, or X-ray energies of fission products supposedly present in solar flare and atmosphere : 113Xe, 131I, 137Cs, 95Zr, 144Cs, 134I, 140Ba, 133I, 140La, 133In etc that caused solar lines. Consistent presence of a sharp
line for four months in AIA spectral EUV band at 335A exemplifies self-sustained uranium fission from a small site appeared in SDO/AIA image at 304A. Sun’s dark spot is explained as a large crater formed on Sun’s core surface as
a result of fission reaction that does not show any emission since fission products would be thrown away from the
site during fission. Purely the same Sun’s core material left over at the site after fission reaction devoid of fission
products and any emission seems to be the familiar dark Matter. This could be the first report on the existence of
Sun’s Dark Matter.
Keywords: X-ray, β, γ, Bharat Radiation, EUV, UV, visible light, near infrared, solar flare, Sunlight phenomenon,
Padmanabha Rao effect, 235U fission, SDO/AIA image of Sun, AIA spectral band, Dark Sun spots, Dark Matter,
fission products, 131I, 137Cs, 133Xe, 90Sr, 90Y, core-Coulomb space, valence excitation, 94A, 131A 171A,193A, 211A,
304A, 335A.
I. Introduction The latest discovery on existence of Bharat Radiation wavelengths from 12.87 to 31 nm in solar spectrum
has brought a fundamental change in the current understanding on Sunlight phenomenon [1]. The success has come
when a wide range of mysterious wavelengths from 12.87 to 31 nm in solar spectra measured by various researchers
since 1960s have been identified as Bharat Radiation wavelengths [2-5]. That is how solar spectrum provided the
first evidence when a search was made on existence of Bharat Radiation emission predicted from radioisotopes and
XRF sources [6-10, 12]. More importantly, the previous study has clarified that solar X-rays and extreme ultraviolet
(EUV) are not independent emissions. The field of solar spectroscopy received a new impetus with the disclosure
that the latest solar spectrum reported by Woods et al in 2011 constitutes three major wavelength ranges: X-ray up to
12.87 nm, Bharat Radiation from 12.87 to 31 nm, and EUV beyond 31 nm with reference to solar spectrum in
Fig.1[1, 2]. These three successive wavelength ranges found in solar spectrum following the predicted pattern of a laboratory XRF source redefine the basic electromagnetic spectrum. Their successive positions holds the key that
X-rays cause Bharat Radiation, in turn Bharat Radiation causes EUV, UV, visible, and near infrared radiation
emissions by the atomic phenomenon, Padmanabha Rao Effect [8,11]. Conceptually, Sun‘s Bharat Radiation
emission by β, γ, and X-ray energies of radioisotopes agreeing with the view that 235U fission powers Sunlight
against the widely believed fusion could be a major breakthrough in solar physics. This paper reports evidences on
presence of fission products in solar flare and atmosphere. That is how an unprecedented success has come in
identifying solar lines as many as 153 measured by various researchers since 1960s within 12.87 to 31 nm range of
Bharat Radiation [2-5]. Furthermore, the current study provides the most plausible explanation how solar lines are
produced by specific β, γ, and X-ray energies of uranium fission products by Padmanabha Rao Effect, with
unprecedented detail.
Sunlight phenomenon being one of the most complex phenomena in science evaded from previous researchers. Understanding the phenomenon needed advanced knowledge in the fields of nuclear physics, X-ray
physics, and atomic spectroscopy. A surprise finding, optical emission detected from Rb XRF source in 1988 led to
Submitted date 13 June 2013 Accepted Date: 19 June 2013

Discovery of Self-Sustained 235
U Fission Causing Sunlight by Padmanabha Rao Effect
www.iosrjournals.org 7 | Page
the discovery of a previously unknown atomic phenomenon causing Bharat radiation emission followed by optical
emission from radioisotopes and XRF sources reported in 2010 [10]. The same phenomenon was found causing the
Sunlight. However, it took nearly 25 years of research to reach the current level of understanding the Sunlight
phenomenon reported here.
The previous study was limited to identification of a broad range of Bharat Radiation wavelengths from
12.87 to 31 nm in the solar spectrum reported by Woods et al in 2011 reproduced in Fig.1 [1, 2]. It has prompted this
exhaustive study, which provides a detailed explanation how solar lines in that range are actually produced. Fortunately, uranium fission taking place on Sun‘s core surface generates high temperatures as a by-product, while
achieving such high temperatures by fusion remained a theoretical proposition. The concept of fusion faced major
setback when most solar lines could not be identified on the basis of thermally excited atomic spectra. Only a
limited few were traditionally believed to be Fe, He, Mg, and Ne lines as shown in Fig.1, yet complete disagreement
was reported between solar lines and the latest measurement of Fe lines, say between solar 17.1073 nm emission and
Fe IX emission [1]. Truly speaking, on valence excitation the Sun‘s Bharat Radiation generates a ‗new class of
atomic spectral line emissions‘ in EUV, UV, visible and near infrared range regardless of temperature from within
the excited radioisotopic ions remaining in atomic state [10].
The most difficult task in the current study is the selection of a specific β, γ, or X-ray energy of a uranium
fission product that supposedly caused a particular solar line in Bharat Radiation range listed in Table 1, particularly
when selection was to be made from a vast data of fission products, their emissions and β, γ, and X-ray energies available in literature. Second difficulty arose in realizing the fact that solar lines were caused by chains of fission
products starting with very short lived ones such as 133
In (180 ms) particularly when data on their actual release is
not available in literature. Fortunately, there has been a similarity in the fission products released during Chernobyl
reactor accident in 1986 and those supposedly present in solar flare and atmosphere listed in Table 1. For example,
the reports on Chernobyl reactor accident in 1986 generally focused on release of medium and long lived fission
products such as 133Xe, 131I , 133I, 134I, 134Cs, 137Cs, 140Ba, 140La, 95Zr, 141Ce and 144Ce, 90Sr [13-24]. Particularly,
release of 131I radioactivity was significantly high and spread even to far off countries such as India [24].
Interestingly, presence of 131I in solar flare and solar atmosphere is indicated from the fact that the tallest peak at
17.107 nm in the middle of solar spectrum in Fig.1 seems to have caused by 606.31 keV energy (Eβmax) of 131I. In
fact Table 1 shows the entire chain of fission products 131In, 131Sn, 131Sb, 131mTe, 131Te and 131I have caused 14 solar
lines.
The phenomenon of causing solar Bharat Radiation lines can be well understood from the study with radioisotopes [10]. While β, γ and X-ray emissions pass through core-Coulomb space experience an energy loss at
eV level. The energy loss is the Bharat Radiation energy, which appears as a solar line in 12.87 to 31 nm range of
Bharat Radiation. Understanding the phenomenon became easy since the solar line provided the key information on
the energy loss by β, γ or X-ray while passing through core-Coulomb space. Energy equivalence in eV of each solar
line wavelength in Table 1 provided the energy loss by a specific β, γ or X-ray. The only step necessary is to select
carefully the energy of a fission product for each energy loss by verifying every time whether a smooth graph is
resulted or not in Figure 2. Firstly, 12.99 nm (equivalent to 95.45 eV) emission is taken up to know its source of
energy (Table 1). Since solar X-rays are up to 12.87 nm range, 12.99 nm is a short Bharat Radiation wavelength. As
the solar 12.86 nm (0.096411 keV) X-ray with longest wavelength is expected to face the maximum energy loss
95.45 eV in core-Coulomb space, 0.096411 keV is presumed to be the possible source for 12.99 nm emission. The
energy loss 95.45 eV is the Bharat Radiation energy that in turn causes EUV, UV, visible and near infrared radiations on valence excitation. Solar lines longwards of 13.6 nm are produced by β or γ energy of 235U fission
products (Table 1). Interestingly, all the three emission β, γ and X-ray faced same loss of energy while passing
through core-Coulomb space because β did not behave its particulate nature within excited atom [10].
Maximum energy loss 95.45 eV by 0.096411 keV X-ray appeared as 12.99 nm emission, whereas the
minimum energy loss 40.81 eV by 9500 keV (Eβmax) energy of 131In appeared as 30.378 nm emission, previously
labeled as He II in Fig.1 and Table 1. Very high β, or γ energies of short lived fission products first generate long
Bharat Radiation wavelengths, which in turn generate as much as 40% visible and near infrared radiation intensities
in gross light intensity, according to Fig.3 in Ref.10. Therefore, presence of short lived fission products such as131In
in solar flare seems to control maximum temperatures on Earth (Table 1). UV intensity from fission products
remains always above 83% in gross light intensity. Relatively low β, or γ energies from fission products like 103Ru, 99Mo, 131Te, and 132Te cause UV intensity as high as 97%. Therefore, they can be responsible for Sun‘s dominant UV emission.
Solar Dynamics Laboratory‘s (SDO's) Atmospheric Imaging Assembly (AIA) provides 8 spectral bands
through a website ‗The Sun Today‘ of which six bands 94, 131, 171, 211, 304 and 335A are chosen for study here
[25]. Firstly, these spectral bands have been identified as of X-ray (94A), Bharat Radiation (131, 171, 211, and
304A) and EUV (335A) emissions. The peaks simultaneously appeared at different wavelengths unfolded the fact
that 94A X-rays have caused 131A Bharat Radiation, which in turn caused the 335A EUV by Padmanabha Rao
Effect. Notably, a solitary line appeared for four months in the spectral EUV band at 335A and at times in Bharat
Discovery of Self-Sustained 235
U Fission Causing Sunlight by Padmanabha Rao Effect
www.iosrjournals.org 8 | Page
Radiation band at 304A suggested self-sustained uranium fission from a small site of fission appeared in SDO/AIA
images of Sun. This new finding suggests self-sustained uranium fission powers Sunlight.
A critical look at 304A Bharat Radiation, and 1600A and 1700A UV images of Sun in Fig.8 unfolded what
causes the Sun‘s dark spots. Total absence of Bharat, UV, visible light radiation emissions from Sun‘s dark spots
against a bright background suggests uranium fission might have lifted away a large chunk of Sun‘s core material
along with fission fragments into nuclear fallout. A large crater formed at the site of fission on Sun‘s core surface
without any emission appears as Sun‘s dark spot. Sun‘s dark spots are not seen at X-ray and EUV since solar flare generally masks the dark spots at these wavelengths.
Sun‘s dark spots seem to provide the first and key evidence on true existence of the familiar dark matter.
(i) The biggest Sun spots estimated to be almost six times to the size of Earth [26] coincides with the general opinion
that sizable fraction of the Universe constitutes dark matter [27, 28]. (ii) It is also believed that dark matter doesn‘t
release light [28]. In support of this view, images of Sun in Fig. 8 have provided evidence that Sun‘s dark spots do
not emit Bharat radiation, UV and visible light. Pasquale Dario Serpico and Dan Hooper reviewed prospects for the
Fermi satellite (formerly known as GLAST) to detect gamma rays from dark matter [29]. However, this seems to be
not possible since no fission products would be left at the site of fission. Therefore, purely the Sun‘s core material,
left at the site of fission devoid of fission products, looking as Sun‘s dark spot in the absence of any radiation
emission might be the familiar dark Matter.
Lastly the current study also unfolded a previously unknown phenomenon in which highly ionized radioisotopic ions attract each other and form a radioactive cloud. Radioactive clouds (nuclear fallouts) are seen in
image of Sun in Fig.8 as two solar flares attracting each other to a common place like magnets. Sun seems to have a
space free from dust unlike Earth, so radioactive cloud is able to travel great distances in solar atmosphere.
II. Results and discussion Solar X-ray, Bharat Radiation and EUV wavelengths successively situated in solar spectra (Fig.1) imply
that the three experimental discoveries reportedly made in X-ray physics, nuclear physics and atomic spectroscopy
apply to solar physics [1,10,12]. (1) On the basis of UV dominant optical radiation detected for the first time from
radiochemicals such as 131I, and 137Cs in the laboratory it is believed that uranium fission products such as 131I, and 137Cs in solar flare and atmosphere have caused solar Bharat Radiation lines in 12.87 to 31 nm range, and EUV
beyond 31 nm in Figure 1. (2) The optical emission detected from XRF sources present as salts indicated that solar
X-rays could be characteristic X-rays of fission products. (3) The optical emission detected from radioisotopes and
XRF sources present in metallic form such as metallic 57Co, and Cu XRF source indicated that Sun truly emits a new
class of atomic EUV, UV, visible, and near infrared (NIR) radiation emissions from fission fragments regardless of
temperature.
The three more physics discoveries resulted while explaining how β, γ, and X-ray could cause the newly
detected optical emission within an excited atom of radioisotope or XRF source also apply to solar physics. 1. The
predicted Bharat Radiation wavelengths from radioisotope and XRF sources have already been found in solar
spectrum [1]. 2. Since Bharat Radiation causes a new class of room temperature atomic spectra of solid
radioisotopes and XRF sources, Sun‘s Bharat Radiation causes atomic emission lines of fission products present in
solar flare and atmosphere regardless of Sun‘s temperatures. This is because exited atoms in radioisotopes remain in a temporary atomic state of matter. 3. The previously unknown atomic phenomenon, Padmanabha Rao Effect known
to cause Bharat Radiation and UV dominant optical radiation emissions from radioisotopes and XRF sources also
causes solar lines.
The following describes how the first and foremost important task of identifying individual solar lines
measured by various researchers within the Bharat Radiation range 12.87 to 31 nm met with unexpected success [2-
5]. This could be a welcoming step in solar spectroscopy since only 11 lines in Fig.1 could be labeled as Fe, Mg, Ne
and He lines, while many lines could not be identified on the basis of thermally excited atomic spectra. Even those
11 solar lines disagreed with the cited Fe lines, on verification from the latest spectral data [1]. On the other hand,
definite presence of Bharat Radiation wavelengths in 12.87 to 31 nm range in solar spectrum pinpointed that specific
β, γ, and X-ray energies of radioisotopes have caused the solar lines situated within this range [1]. The author has
already opined that uranium fission powers Sunlight [1,9,10]. Therefore, for further advancement of the study a search for specific β, γ, or X-ray energies is made every time from a vast data of β, γ, and X-ray energies of 235U
fission products available in literature that caused a particular solar line emission mentioned in Table 1. Table 1
provides source of energies for a complete list of 153 Bharat Radiation lines.

Discovery of Self-Sustained 235
U Fission Causing Sunlight by Padmanabha Rao Effect
www.iosrjournals.org 9 | Page
Fig.1. Solar spectrum shown here was obtained by Woods et al. on May 5, 2010 [2]. The flare data from EVE
shown here are primarily from the MEGS-A channel measuring the spectrum from 7 to 37 nm.
2.1 X-rays causing solar lines
The following describes how the source of energy is determined for the minimum 12.99 nm emission in
Table 1. In terms of energy, 12.99 nm is equivalent to 95.45 eV. On the basis of atomic phenomenon reported earlier
[1,10], the line wavelength 12.99 nm holds the key that a very low β, γ, or X-ray energy has lost maximum energy
95.45 eV while passing through core-Coulomb space in an excited atom of a fission product. In the next step, a
search made to find the most plausible β, γ, or X-ray energy that caused the solar line led to 12.86 nm, the maximum X-ray wavelength presumed in the solar spectrum in Figure 1, equivalent to 0.096411 keV the lowest X-ray energy
in Table 1. Therefore, the explanation is 0.096411 keV X-ray energy has lost 95.45 eV energy while passing through
core-Coulomb space. The energy loss 95.45 eV appeared as the 12.99 nm emission.
Next, 13.1 nm Bharat Radiation emission in Figure 1 is taken up to find its source of energy (Table 1). The
prominent 9.384 nm (Fe XVIII) X-ray emission (equivalent to 0.131898 keV) in Fig.1 is thought to be the likely
source for 13.1 nm emission. Since 13.1 nm is of longer wavelength than the previous case, the energy loss fell to
94.64 eV when 0.131898 keV passed through core-Coulomb space. Essentially, the loss of energy 94.64 eV by
0.131898 keV energy appeared as 13.1 nm emission at higher wavelength.
The third line taken up for identification is 13.3 nm emission equivalent to 93.22 eV. Wood et al in 2011
reported that Fe xx/Fe xxiii 13.3 nm emission behaved almost identically to the GOES X-ray time series [2]. From
their reported spectrum reproduced in Fig.1, the shortest solar X-ray wavelength nearly at 7.0 nm (equivalent to 0.177 keV) applies to GOES X-rays is thought to be the likely source for 13.3 nm emission. The 33.5 nm (Fe XVI)
emission detected a few minutes after X-rays is regarded in the current study as of EUV, since EUV wavelengths
begin from 31 nm [1]. Detection of 13.3 nm Bharat radiation emission as fast as GOES X-rays explains 0.177 keV
GOES X-ray energy has lost 93.22 eV in core-Coulomb space and the energy loss appeared as 13.3 nm emission,
which has caused 33.5 nm EUV Radiation emission. Their successive measurements validated Padmanabha Rao
Effect [10].
Figure 2 shows a graphical plot between γ-, X-, and β energies of the fission products and their energy loss
in eV while passing through core-Coulomb space, considering 95.45, 94.64 and 93.22 eV as the first three points.
Table 1 unfolds 0.096411 keV energy (12.86 nm) of solar X-rays has lost maximum energy (95.45 eV). The energy
loss appeared as 12.99 nm emission. In contrast, 9500 keV (Eβmax) of 133In has undergone the minimum loss 40.81
eV, which appeared as 30.378 nm emission. Figure 2 is the first ever graph on Bharat Radiation energy. It reveals
that when γ-, X-, and β energies from 0.096411 keV to 1603.5 keV pass through core Coulomb space the Bharat Radiation energy generated shows a steep fall from 95.45 to 43.63 eV. From 1614 to 9500 keV the Bharat Radiation
energy shows a slow fall merely from 43.42 to 40.81 eV.

Discovery of Self-Sustained 235
U Fission Causing Sunlight by Padmanabha Rao Effect
www.iosrjournals.org 10 | Page
Fig.2: From the data in Table 1, this graphical plot is made between γ-, X-, and β energies (in keV) of the fission
products and the energy loss in eV (equivalent of solar lines in nm) that they experienced while passing through
core-Coulomb space. This is the first ever graph on Bharat Radiation energy (energy loss) revealing low γ-, X-, and
β energies undergo more energy loss, so generate higher Bharat Radiation energy at eV level.
Solar line emissions higher than 13.3 nm did not match with any solar X-ray energies as they may not have
been caused by X-ray energies. Therefore, despite solar X-ray range precedes that of Bharat radiation in solar
spectrum in Figure 1, Table 1 demonstrates that various γ or β energies of 235U fission products have caused Bharat
Radiation wavelengths longwards of 13.3 nm. Emergence of a typical and smooth shape in Figure 2 reflects good
correlation between γ-, X-, and β energies in keV of the 235U fission products and their energy loss in eV given in
Table 1. Notably, Figure 2 reveals the trend of first ever Bharat Radiation energy generated by γ-, X-, and β energies
in keV within the same excited atom. It substantiates the claim that 235U fission takes place on Sun‘s core surface mainly because of similarity between the fission products mentioned in Table 1 and those released during Chernobyl
reactor accident on April 26, 1986 [13-24].
Table 1 discloses similarity between fission products such as 133Xe, 131I , 132Te , 134Cs , 137Cs, 99Mo, 95Zr,95Nb, 85Kr, 103Ru, 106Ru, 140Ba, 110mAg, 141Ce, 144Ce , 89Sr, and 90Sr released during Chernobyl reactor accident
in 1986 and those supposedly present in solar flares and atmosphere. Interestingly, solar lines are caused by a chain
of decay products leading to 133Xe, 131I , 132Te , 134Cs , 137Cs, 99Mo , 95Zr,95Nb, 85Kr, 103Ru, 106Ru, 140Ba, 110mAg,
141Ce, 144Ce , 89Sr, and 90Sr. On literature survey measurement of solar lines between 13.3 to 13.6 nm was not
available. Therefore solar lines from 13.6 to 16.7 nm were approximated from Fig.1 just to understand the trend of
Bharat Radiation energy in Fig.2.
2.2 15.01 nm emission of 133
Xe (Ne V) The following describes why the solar lines previously labeled as Fe, Mg, Ne, He lines etc acquired now
new identifications. During Chernobyl accident, 133
Xe showed the maximum radioactivity release [13,14,16],
though several isotopes of Xenon are sufficiently produced in fission [17]. However, as 133Xe remains in gaseous
phase, quickly transported to even distant countries including India along with 85Kr and 131I, as a result its
concentration at any particular area became relatively low, as compared to 131I or 137Cs [24]. A steady rising smooth
graph continued in Figure 2 on plotting 346.4 keV (Eβmax) of 133Xe indicated its most likely presence in solar flare
and atmosphere. It explains that the energy loss 82.60 eV in core-Coulomb space by 346.4 keV appeared as 15.01
nm Bharat Radiation emission previously identified as Ne V. Though 133Xe release is expected to be high over 131I,
but might have got diluted during transport of solar flare to distant areas from site of fission. Moreover, its relatively
short half life of 5.243 days as compared to 8.0207 days half life of 131I could be another reason why intensity of its
peak at 15.01 nm has been found lower than that of 131I peak at 17.107 (Fe IX) in solar spectrum in Figure 1. Table 1 shows a chain of fission products: 134In, 133In, 134Sn, 133Sn, 133Sb, 133Te, 133mTe, and 133I leading to 133Xe caused 14
solar lines.
2.3 Radioiodines
2.3.1 25.63 nm emission of 133
I (He II) In terms of release of radioactivity into the atmosphere, the volatile 133I has been released with much higher
radioactivity than 131I during Chernobyl accident; however owing to its short half life of 20.8 hr decayed during

Discovery of Self-Sustained 235
U Fission Causing Sunlight by Padmanabha Rao Effect
www.iosrjournals.org 11 | Page
transport [14, 18]. For similar reasons the intensity of solar 25.63 nm emission previously labeled as He II might
have been lower than that of 131I (17.107 nm, Fe IX)) in solar spectrum in Fig. 1. The 1240.13 keV energy (Eβmax) of
133I seems to be source for 25.63 nm emission (Table 1). The fission product has also caused 16.7, and 25.7554 nm
emissions. Since 133I is parent nuclide of 113Xe, the same chain of fission products mentioned earlier: 134In, 133In, 134Sn, 133Sn, 133Sb, 133Te, 133mTe led to 133I present in solar flares and atmosphere caused 13 solar lines.
2.3.2 17.107 nm emission of
131I (Fe IX)
In terms of high release of radioactivity into the atmosphere during Chernobyl accident, the volatile 131I
stands next to the gaseous 133Xe [13,14]. Maximum activity of 131I was measured in the Pripyat river at Chernobyl
[14]. Likewise, primarily isotopes of inert gases and iodine in different chemical forms may have been lifted into
the solar flare and atmosphere in the gas phase. 131I might be present in solar flare and atmosphere, since a steady
rising smooth graph continued in Figure 2 on plotting 606.31 keV β (Eβmax) energy of 131I . This insight explains that
the energy loss 72.48 eV in core-Coulomb space by 606.31 keV appeared as 17.107 nm emission previously labeled
as Fe IX (Table 1). However, it may not be possible to always measure the maximum intensity for 17.107 nm
emission, when radioactivity of 131I would significantly fall after a month, and gets diluted while transporting to
other places through radioactive cloud. Table 1 shows a chain of fission products: 131In,131Sn, 131Sb, 131mTe, 131Te
leading to 131I have caused 14 solar lines.
2.3.3 20.1734 nm emission of 134
I (Fe XIII)
Literature on very short lived radioisotopes released from Chernobyl accident is scarce. The 847.025 keV
γ-energy of 134I seems to have caused the 20.1734 nm emission previously identified as Fe XIII. A chain of fission
products: 134In, 134Sn, 134Te leading to 134I seemed to be present in solar flare and atmosphere have caused 11 solar
lines.
2.3.4 Emissions of 132
I and 135
I
131I, short-lived radioiodines (132I, 133I, 135I), and short-lived radiotelluriums (131mTe and 132Te) released
from Chernobyl accident reached many distant places including Belarus; however these short lived radioiodines
decayed faster than 131I [18]. Table 1 shows a chain of fission products: 132In, 132Sn, 132mSb, 132Sb, 132Te, 132mI leading
to 132I present in in solar flare and atmosphere have caused 20 solar lines. Likewise, a chain of fission products: 135Sb, 135Te lading to 135I present in solar flare and atmosphere seemed to have caused 8 solar lines listed in Table 1. In nutshell, radioiodines alone have produced 66 solar lines in Bharat Radiation range. Experience with 131I and 137Cs has shown that each gamma photon produces more than one light photon [10]. Therefore radioiodines and 137Cs alone contribute significantly to Sunlight.
2.4 Radiotelluriums
Predominantly volatile radioisotopes of iodine, cesium, tellurium including 129mTe,131mTe, and 132Te present
in air after Chernobyl accident have been identified by filter sampling [13]. Table 1 shows that 852.21 keV γ energy
from131mTe seems to be source for the 20.2424 nm emission, while 1603.5 keV energy (Eβmax) of 129mTe for 28.420
nm emission.
2.5 137
Cs, 134
Cs,141
Ce, 144
Ce, 89
Sr, 90
Sr, 95
Zr, 95
Nb in solar flare
Besides the noble gases 133Xe and 85Kr, about half of the volatile elements such as 131I, 134Cs , 136Cs, and 137
Cs were released during Chernobyl accident [13,14]. The following radionuclides were detected in bodies of
those who died due to acute radiation sickness caused by Chernobyl accident: 89Sr, 90Sr, 95Zr, 95Nb, 103Ru (7 kBq), 134Cs (9 kBq), 137Cs (18 kBq), 141Ce, 144Ce [22]. The following radionuclides were found in fecal samples: 89Sr, 91Y,
95Zr, 99Mo, 131I, 132Te, 134Cs, 137Cs, 140Ba, 140La, 141Ce, and 144Ce [23]. In summer 1986 and 1987, significant
radioactivity of 137Cs, 134Cs, and 144Ce as compared to that of 106Ru, 95Zr,, 95Nb, and 90Sr was recorded in northern
areas of Gomel region. Most interestingly, 137Cs in soil and grass was detected to be high in North of Gomel while 144Ce, and 95Nb was high in South of Gomel region [23].
2.6 17.693 nm emission of 137
Cs (Fe X)
Figure 1 shows a prominent peak at 17.693 nm. Table 1 shows 661.657 keV γ-energy of 137Cs has caused the 17.693 nm emission previously labeled as Fe X. 137Cs was spread up to Sweden, Belarus, Bulgaria, Greece,
some Russian and Ukrainian areas and found significant activity even after several months of Chernobyl accident
[14, 19, 20]. Table 1 shows a chain of fission products: 137I, 137Xe and 137Cs present in solar flare and atmosphere
seemed to have caused 6 solar lines. Table 1 shows presence of 134Cs in solar flare and atmosphere. The 795.864
KeV γ-energy of 134Cs could be the most likely source for 19.466 nm emission previously identified as Fe XII. It has
also caused two more peaks. The 1235.362 keV γ-energy of 136Cs seems to be the source for 25.511 nm emission.
Both 136Cs and 136mBa have caused 3 solar lines. Along with 134Cs and 137Cs, 136Cs was released during Chernobyl

Discovery of Self-Sustained 235
U Fission Causing Sunlight by Padmanabha Rao Effect
www.iosrjournals.org 12 | Page
accident [20]. 138Xe and 138Cs have caused 2 solar lines. Long lived fission products such as 137Cs and 90Sr present in
solar atmosphere and spread uniformly throughout Sun‘s disk as a result of fall out provide constant source of
Sunlight to Earth even when solar flares are reduced to minimum in number.
2.7 Emissions of 141
Ce and 144
Ce
Table 1 shows evidence of a chain of fission products: 141Cs, 141Ba, 141La leading to 141Ce present in solar
flare and atmosphere have caused 4 solar lines. Similarly, likely presence of 144Ba, and 144Ce in solar flare and atmosphere caused 2 solar lines.
2.8 18.0401 nm emission of 95Zr (Fe XI); and
95Nb
Table 1 shows 724.199 keV γ energy of 95Zr has caused 18.0401 nm emission previously labeled as Fe XI.
A chain of fission products: 95Rb, 95Sr, 95Y, 95Zr, and 95Nb have caused 8 solar lines.
2.9 99
Mo A chain of fission products: 99Rb, 99Sr, 99Y, 99Zr, 99Nb leading to 99Mo have caused 8 solar lines.
2.10 Emissions of 89
Sr and
90Sr
During Chernobyl accident, 90Sr being less volatile than cesium remained close to the site of fission and at longer distances its deposition has been low [13,14]. However, presence of long lived fission product 90Sr was
detected at many places after Chernobyl accident and as far as Bulgaria, though the release of 90
Sr has been very low
as compared to 131I or 137Cs [20]. A chain of fission products: 89Br, 89Kr,89Rb, 89Sr, and 89Y present in solar flare and
atmosphere seemed to have caused 6 solar lines (Table 1). A chain of fission products: 90Br, 90Kr, 90mRb, 90Sr, and 90Y present in solar flare and atmosphere seemed to have caused 6 solar lines.
2.11 21.1 nm emission of 140
Ba (Fe XIV)
During Chernobyl accident, significant activity of 140Ba was released into air [13,14]. The following fission
products including 140Ba were detected by gamma spectrometry 99Mo, 99mTc, 103Ru, 127Sb, 129Te, 132Te, 131I, 132I, 133I, 134Cs, 136Cs, 137Cs, 140Ba, and 140La. Significant radioactivity of 140Ba was measured in the Pripyat River at
Chernobyl [14]. As 95Zr, 95Nb, 103Ru, 106Ru, 125Sb, 129mTe, 134Cs, 137Cs, 140Ba, 140La, 141Ce and 144Ce are expected to
settle several kilometers away from site of fission; their activity gets diluted when they travel greater distances [15]. Similarly, the intensity of the 140Ba peak in solar spectrum depends upon several factors particularly its
ability to transport from site of fission to solar flare. Presence of 140Ba in solar flare is indicated since 21.1 nm
Bharat Radiation emission (previously labeled as Fe XIV) seems to have caused by 1006.19 keV β (Eβmax ) energy
of 140Ba.. A chain of fission products: 140I, 140Xe,140Cs, 140Ba , and 140La present in solar flare and atmosphere seemed
to have caused 14 solar lines.
2.12 17.8058 nm emission of 85Kr
Another noble gas 85Kr also was released during Chernobyl accident with activity of just 33 PBq as
compared to 1700 PBq of 133Xe [13,14]. 85Kr might be present in solar flare, since a steady rising smooth graph
continued in Figure 2 on plotting 687.1 keV (Eβmax) energy of 85Kr. It explains that the energy loss 69.63 eV in
core-Coulomb space by 687.1 keV appeared as 17.8058 nm emission. Though the radioactivity release of 85Kr is reflected as a fraction of 133Xe during Chernobyl accident, in solar flare the intensity of 17.8058 nm emission from 85
Kr was found to be higher than that of 15.01 nm emission from 133
Xe. Probably its long half life (10.756 y) is
helping to accumulate activity in solar flare and in raising its intensity level. A chain of fission products: 85As, 85Se, 85Br, 85mKr, leading to 85Kr present in solar flare and atmosphere seemed to have caused 8 solar lines.
2.13 Nature of Bharat Radiation spectrum
The fact that low γ-, X-, and β energy undergoing relatively more loss, and high energy undergoing less
loss while passing through core Coulomb space seen in Fig.2 is in complete agreement with what was predicted for
Bharat Radiation from radioisotopes and XRF sources [Fig.3, Ref. 1]. Figure 3 provides for the first time the typical
nature of Bharat Radiation spectrum.
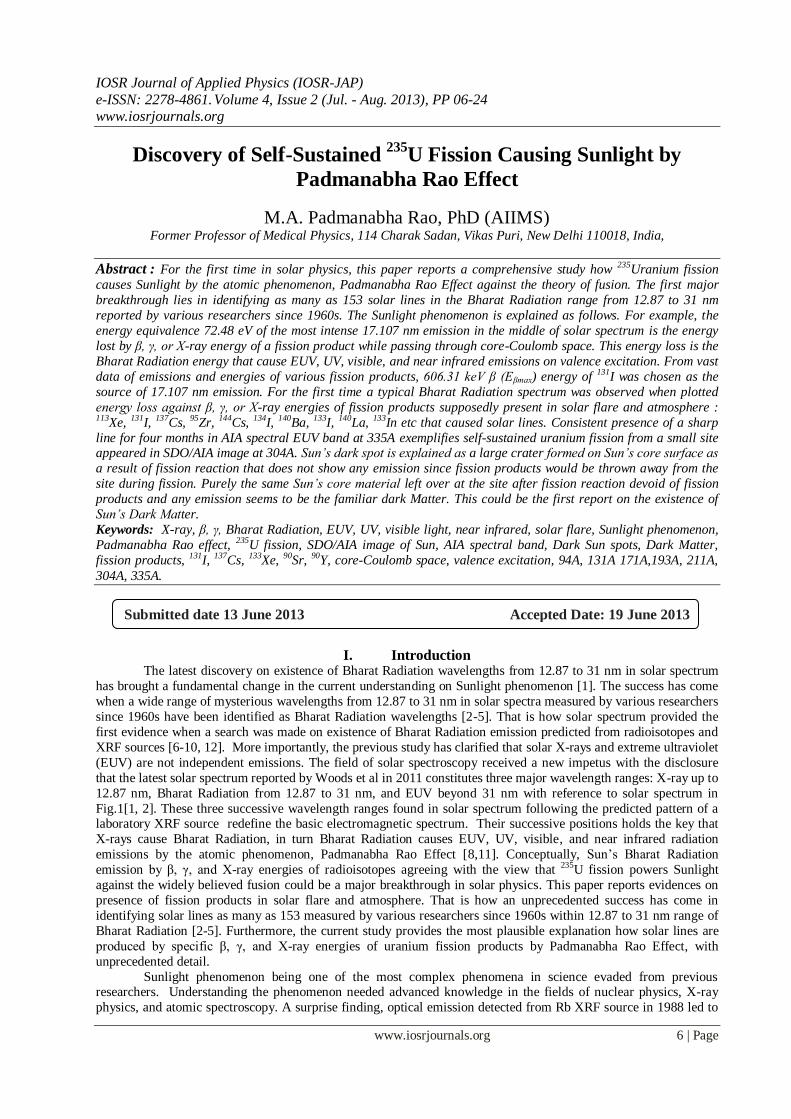
2.14 Control on Sun’s high temperatures
Figure 3 shows γ-, X-, and β energies from 0.096411 keV to 1603.5 keV have caused 105 solar lines from
12.99 to 28.420 nm, and the graph exhibited a steep raise. These relatively low γ-, X-, and β energies ultimately
cause dominant solar EU and UV in the gross light intensity while visible and near infrared radiations remain very
low [10]. Since near infrared radiation intensity levels remain very low, these low γ-, X-, and β energies seem to be
responsible for low temperatures of the Earth‘s atmosphere. Afterwards the graph slowly attained a plateau. A wide
range of high γ-, X-, and β energies from 1614 to 9500 keV originating from very short lived fission products with
Discovery of Self-Sustained 235
U Fission Causing Sunlight by Padmanabha Rao Effect
www.iosrjournals.org 13 | Page
half life of few seconds or minutes caused just 48 solar lines and within a narrow range of 28.555 to 30.378 nm.
These relatively high γ-, X-, and β energies ultimately cause a dip in solar UV though UV always remain nearly
above 83% in the gross light intensity while visible and near infrared radiations raise correspondingly [10]. Rise in
near infrared radiation intensity levels from these high γ-, X-, and β energies seem to be responsible for high
temperatures of the Earth‘s atmosphere. Most interestingly, 30.378 nm Bharat Radiation emission sets the upper
limit for Sun‘s high temperatures. It will not allow exceeding Sun‘s high temperature beyond a certain limit. That is
how all living beings are saved without causing intolerable heat from Sun.
Fig. 3. Graphical plot between γ-, X-, and β energies (keV) of the 235U fission products and solar line wavelengths
that they produced in the Bharat Radiation range from 12.99 to 30.378 nm shown in Table 1. The graph shows
solar Bharat Radiation wavelengths gradually attain plateau after 1600 keV γ-, X-, and β energy.
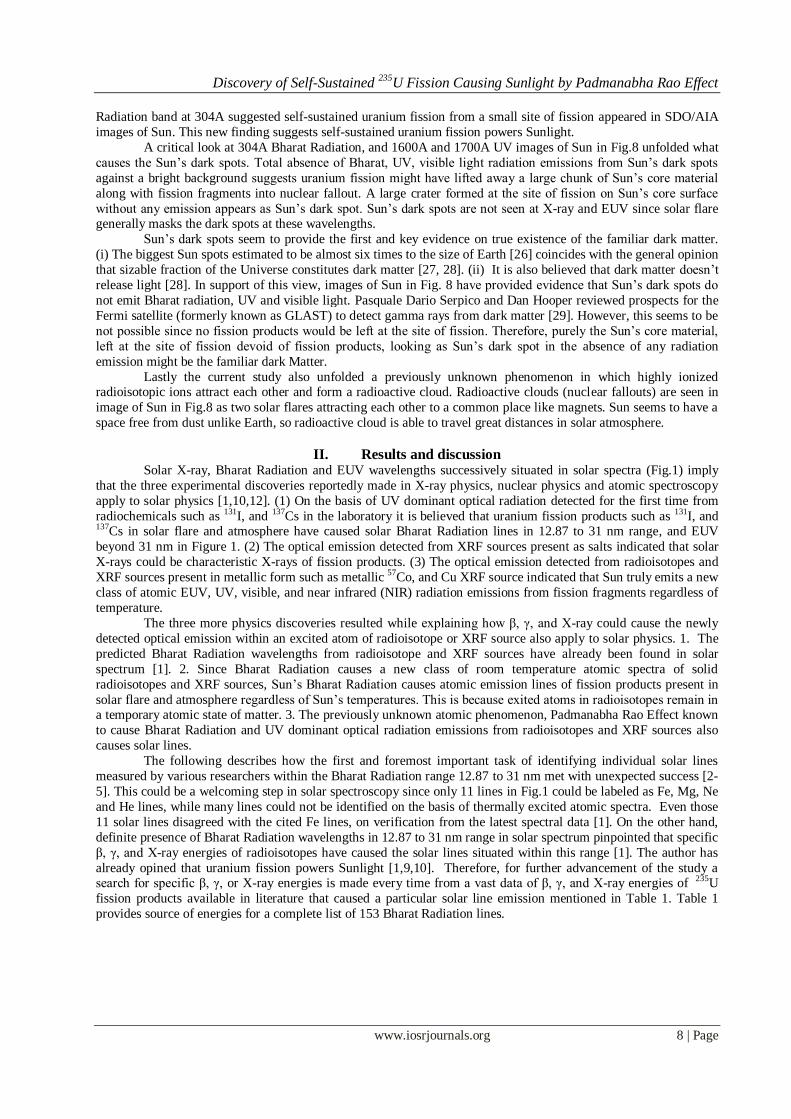
Table 1: The X-ray or 235U fission product given in 2nd column is responsible for producing the solar line given in
7th column. The γ-, X-, or β energy given in 5th column of a fission product experiences energy loss in eV given in 6th column in core –Coulomb space. The energy loss simply appears as solar line in Bharat Radiation range (7th
column).
γ, β or X-ray of fission products Solar
line
produced
Previous
line
identity Source
of solar
line
Half life γ, β or
X-ray
emission
taking
part
γ, β or X-ray
energy
causing
solar line
Energy
lost in
core-Coulomb
space
(keV) (eV) (nm)
1. 1. Solar
X-rays
X-ray 0.096411
(12.86 nm)
95.45 12.99
2. Solar
X-rays
X-ray 0.131898
(9.384 nm)
94.64 13.1 Fe VIII
3. GOES X-X-
rays
X-ray 0.177
(7.0 nm)
93.22 13.3 Fe XX
4. 106
Ru 373.59 d Eβmax 39.4 91.17 13.6
5. 99
Mo
65.94 h γ 140.511 89.84 13.8
6. 131
Te
25 m γ 149.716 88.56 14.0
7. 132
Te 3.204 d Eβmax 215.14 85.51 14.5
8. 144
Ce 284.893 d Eβmax 318.7 83.77 14.8
9. 133
Xe 5.243 d Eβmax 346.4 82.60 15.01 Ne V
10. 131
I 8.0207 d γ 364.489 82.11 15.1
11. 95
Zr 64.02 d Eβmax 368.07 81.04 15.3
12. 140
I
0.86 s γ 376.657 80.51 15.4
13. 141
Ce 32.501 d Eβmax 435.26 79.99 15.5
14. 103
Ru
39.26 d γ 497.08 78.47 15.8
15. 137
Cs 30.07 y Eβmax 513.97 76.06 16.3
16. 133
I 20.8 h γ 529.872 74.24 16.7
17. 90
Sr 28.79 y Eβmax 546 73.39 16.8929
18. 131
I 8.0207 d Eβmax 606.31 72.48 17.107 Fe IX
19. 134
Te
41.8 m Eβmax 626.57 71.67 17.3

Discovery of Self-Sustained 235
U Fission Causing Sunlight by Padmanabha Rao Effect
www.iosrjournals.org 14 | Page
20. 132
I 2.295 h γ 630.19 71.61 17.315
21. 132
Sb
2.79 m γ 635.6 71.49 17.3442
22. 131
I 8.0207 d γ 636.989 71.15 17.425
23. 133m
Te
55.4 m γ 647.51 70.65 17.548
24. 110m
Ag 249.79 d γ 657.7622 70.27 17.645
25. 134
Cs 2.0648 y Eβmax 658.11 70.18 17.666
26. 133m
Te
55.4 m Eβmax 658.38 70.15 17.6745
27. 137
Cs 30.07 y γ 661.657 70.08 17.693 Fe X
28. 132
I 2.295 h γ 667.718 69.98 17.717
29. 85
Kr 10.756 y Eβmax 687.1 69.63 17.8058
30. 132
Sb
2.79 m γ 696.8 68.97 17.9758
31. 95
Zr
64.02 d γ 724.199 68.73 18.0401 Fe XI
32. 99
Y
1.47 s γ 724.2 68.65 18.0594
33. 133
Te
12.5 m Eβmax 726.4 68.45 18.1130
34. 131
Te
25 m Eβmax 732.88 68.06 18.2167
35. 132
I
2.295 h Eβmax 738.14 67.09 18.4793
36. 140
I
0.86 s γ 738.6 66.94 18.521
37. 99
Mo
65.94 h γ 739.5 66.44 18.660
38. 134
Te
41.8 m γ 742.586 65.91 18.8123
39. 138
Xe
14.08 m Eβmax 743.32 65.87 18.8216
40. 91
Sr
9.63 h γ 749.8 65.84 18.8299
41. 95
Zr
64.02 d γ 756.729 65.77 18.85
42. 95
Nb 34.975 d γ 765.794 65.35 18.9711
43. 134
Te
41.8 m γ 767.20 65.27 18.995
44. 132
I
2.295 h γ 772.6 64.84 19.122
45. 131m
Te
30 h γ 773.67 64.30 19.2813
46. 140
Xe
13.60 s Γ 774.12 64.07 19.3512
47. 134
Cs 2.0648 y γ 795.864 63.69 19.466 Fe XII
48. 140
Xe
13.60 s γ 805.52 63.27 19.597
49. 140
La
1.6781 d γ 815.772 63.24 19.605
50. 132
Sb
2.79 m γ 816.6 63.19 19.6210
51. 136
Cs
13.16 d γ 818.514 63.12 19.6423
52. 90m
Rb
258 s γ 831.69 62.45 19.8538
53. 85m
Kr
4.48 h Eβmax 840.81 61.65 20.1112
54. 134
I
52.5 m γ 847.025 61.46 20.1734 FeXIII
55. 131m
Te
30 h γ 852.21 61.25 20.2424
56. 134
I
52.5 m γ 884.09 61.19 20.2609
57. 135
Xe
9.14 h Eβmax 901.23 61.17 20.2705
58. 89
Zr
78.41 h γ 908.96 60.14 20.6169
59. 131
Sb
23.03 m γ 943.4 60.11 20.6258
60. 133Sn
1.45 s γ 962.18 59.24 20.93
61. 132Sb
2.79 m γ 973.9 59.11 20.9771
62. 140Ba 12.752 d Eβmax 1006.19 58.76 21.1 Fe XIV
63. 140Ba 12.752 d Eβmax 1020.04 56.36 22.00
64. 91Sr
9.63 h γ 1024.3 55.85 22.20
65. 89Rb
15.15 m γ 1031.94 55.10 22.50
66. 135I
6.57 h γ 1038.76 52.91 23.435
67. 136mBa
0.3084 s γ 1048.073 52.89 23.44
68. 134I
52.5 m γ 1072.55 52.82 23.4730
69. 133Sb
2.5 m γ 1096.22 52.25 23.73
70. 89Br
4.348 s γ 1097.82 51.71 23.978
71. 90Kr
32.32 s γ 1118.69 51.51 24.0717
72. 131mTe
30 h γ 1125.46 51.19 24.2215
73. 91Sr
9.63 h Eβmax 1127.06 51.02 24.30
74. 135I
6.57 h γ 1131.511 50.63 24.49
75. 132I
2.295 h Eβmax 1182.09 50.38 24.61
76. 99Mo 2.75 d Eβmax 1214.52 48.85 25.38
77. 137I
24.5 s γ 1218 48.82 25.396
78. 131Sn
56 s γ 1226.03 48.70 25.4596
79. 136Cs
13.16 d γ 1235.362 48.60 25.511
80. 133I 20.8 h Eβmax 1240.13 48.38 25.63 He II
81. 133Sb
2.5 m Eβmax 1247.49 48.32 25.66

Discovery of Self-Sustained 235
U Fission Causing Sunlight by Padmanabha Rao Effect
www.iosrjournals.org 15 | Page
82. 135I
6.57 h γ 1260.409 48.26 25.6919
83. 135Sb
1.71 s γ 1279.01 48.14 25.7547
84. 133I
20.8 h γ 1298.223 48.14 25.7554
85. 134I
52.5 m Eβmax 1307.63 48.10 25.7772
86. 131Sb
23.03 min Eβmax 1313.62 48.07 25.7914
87. 140La
1.6781 d Eβmax 1349.89 48.04 25.81
88. 134Cs
2.0648 y γ 1365.185 47.98 25.84
89. 110mAg
249.79 d γ 1384.3 47.69 26.00
90. 135I
6.57 h Eβmax 1387.58 46.83 26.4772
91. 132I
2.295 h γ 1398.57 46.51 26.6586
92. 140La
1.6781 d Eβmax 1414.02 46.48 26.6759
93. 85Se
31.7 s γ 1427.2 45.58 27.20
94. 138Cs
33.41 m γ 1435.795 44.74 27.71
95. 85As
2.021 s γ 1454.55 44.71 27.73
96. 135I
6.57 h γ 1457.56 44.40 27.927
97. 132I
2.295 h Eβmax 1466.72 44.32 27.976
98. 132mI 1.387 h Eβmax 1482.94 44.25 28.019
99. 89Sr
50.53 d Eβmax 1495.1 44.16 28.074
100. 85As 2.021 s Eβmax 1510 44.10 28.114
101. 91Y
58.51 d Eβmax 1544.8 44.06 28.143
102. 134In
138 ms γ 1560.9 43.90 28.245
103. 134I 52.5 m Eβmax 1586.54 43.78 28.317
104. 140La 1.6781 d γ 1596.21 43.63 28.415 Fe XV
105. 129mTe 33.6 d Eβmax 1603.5 43.63 28.420
106. 132I
2.295 h Eβmax 1614 43.42 28.555
107. 135I
6.57 h γ 1678.027 43.41 28.559
108. 140La 1.6781 d Eβmax 1678.65 43.38 28.583
109. 85As
2.021 s Eβmax 1727 43.29 28.643
110. 132Sn
39.7 s Eβmax 1777.85 43.16 28.727
111. 131Te
25 m Eβmax 2083.79 43.07 28.786
112. 132I 2.295 h Eβmax 2136.67 43.03 28.816
113. 133Te
12.5 m Eβmax 2200.23 42.99 28.842
114. 89Rb
15.15 m Eβmax 2215.81 42.91 28.896
115. 95Rb
337.5 ms Eβmax 2279 42.88 28.917
116. 90Y
64 h Eβmax 2280.1 42.79 28.974
117. 131In
0.282 s γ 2434.03 42.77 28.988
118. 141La
3.92 h Eβmax 2502 42.71 29.032
119. 144Ba
11.5 s Eβmax 2516.63 42.67 29.06
120. 141Ba
18.27 m Eβmax 2565.13 42.65 29.073
121. 85Br
2.9 m Eβmax 2565.13 42.60 29.103
122. 90Kr
32.32 s Eβmax 2611.99 42.46 29.198
123. 140Xe
13.60 s Eβmax 2632.41 42.42 29.228
124. 103Tc
54.2 s Eβmax 2660 42.42 29.231
125. 132Sb
2.79 m Eβmax 2772.42 42.39 29.251
126. 90Br
1.91 s Eβmax 2850 42.34 29.282
127. 99Nb
15 s Eβmax 3403.49 42.29 29.317
128. 99Zr
2.1 s Eβmax 3542.73 42.21 29.375
129. 132mSb
4.10 m Eβmax 3561.26 42.18 29.394
130. 137Xe
3.818 m Eβmax 3717.51 42.11 29.446
131. 132Sb
2.79 m Eβmax 3815.31 42.06 29.478
132. 137Xe
3.818 m Eβmax 4173 42.02 29.507
133. 95
Y
10.3 m Eβmax 4453 41.98 29.532
134. 89
Kr
3.15 m Eβmax 4990 41.87 29.611
135. 141
Cs
24.94 s Eβmax 5196 41.86 29.620
136. 91
Rb
58.4 s Eβmax 5797.37 41.77 29.686
137. 95
Rb
377.5 ms Eβmax 5799.91 41.76 29.691
138. 137
I
24.5 s Eβmax 5880 41.75 29.699
139. 135
Te
19 s Eβmax 5960 41.69 29.739
140. 95
Sr
23.90 s Eβmax 6087 41.64 29.778
141. 85
Se
31.7 s Eβmax 6182 41.59 29.810
142. 140
Cs
63.7 s Eβmax 6220 41.57 29.827
143. 91
Kr
8.57 s Eβmax 6331.21 41.54 29.846

Discovery of Self-Sustained 235
U Fission Causing Sunlight by Padmanabha Rao Effect
www.iosrjournals.org 16 | Page
2.15 Evidences of Padmanabha Rao Effect in AIA spectral bands and SDO/AIA images of Sun
Table 1 has provided evidences that β, γ and X-ray energies of 235Uranium fission products have caused the solar
lines in Bharat Radiation range from 12.87 to 31 nm. In the following study, AIA spectral bands and SDO/AIA
images of Sun further support the view that 235Uranium fission causes Sunlight by Padmanabha Rao Effect.
X-ray image at 94°A
Bharat Radiation
image at 131 °A
Bharat Radiation
image at 171°A
Bharat Radiation
image at 193°A
Bharat Radiation
image at 211°A
Bharat Radiation
image at 304°A
EUV image at 335°A
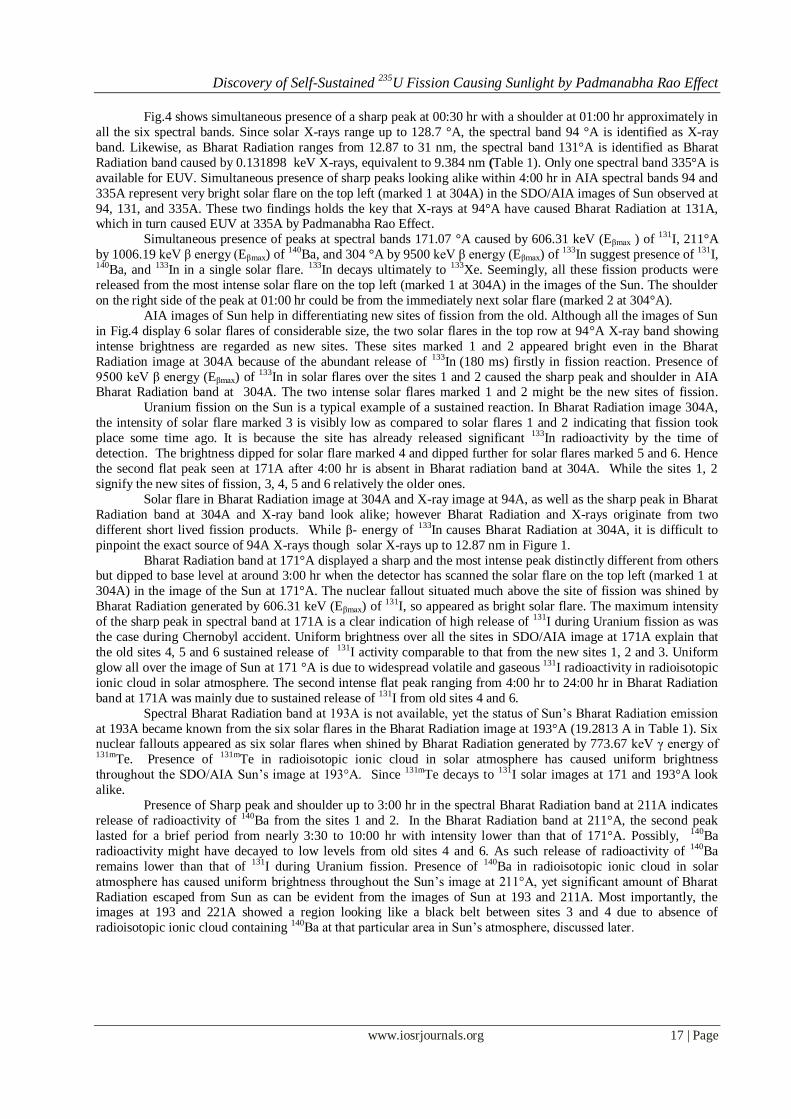
Fig.4. AIA spectral bands and SDO/AIA Sun‘s images recorded on 6 March 2012 at 94 Å are identified here as of
X-rays, 131, 171, 193, 211, and 304 Å as of Bharat Radiation, and 335°A as of EUV.
144. 131
In
0.282 s Eβmax 6739.96 41.43 29.928
145. 99
Rb
50.3 ms Eβmax 6780 41.39 29.955
146. 134
Sn
1.12 s Eβmax 7370 41.36 29.979
147. 133
Sn
1.45 s Eβmax 7990 41.28 30.032
148. 140
I
0.86 s Eβmax 8085.71 41.21 30.089
149. 99
Sr
0.269 s Eβmax 8090 41.16 30.123
150. 134
In
138 ms Eβmax 8100 41.03 30.22
151. 89
Br
4.348 s Eβmax 8160 40.88 30.331
152. 132
In
0.201 s Eβmax 9292.9 40.87 30.340
153. 133
In
180 ms Eβmax 9500 40.81 30.378 He II
Discovery of Self-Sustained 235
U Fission Causing Sunlight by Padmanabha Rao Effect
www.iosrjournals.org 17 | Page
Fig.4 shows simultaneous presence of a sharp peak at 00:30 hr with a shoulder at 01:00 hr approximately in
all the six spectral bands. Since solar X-rays range up to 128.7 °A, the spectral band 94 °A is identified as X-ray
band. Likewise, as Bharat Radiation ranges from 12.87 to 31 nm, the spectral band 131°A is identified as Bharat
Radiation band caused by 0.131898 keV X-rays, equivalent to 9.384 nm (Table 1). Only one spectral band 335°A is
available for EUV. Simultaneous presence of sharp peaks looking alike within 4:00 hr in AIA spectral bands 94 and
335A represent very bright solar flare on the top left (marked 1 at 304A) in the SDO/AIA images of Sun observed at
94, 131, and 335A. These two findings holds the key that X-rays at 94°A have caused Bharat Radiation at 131A, which in turn caused EUV at 335A by Padmanabha Rao Effect.
Simultaneous presence of peaks at spectral bands 171.07 °A caused by 606.31 keV (Eβmax ) of 131I, 211°A
by 1006.19 keV β energy (Eβmax) of 140Ba, and 304 °A by 9500 keV β energy (Eβmax) of 133In suggest presence of 131I, 140Ba, and 133In in a single solar flare. 133In decays ultimately to 133Xe. Seemingly, all these fission products were
released from the most intense solar flare on the top left (marked 1 at 304A) in the images of the Sun. The shoulder
on the right side of the peak at 01:00 hr could be from the immediately next solar flare (marked 2 at 304°A).
AIA images of Sun help in differentiating new sites of fission from the old. Although all the images of Sun
in Fig.4 display 6 solar flares of considerable size, the two solar flares in the top row at 94°A X-ray band showing
intense brightness are regarded as new sites. These sites marked 1 and 2 appeared bright even in the Bharat
Radiation image at 304A because of the abundant release of 133In (180 ms) firstly in fission reaction. Presence of
9500 keV β energy (Eβmax) of 133In in solar flares over the sites 1 and 2 caused the sharp peak and shoulder in AIA Bharat Radiation band at 304A. The two intense solar flares marked 1 and 2 might be the new sites of fission.
Uranium fission on the Sun is a typical example of a sustained reaction. In Bharat Radiation image 304A,
the intensity of solar flare marked 3 is visibly low as compared to solar flares 1 and 2 indicating that fission took
place some time ago. It is because the site has already released significant 133In radioactivity by the time of
detection. The brightness dipped for solar flare marked 4 and dipped further for solar flares marked 5 and 6. Hence
the second flat peak seen at 171A after 4:00 hr is absent in Bharat radiation band at 304A. While the sites 1, 2
signify the new sites of fission, 3, 4, 5 and 6 relatively the older ones.
Solar flare in Bharat Radiation image at 304A and X-ray image at 94A, as well as the sharp peak in Bharat
Radiation band at 304A and X-ray band look alike; however Bharat Radiation and X-rays originate from two
different short lived fission products. While β- energy of 133In causes Bharat Radiation at 304A, it is difficult to
pinpoint the exact source of 94A X-rays though solar X-rays up to 12.87 nm in Figure 1.
Bharat Radiation band at 171°A displayed a sharp and the most intense peak distinctly different from others but dipped to base level at around 3:00 hr when the detector has scanned the solar flare on the top left (marked 1 at
304A) in the image of the Sun at 171°A. The nuclear fallout situated much above the site of fission was shined by
Bharat Radiation generated by 606.31 keV (Eβmax) of 131I, so appeared as bright solar flare. The maximum intensity
of the sharp peak in spectral band at 171A is a clear indication of high release of 131I during Uranium fission as was
the case during Chernobyl accident. Uniform brightness over all the sites in SDO/AIA image at 171A explain that
the old sites 4, 5 and 6 sustained release of 131I activity comparable to that from the new sites 1, 2 and 3. Uniform
glow all over the image of Sun at 171 °A is due to widespread volatile and gaseous 131I radioactivity in radioisotopic
ionic cloud in solar atmosphere. The second intense flat peak ranging from 4:00 hr to 24:00 hr in Bharat Radiation
band at 171A was mainly due to sustained release of 131I from old sites 4 and 6.
Spectral Bharat Radiation band at 193A is not available, yet the status of Sun‘s Bharat Radiation emission
at 193A became known from the six solar flares in the Bharat Radiation image at 193°A (19.2813 A in Table 1). Six nuclear fallouts appeared as six solar flares when shined by Bharat Radiation generated by 773.67 keV γ energy of 131m
Te. Presence of 131m
Te in radioisotopic ionic cloud in solar atmosphere has caused uniform brightness
throughout the SDO/AIA Sun‘s image at 193°A. Since 131mTe decays to 131I solar images at 171 and 193°A look
alike.
Presence of Sharp peak and shoulder up to 3:00 hr in the spectral Bharat Radiation band at 211A indicates
release of radioactivity of 140Ba from the sites 1 and 2. In the Bharat Radiation band at 211°A, the second peak
lasted for a brief period from nearly 3:30 to 10:00 hr with intensity lower than that of 171°A. Possibly, 140Ba
radioactivity might have decayed to low levels from old sites 4 and 6. As such release of radioactivity of 140Ba
remains lower than that of 131I during Uranium fission. Presence of 140Ba in radioisotopic ionic cloud in solar
atmosphere has caused uniform brightness throughout the Sun‘s image at 211°A, yet significant amount of Bharat
Radiation escaped from Sun as can be evident from the images of Sun at 193 and 211A. Most importantly, the images at 193 and 221A showed a region looking like a black belt between sites 3 and 4 due to absence of
radioisotopic ionic cloud containing 140Ba at that particular area in Sun‘s atmosphere, discussed later.

Discovery of Self-Sustained 235
U Fission Causing Sunlight by Padmanabha Rao Effect
www.iosrjournals.org 18 | Page
X-ray image at 94°A
Bharat Radiation
image at 131 °A
Bharat Radiation
image at 171°A
Bharat Radiation
image at 193°A
Bharat Radiation
image at 211°A
Bharat Radiation
image at 304°A
EUV image at 335°A
Fig.5. AIA spectral bands and SDO/AIA Sun‘s images recorded on 27 September 2011 at 23:34:03 reveal a spectral
line consistently appeared at 21:00 hr for nearly months from 27- Sep- 11 to 30-Jan-12 in the EUV band at 335A
from the site of fission marked by red arrow in the in EUV image at 335A signify self-sustained uranium fission
taking place from the site on Sun‘s surface.
In Figure 5, the simultaneous peaks in X-ray, Bharat Radiation, and EUV bands approximately at 2:30 hr,
8:30 hr, 12:30 hr, and 13:30 hr indicate sustained uranium fission taking place simultaneously at several sites. The
two adjacent intense peaks at 12:30 hr, and 13:30 hr in the said spectral bands represent the most bright solar flare
visible in the middle of solar images seems from two new adjacent sites of fission. The reasons why solar flares look
alike in Bharat Radiation image at 304A and X-ray image at 94A has been discussed already. The mount like
intensities in the Bharat radiation bands at 171 and 211A and uniform glow throughout Sun‘s disk in the images at
171 and 211A was due to presence of 131I and 140Ba in solar flares over and above sites of fission and in radioisotopic ionic cloud in solar atmosphere.
2.16 Self- sustained fission for 4 months

Discovery of Self-Sustained 235
U Fission Causing Sunlight by Padmanabha Rao Effect
www.iosrjournals.org 19 | Page
Sun seems to have abundant uranium deposits to ignite self-sustained uranium fission, since the sites of
fission acted as a natural nuclear reactor as presumably happened long ago in Africa [30-33]. Neutrons from site of
fission travel long distances in Sun‘s atmosphere and trigger fission simultaneously at different places. A sharp line
at 21:00 hr in EUV band at 335A in Fig.5 uncommonly present for four months from 27- Sep- 11 to 30-Jan-12
exemplifies a typical example of self- sustained fission. The author has succeeded in identifying the site of fission
marked by red arrow in EUV image at 335A in Fig.5 as source of the line in spectral EUV band at 335A, and also
identified the same site in Fig.6 marked by yellow arrow in Bharat Radiation image at 304A. It is to note that Bharat Radiation at 304A and EUV at 335A originate from two different short lived fission products. Figures 5 and
6 explain that short lived fission products emit characteristic X-rays other than those at 94A. And those X-rays have
supposedly caused Bharat Radiation, in turn EUV line at 21: 00 hr.
Figure 6 demonstrates self–sustained fission reaction on 8th January 2012 that started on 27th September
2011 at the site marked by yellow arrow in image 304A. As discussed earlier, the sharp line at 21:00 hr in the Bharat
Radiation band at 304A was caused by 9500 keV β energy (Eβmax) of 133In present in solar flare over the site marked
by yellow arrow in Bharat Radiation image at 304A. Simultaneously a line appeared at 21:00 hr in spectral band at
335A. It is to note that these two lines at 304A Bharat Radiation and 335A EUV originate from two different short
lived fission products. A small bright solar flare visible in all images of Sun in Fig.6 has caused a sharp line both in
the X-ray band at 94A and EUV band at 335A at around 14:30 hr suggesting X-rays at 94A and some X-ray
wavelengths close to 94A have caused Bharat Radiation, in turn the EUV at 335A within the small sized flare solar flare. Though the site is visible even at other wavelengths, lines appeared only at two wavelengths 94A and 335A.
Probably all the Bharat Radiation photons were spent in causing EUV line at 335A by valence excitation.
X-ray image at 94°A
Bharat Radiation
image at 131 °A
Bharat Radiation
image at 171°A
Bharat Radiation image at 193°A
Bharat Radiation image at 211°A
Bharat Radiation image at 304°A
EUV image at 335°A
Fig.6. AIA Spectral bands and SDO/AIA images of Sun measured on 8th January 2012.
Discovery of Self-Sustained 235
U Fission Causing Sunlight by Padmanabha Rao Effect
www.iosrjournals.org 20 | Page
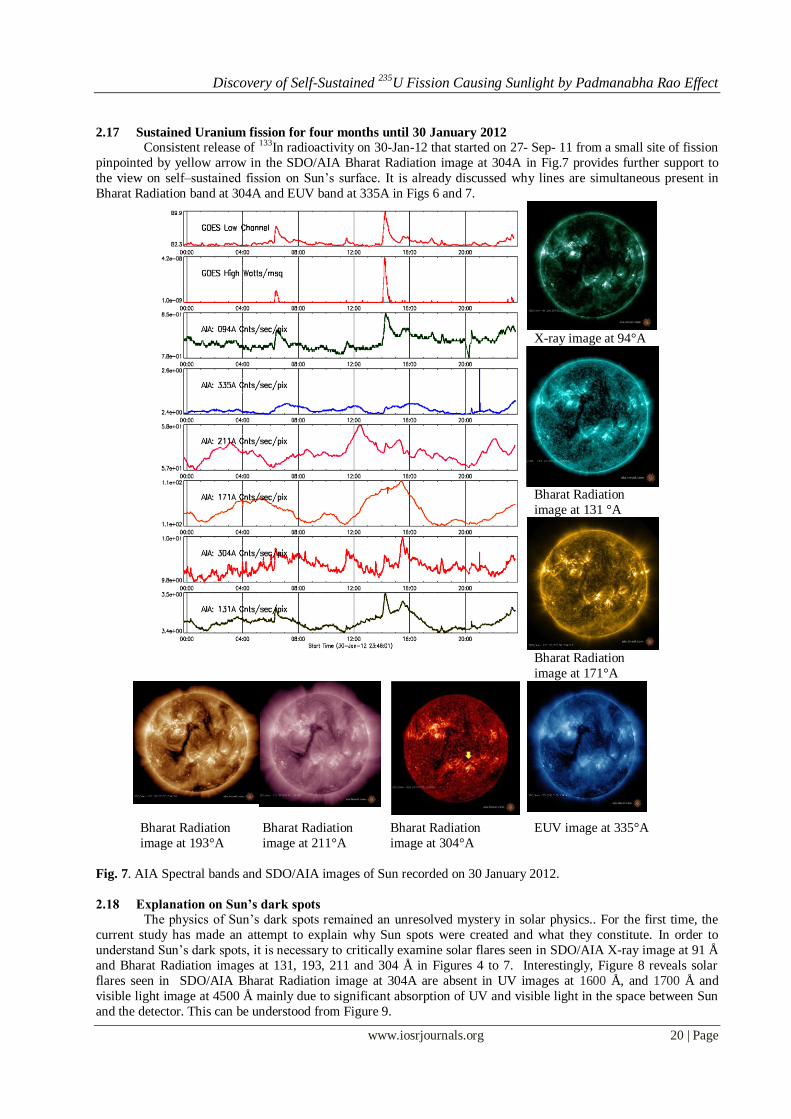
2.17 Sustained Uranium fission for four months until 30 January 2012
Consistent release of 133In radioactivity on 30-Jan-12 that started on 27- Sep- 11 from a small site of fission
pinpointed by yellow arrow in the SDO/AIA Bharat Radiation image at 304A in Fig.7 provides further support to
the view on self–sustained fission on Sun‘s surface. It is already discussed why lines are simultaneous present in
Bharat Radiation band at 304A and EUV band at 335A in Figs 6 and 7.
X-ray image at 94°A
Bharat Radiation
image at 131 °A
Bharat Radiation
image at 171°A
Bharat Radiation
image at 193°A
Bharat Radiation
image at 211°A
Bharat Radiation
image at 304°A
EUV image at 335°A
Fig. 7. AIA Spectral bands and SDO/AIA images of Sun recorded on 30 January 2012.
2.18 Explanation on Sun’s dark spots
The physics of Sun‘s dark spots remained an unresolved mystery in solar physics.. For the first time, the
current study has made an attempt to explain why Sun spots were created and what they constitute. In order to
understand Sun‘s dark spots, it is necessary to critically examine solar flares seen in SDO/AIA X-ray image at 91 Å
and Bharat Radiation images at 131, 193, 211 and 304 Å in Figures 4 to 7. Interestingly, Figure 8 reveals solar
flares seen in SDO/AIA Bharat Radiation image at 304A are absent in UV images at 1600 Å, and 1700 Å and
visible light image at 4500 Å mainly due to significant absorption of UV and visible light in the space between Sun
and the detector. This can be understood from Figure 9.

Discovery of Self-Sustained 235
U Fission Causing Sunlight by Padmanabha Rao Effect
www.iosrjournals.org 21 | Page
Sun‘s dark spots in Bharat Radiation image of
Sun at 304A reported by Michael Rundle [26].
Sun‘s dark spots in enlarged SDO/AIA UV
image of Sun at 1600 Å on 1 August 2011
Sun‘s dark spots in enlarged SDO/AIA UV
image of Sun at 1700 Å on 1 August 2011
Sun‘s dark spots in SDO/AIA visible light
image of Sun at 4500 Å on 1 August 2011
Fig. 8. Enlarged images of the Sun. Top row, left: Sun‘s dark spots in Bharat Radiation image of Sun at 304A
reported by Michael Rundle [26]. The rest are SDO/AIA images of the Sun recorded on 1 August 2011. Top row, right: Sun‘s dark spots in UV image at 1600Å. Bottom row, left: Sun‘s dark spots in UV image at 1700Å. Bottom
row, right: Dark Sun spots in visible light image at 4500 Å. Insert : An enlarged view of the two Sun spots at the
extreme left in visible light image at 4500 Å.
Fig.8 shows Sun‘s dark spots in the SDO/AIA Bharat Radiation image at 304A, in enlarged UV images of
Sun at 1600A and 1700A, and visible light image at 4500A. Dark Sun spots are clearly seen at 1600 and 1700 Å
because of the surrounding bright tiny UV sources looking like rings or chemical structures. The pointed sources
might be deposits of nuclear fallout comprising of long lived fission products like 137Cs and 90Sr into some cracks
developed on Sun‘s surface surrounding the dark fission sites. Although UV intensity of pointed sources such as 137Cs was reported to be as high as 96.64% in gross light intensity, most UV would be absorbed in the space
between Sun and the detector [10]. Ring like tiny bright areas seen at UV are totally absent in visible light image at 4500 Å, which shows a dim visible light throughout Sun‘s disk. It is because % visible and near infrared radiation
intensities from sources such as 137Cs remain just at 3.22% and 0.14% respectively. Significant absorption of visible
light in the space between Sun and the detector was the reason why Sun‘s disk appears very dim in visible light
image at 4500A. Sun‘s dark spots are not seen at X-ray and EUV probably because solar flare generally masks the
dark spots at these wavelengths. Sun‘s dark spots seem to form when uranium fission lifts away a large chunk of
Sun‘s core material along with fission fragments into nuclear fallout. A large crater formed at the site of fission
appears as Sun‘s dark spot since no emission takes place from the site, while the remaining Sun‘s disk show very
low intensity at Bharat Radiation, UV and visible light wavelengths.

Discovery of Self-Sustained 235
U Fission Causing Sunlight by Padmanabha Rao Effect
www.iosrjournals.org 22 | Page
Fig. 9. Solar spectra measured by Hinteregger et al. at 103, 120, 134, 147, 170 and 198 km heights over New
Mexico on 29 January 1960 [3]. The broad peak on the right side slowly fallen to base level somewhere at 128.7 A
represents X-rays [1]. The wavelengths from 128.7 A to 304A represent Bharat Radiation.
2.19 Absorption of X-rays and Bharat Radiation in space Fig.9 demonstrates absorption of X-rays and Bharat Radiation in the upper atmospheres of the Earth. Solar
X-rays could be detected well up to 103 km height. In contrast, Bharat Radiation at longer wavelengths could be detected only up to 134 km. From this data it is understandable why there has been a fall in intensity of 335A EUV
spectral band in Figs 4 to 7 and why the image at 335 Å showed a uniform fall in brightness as compared to images
at 94 and 131 Å. Relatively more absorption of UV in space seemed to be the main cause why UV images at 1600
and 1700 Å failed to display the solar flare. Because of longer wavelengths, absorption of visible light in solar
atmosphere has been the maximum, adding one more problem to the low intensity emission from radioisotopes. The
UV and visible light images of the Sun provided a valuable information, though the spectral bands in Figs 4 to 7 did
not include spectral bands at UV (1600 Å, and 1700 Å) and visible light (4500 Å).
2.20 Discovery of dark matter on Sun’s surface
There are two reasons to believe that Sun‘s dark spots might provide the first evidence on true existence of
the familiar dark matter. (i) The biggest Sun spots estimated to be almost six times to the size of Earth [26] coincides with the general opinion that sizable fraction of the Universe constitutes Dark Matter [27, 28]. (ii) It is also believed
that dark matter doesn‘t release light [28]. In support of this view, images of Sun in Fig. 8 have provided evidence
that Sun‘s dark spots do not emit Bharat radiation, UV and visible light. Pasquale Dario Serpico and Dan Hooper
reviewed prospects for the Fermi satellite (formerly known as GLAST) to detect gamma rays from dark matter [29].
However, this seems to be not possible since fission products would be thrown out from the site during fission
reaction, so the site appears as Sun‘s dark spot in the absence of any known radiation emission. Therefore,
immediately after fission, the Sun‘s core material in the crater formed at the site of fission devoid of any emission
might be the familiar dark Matter.
2.21 A typical Phenomenon in solar flare
As the fission products in fallout remain as radioisotopic ions, they exhibit peculiar behavior. Very surprisingly, the solar flares from site 1 and 2 were attracted each other towards their centre, while no spread of solar
flares on the right side of site 1 and left side of site 2 in Fig.8 top left. This is because excited atoms in fission
products which remain in highly ionized state in solar atmosphere seem to exhibit a phenomenon of mutual
attraction. That is why these two fallouts (solar flares) formed a cloud of radioisotopic ions in the SDO/AIA image
at 304A. Typically radioactive cloud was able to travel hundreds of kilometers after Chernobyl accident.
2.22 Sources of Sunlight to Earth

Discovery of Self-Sustained 235
U Fission Causing Sunlight by Padmanabha Rao Effect
www.iosrjournals.org 23 | Page
Visible light image of the Sun at 4500°A in Fig. 8 show Sun‘s very poor visible light emission that cannot
account the abundant Sun light that Earth receives every day. On the other hand SDO/AIA Bharat radiation images
of Sun at 193 and 211A in Figs 4 to 7 show abundant Bharat Radiation at the periphery of Sun‘s disk indicating
escape of most Bharat radiation into solar atmosphere. Particularly, by virtue of high release of radioactivity of 131I
during Uranium fission, Table 2 disclose the Bharat Radiation intensity of 171 Å in solar atmosphere attained
maximum over all other wavelengths measured at different spectral bands in Figs. 4 to 7. 131I emits β, γ, and Xe X-
rays at different energies; therefore some of these energies not shown in Table 1 also might be causing different Bharat Radiation wavelengths. This is the case with all other radioisotopes listed in Table 1. Bharat Radiation can
also be caused by the following mechanisms. The high flux of γ energies resulted in fission can knock out core
electrons resulting into X-rays, which cause Bharat Radiation, in turn the EUV and UV dominant optical emissions.
When most core electrons are knocked away from excited atom leaving behind only one filled K-shell, the β, or γ
emission can exclusively cause Bharat Radiation from K-shell but Bharat Radiation cannot cause optical emission
from L shell in the absence of core electron as happens in the case of tritium, 3H [10]. Bharat Radiation might be
generating EUV intensity up to 130 km above Earth‘s surface but its absorption in Earth‘s atmosphere is very likely.
This raises a doubt that all the intense bright light what Earth receives everyday may not be directly from the Sun.
Table 2. Intensities of 94 Å X-rays, Bharat Radiation at 131, 171, 211, and 304 Å, and EUV at 335Å shown on Y
axis in AIA spectral bands on three different days disclose maximum intensity is from 171A Bharat Radiation emission due to presence of fission product 131I in solar flares..
solar spectrum at
01-Nov-11 Intensity range
30-Jan-12 (Fig.7) Intensity range
6-Mar-12 (Fig.4) Intensity range
94 Å 1.1e+00 - 1.3e+00 7.8 e_01 - 8.5 e_01 8.2e-01 – 6.5e+00
131 Å 4.3e+00 - 4.8 e+00 3.4 e+00 - 3.5 e+00 3.3e+00 – 3.6e+01
171 Å 1.4e+02 - 1.4e+02 1.1 e+02 - 1.1 e+02 9.8e+01 – 1.3e+02
211 Å 6.8e+01 – 7.1e+01 5.7 e+01 - 5.8 e+01 5.1e+01 – 6.1e+01
304 Å 1.0e+01 – 1.1e+01 3.4 e+00 - 3.5 e+00 9.5e+00 – 1.7e+01
335 Å 3.6e+00 – 3.9e+00 2.4 e+00 - 2.6 e+00 2.2e+00 – 4.2e+00
2.23 Radiations responsible for Sunlight.
Very low intensity seen throughout Sun‘s disk in visible light image of Sun UV in Figure 8 does not
account the bright Sunlight received on Earth.
Sun‘s Bharat Radiation can be detected above 130 km height from the Earth‘s surface as can be evident from Fig.9. Therefore, up to 130 km height Sun‘s Bharat Radiation might be causing EUV, UV, visible, near
infrared and infrared radiations by valence excitation in radioisotopic ion cloud going towards Earth. However, there
is a possibility much of EUV, UV, visible, near infrared and infrared radiations produced thus to be absorbed in
space before reaching Earth. For example, infrared can be observed at high altitudes but cannot reach surface of the
Earth due to absorption [34].
Most importantly, the fission fragments and their energetic β, γ and X-ray emissions can penetrate Earth‘s
atmosphere within 130 km height and reach very close to the Earth‘s surface and contribute to most Sunlight. This
new study unfolds that cosmic rays constitute mostly the ionizing radiations arising from uranium fission on Sun‘s
surface. Solar γ, β, or X-ray generate Bharat radiation that in turn causes EUV, UV, visible, near infrared and
infrared radiations within the excited atoms of fission products arrived into Earth‘s atmosphere. Northern lights is a
clear example to this. Moreover, the EUV also may degrade into UV, visible, near infrared and infrared radiations in
the Earth‘s atmosphere. There is a reason why uranium fission is able to provide abundant Sunlight to the Earth. The amount of uranium involved for fission reaction is comparable to the size of Earth that can be understood from a
large sized Sun‘s dark spot in Fig.8. In nutshell, the source to the most Sun light is the Bharat Radiation produced
within 130 km above Earth‘s atmosphere by penetrating Sun‘s β, γ and X-ray emissions.
Earth‘s magnetism also seems to play a key role in the distribution of Sunlight. Along with γ, β, or X-ray low
wavelength Bharat radiation seems to reach Earth and more towards North and South poles. As a result areas close
to North and South poles receive abundant UV while tropical countries or regions receive more of visible, near
infrared, and infrared radiations.
References [1] M.A.Padmanabha Rao, Discovery of Sun‘s Bharat Radiation emission causing Extreme Ultraviolet (EUV) and UV dominant optical
radiation, IOSR Journal of Applied Physics, IOSR-JAP, e-ISSN: 2278-4861.Volume 3, Issue 2 (Mar. - Apr. 2013), p 56-60.
http://www.iosrjournals.org/iosr-jap/papers/Vol3-issue2/H0325660.pdf
[2] T. N. Woods, et al., New solar extreme-ultraviolet irradiance observations during flares, The Astrophysical Journal, 739, 59, 2011, 1-
13.http://iopscience.iop.org/0004-637X/739/2/59/pdf/0004-637X_739_2_59.pdf
[3] H. E. Hinteregger, L. A. Hall, and W. Schweizer, Solar XUV-Spectrum from 310 Å to 55 Å, Astrophysical Journal, 140, 1964, 319-326.
http://adsabs.harvard.edu/full/1964ApJ...140..319H

Discovery of Self-Sustained 235
U Fission Causing Sunlight by Padmanabha Rao Effect
www.iosrjournals.org 24 | Page
[4] I. A. Zhitnik, S. V. Kuzin, A. M. Urnov, I. L. Beigman, S. A. Bozhenkov, and I. Yu. Tolstikhina, Extreme Vacuum Ultraviolet Solar
Spectra Obtained during the SPIRIT Experiment aboard CORONAS-F: A Catalog of Lines in the Range 280–330˚A, Astronomy Letters,
Vol. 31, No. 1, 2005, pp. 37–56. Translated from Pis’ma v Astronomicheski˘ı Zhurnal, Vol. 31, No. 1, 2005, 39–58.
http://www.tesis.lebedev.ru/en/docs/1376.pdf
[5] Giulio Del Zanna, Solar spectral analysis, How to measure Te from XUV spectroscopy, 15th ADAS Worshop, Armagh 2010.
http://www.adas.ac.uk/2010talks/2010_ADAS_GDelZanna.pdf
[6] M.A.Padmanabha Rao, X-ray source emits not only X-rays but also low energy electromagnetic radiation. Presented in 1998 Symposium
on Radiation Measurements and Applications, The University of Michigan, Ann Arbor, U.S.A., 1998, Abstract 3PW26.
http://www.angelfire.com/sc3/1010/michigan1998.html
[7] M.A.Padmanabha Rao, Possible biological effects by UV radiation newly detected from internally administered radioisotopes. in
Proceedings of the Symposium on Low Level Electromagnetic Phenomena in Biological Systems (BIOSYS-’99), (Eds) Jitendra Behari
and Indian Journal of Biochemistry and Biophysics, (National Institute of Science Communication, New Delhi-110012), 1999, 68-72.
http:/www.angelfire.com/sc3/1010/uvdosimetry.html
[8] M.A.Padmanabha Rao, Discovery of light emission from XRF sources, Presented in 50th Annual Denver X-ray Conference, Steamboat
Springs, Colorado, U.S.A. 2011, Abstract F-01, p.124. http://www.dxcicdd.com/01/pdf/F-01.pdf
[9] M.A.Padmanabha Rao, Solar X-rays, gamma rays, and electrons cause EUV by a previously unknown atomic phenomenon, in
Proceedings of the 7th International Conference on Human Ecology and Nature (HEN2008), (Ed) Vladimir V.Zaitsev, Moscow-
Ples, Russia, (Moscow Scientific and Industrial Association ―Radon‖, 2008), 45. http://www.angelfire.com/sc3/1010/Solarfission.html
[10] M.A.Padmanabha Rao, UV dominant optical emission newly detected from radioisotopes and XRF sources, Braz. J. Phy., 40, no 1,
2010, 38-46 http://dx.doi.org/10.1590/S0103-97332010000100007
[11] Margaret West., et al. , Atomic spectrometry update-X-ray fluorescence spectrometry, J. Anal. At. Spectrom., 26, 2011, 1919- 1963.
DOI: 10.1039/C1JA90038B
[12] M.A.Padmanabha Rao, Bharat radiation and UV dominant optical radiation emissions discovered from radioisotopes and XRF (X-ray
fluorescent) sources, Discovery, Vol 4, Number 10, April 2013. p 5-9 http://www.discovery.org.in/PDF_Files/d_20130402.pdf
[13] UNSCEAR 1988 REPORT, ANNEX D, Exposures from the Chernobyl accident. http://www.unscear.org/docs/reports/1988annexd.pdf
[14] Environmental consequences of the Chernobyl accident and their remediation: Twenty years of experience, Report of the Chernobyl
Forum Expert Group ‗Environment‘, International Atomic Energy agency, Vienna, 2006. http://www-
pub.iaea.org/MTCD/publications/PDF/Pub1239_web.pdf
[15] P. Misaelides, C. Sikalidis, R. Tsitouridou, C. Alexiades, Distribution of fission products in dust samples from the region of
Thessaloniki, Greece, after the Chernobyl nuclear accident, Environmental Pollution, Volume 47, issue 1 (1987), p. 1-8. ISSN: 0269-
7491 DOI:10.1016/0269-7491(87)90117-5
[16] Chernobyl: Assessment of Radiological and Health Impacts 2002 Update of Chernobyl: Ten Years On, Nuclear Energy Agency
Organisation for Economic Co-operation and Development. http://www.oecd-nea.org/rp/reports/2003/nea3508-chernobyl.pdf
[17] P.R. J. Saey, and L. E. De Geer, Notes on radioxenon measurements for CTBT verification purposes, Appl Radiat Isot, Volume 63,
Issues 5–6, November–December 2005, 765–773. http://www.sciencedirect.com/science/article/pii/S0969804305001624
[18] Y. Gavrilin, V. Khrouch, S. Shinkarev, V. Drozdovitch, V. Minenko, E. Shemiakina, et al. Individual thyroid dose estimation for a case-
control study of Chernobyl-related thyroid cancer among children of Belarus—part I: 131
I, short-lived radioiodines (132
I, 133
I, 135
I), and
short-lived radiotelluriums (131M
Te and 132
Te). Health Phys. 86(6), 2004, 565–585. http://www.ncbi.nlm.nih.gov/pubmed/15167120
[19] Chernobyl: Looking Back to Go Forward, Proceedings of an International Conference held in Vienna, 6–7 September 2005, Proceedings
Series - International Atomic Energy Agency. STI/PUB/1312 (ISBN:978-92-0-110807-4) 245 pp.
http://www-pub.iaea.org/books/IAEABooks/7717/Chernobyl-Looking-Back-to-Go-Forward-Proceedings-of-an-International-
Conference-held-in-Vienna-6-7-September-2005
[20] E. I. Vaplrev, G. Georgiev, T. Jordanov, A. V. Hristova, Estimation of the total fallout of 90
Sr and 137
Cs over the territory of Bulgaria
after the Chernobyl accident, Bulgarian Journal of Physics 23 Nos 3/4 (1996) 129-147,
http://jasosx.ils.uec.ac.jp/BJP/pdf/BJP1996/BJP_1996_3-4/BJP_1996_3-4_129.pdf
[21] ANNEX J, Exposures and effects of the Chernobyl accident. http://www.unscear.org/docs/reports/annexj.pdf
[22] V.T.Khrushch et al., Characteristics of radionuclide intake by inhalation, in Proceedings of All –Union Conference on Medical aspects of
the Chernobyl accident, organized by the USSR Ministry of Health and the All –union Scientific Centre of Radiation Medicine, USSR
Academy of Medical Sciences, Kiev, 11-13 May 1988. IAEA-TECDOC-516. (ISSN 1011-4289) Printed by the IAEA in Austria July
1988) pages 117- 132.
[23] V.A. Knizhnikov et al., Intake of radionuclides through food chains as a factor in the exposure of the Soviet population after the
Chernobyl accident, in Proceedings of All –Union Conference on Medical aspects of the Chernobyl accident, organized by the USSR
Ministry of Health and the All –Union Scientific Centre of Radiation Medicine, USSR Academy of Medical Sciences, Kiev, 11-13 May
1988. IAEA-TECDOC-516. (ISSN 1011-4289) Printed by the IAEA in Austria July 1988, pages 101-116.
[24] M.A.Padmanabha Rao, and Kanaram Senver, Radioactive gases at Jodhpur from Chernobyl accident, presented at National Conference
on Radiation Protection, 1991 at Tarapur, Maharashtra State, India, IARP/18/32. http://www.angelfire.com/sc3/1010/resume.html
[25] The Sun Today. http://sdowww.lmsal.com/suntoday/index.html?suntoday_date=2011-08-01#
[26] Michael Rundle, Monster' Sun Spots Could Lead To Massive Solar Storms, Huffington Post UK, 21/02/2013
http://www.huffingtonpost.co.uk/2013/02/21/nasa-discovers-colossal-sun-spot_n_2731053.html.
[27] Clip Tycles, The Matter With Dark Matter, Astronomy Records, March 14, 2009.
http://astronomyrecords.com/the-matter-with-dark-matter/
[28] Ron Cowen, Survey finds no hint of dark matter near Solar System, Nature News, 19 April 2012 http://www.nature.com/news/survey-
finds-no-hint-of-dark-matter-near-solar-system-1.10494
[29] Pasquale Dario Serpico and Dan Hooper, Gamma rays from dark matter annihilation in the central region of the Galaxy, (2009) New J.
Phys. 11 105010 doi:10.1088/1367-2630/11/10/105010 http://iopscience.iop.org/1367-2630/11/10/105010
[30] P. K. Kuroda, On the nuclear physical stability of the uranium minerals," J. Chem. Phys. 25, 1956, 781- 782.
[31] P. K. Kuroda, On the infinite multiplication constant and the age of the uranium minerals, J. Chem. Phys. 25, 1956, 1295- 1296.
[32] P. K. Kuroda, Nuclear fission in the early history of the Earth, Nature 187, 1960, 36- 38
[33] Philip Ball, Are there nuclear reactors at Earth's core? Fission reactors may have been burning for billions of years. Published online 15
May 2008, Nature. doi:10.1038/news.2008.822 http://www.nature.com/news/2008/080515/full/news.2008.822.html
[34] Infrared, NASA Goddard Space Flight centre, Dictionary. http://imagine.gsfc.nasa.gov/docs/dict_ei.html#image