Embed Size (px)
Citation preview

Data Visualiza+on & Annota+on 8th Interna+onal Biocura+on Conference
24 April 2015 | Beijing, China
Rama Balakrishnan Saccharomyces Genome Database Gene Ontology Consor5um
Stanford University, CA, USA
Image by Mar5n Krzywinski. Lim et al. Genome Biol (2015) 16:18
Monica Munoz-‐Torres Berkeley Bioinforma5cs Open-‐Source Projects
Lawrence Berkeley Na5onal Lab, CA, USA

Outline 1. Introduc5on – Goals – Examples of genome visualiza5on tools
2. Panelists – Lorna Richardson: eMouseAtlas and Image Informa5cs
– Justyna Szostak: Curated Causal Biological Network Models
3. Discussion – Featuring you!
2
Biocura5on 2015 Data Visualiza5on & Annota5on
8th Interna5onal Biocura5on Conference
2

3
Biocura5on 2015 Data Visualiza5on & Annota5on
8th Interna5onal Biocura5on Conference
Goals of the workshop 1. To learn about tools available for human interpreta5on of
genomic data, specifically in the context of annota5on. 2. To open a space for discussion: genomic data are ever more
abundant and heterogeneous, with widely varied sources, produc5on techniques, and intrinsic experimental error. – How do we analyze these data? – What is the best way to interpret the stories the data are telling us? – How to put these together (overlay) visually? – Developers: what is the best way to disseminate and contribute code to
make tool development easier?
Then and Now Figures 49 Tables 27 References 452
4
Figures 1 Tables 0 References 6
4

Genomic Data: Heterogeneous & Abundant
• Structural: gene models, transcriptomes, RNAseq, differen5al expression, etc.
• Func5onal: gene ontology, interac5ons, phenotypes, SNPs, complexes, protein abundance, diseases, images, etc.
• Some examples . . .
5
Biocura5on 2015 Data Visualiza5on & Annota5on
8th Interna5onal Biocura5on Conference
5
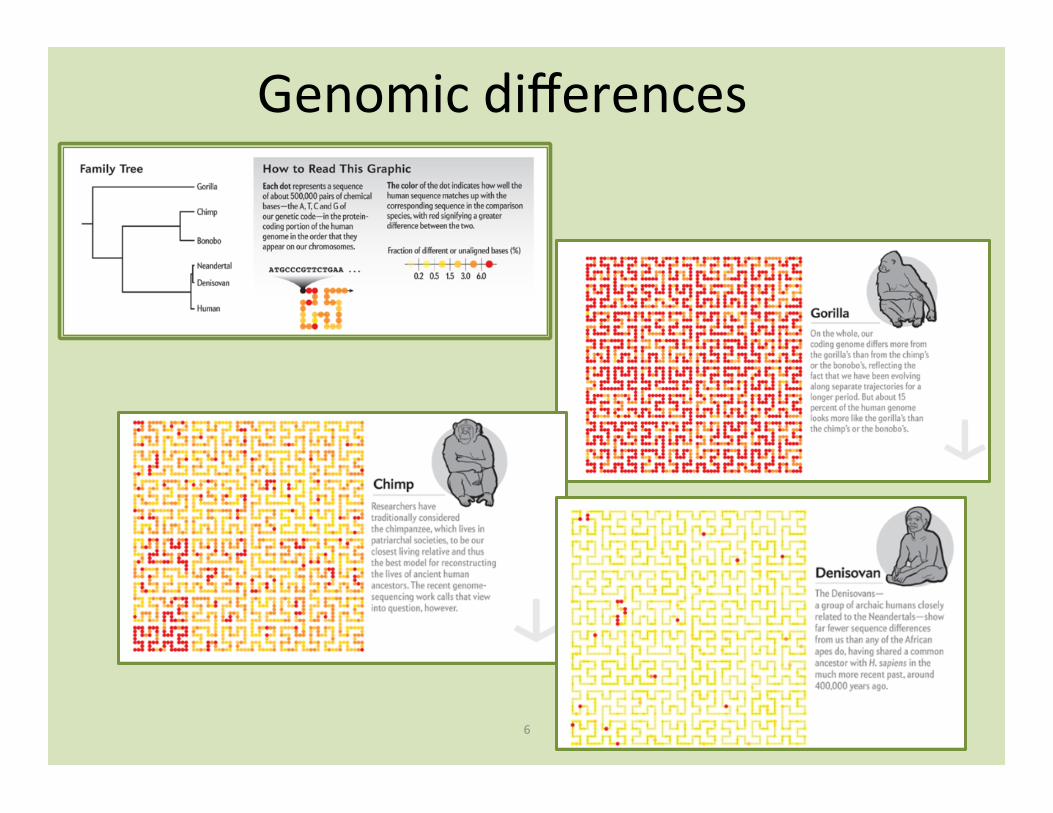
Genomic differences
6

Gene structure, ideograms, maps
7
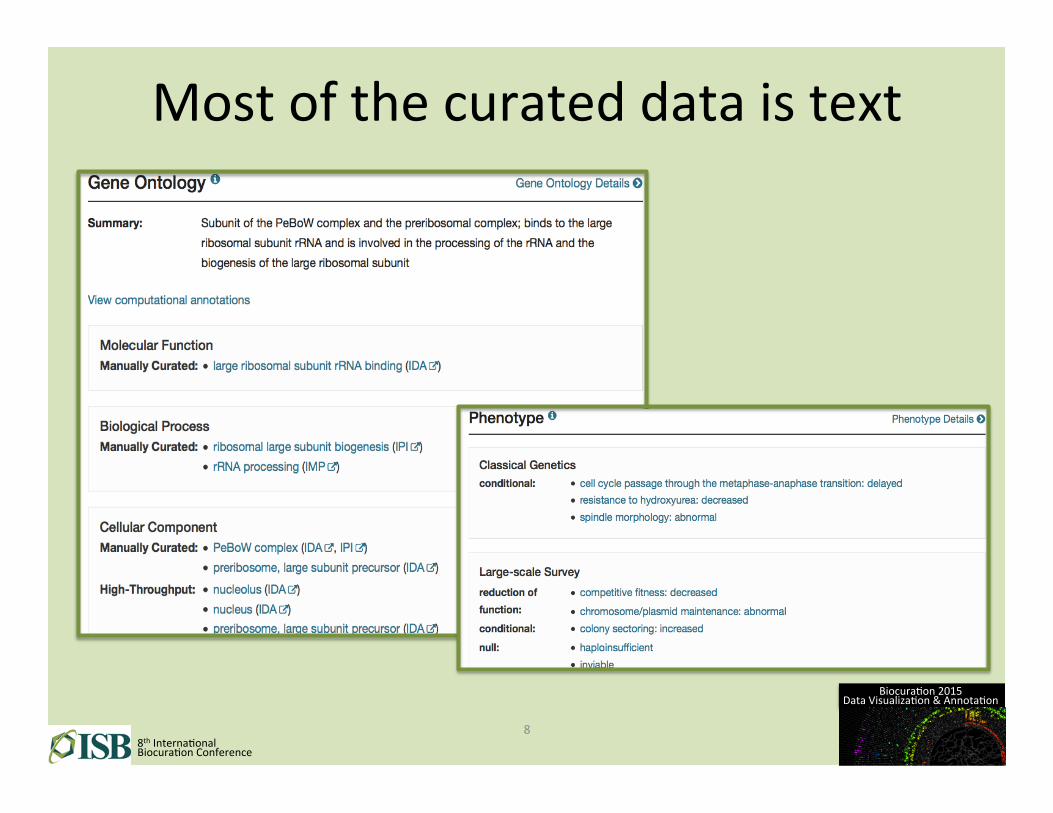
Most of the curated data is text
Biocura5on 2015 Data Visualiza5on & Annota5on
8th Interna5onal Biocura5on Conference
8

Visualizing interac5on data
Biocura5on 2015 Data Visualiza5on & Annota5on
8th Interna5onal Biocura5on Conference
9

Overlaying curated data
hgp://string-‐db.org

Complexes, interac5ons, and more Complex SGD_GO:0005955 calcineurin complex subunits
Interac5ons
hgp://3drepertoire.russelllab.org/ Biocura5on 2015 Data Visualiza5on & Annota5on
8th Interna5onal Biocura5on Conference
11

Phenotypes and diseases
hgp://monarchini5a5ve.org/ Biocura5on 2015
Data Visualiza5on & Annota5on
8th Interna5onal Biocura5on Conference
12

Sequence varia5ons
Sequence varia5on in various strains of S. cerevisiae
13

Molecular Model Edi5ng Environment Noctua – prototype from GOC -‐ Each node (box) is a func5on or process. -‐ Other nodes are folded in as OWL expressions. -‐ Users may add and drag elements -‐ Supports real 5me collabora5on
14

Understanding the Data
Much of the interpreta+on requires human judgment. Visualiza+on improves our
understanding and increases our chances of extrac+ng meaningful conclusions.
15
Biocura5on 2015 Data Visualiza5on & Annota5on
8th Interna5onal Biocura5on Conference
15
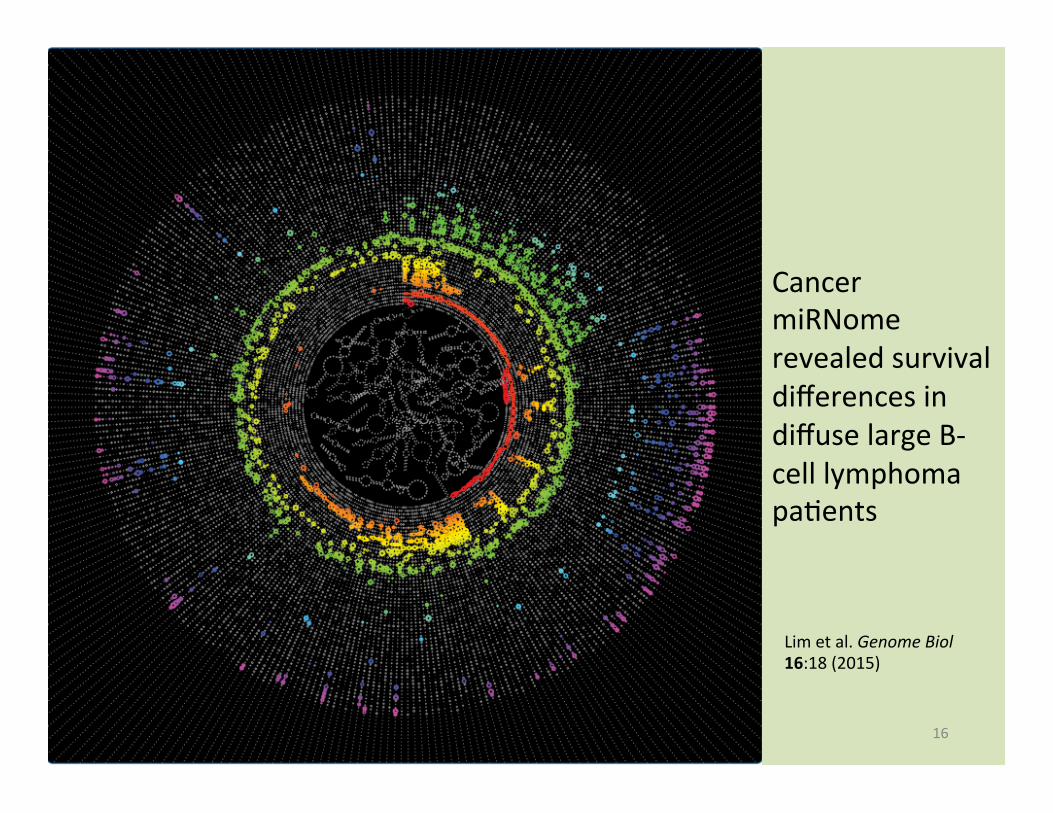
Cancer miRNome revealed survival differences in diffuse large B-‐cell lymphoma pa5ents
16
Lim et al. Genome Biol 16:18 (2015)

Circos
17
ENCODE
Circular Genome Data Visualiza+on -‐ Human placenta transcriptome -‐ Pancrea5c expression db -‐ Wall-‐sized High-‐res display for compara5ve analys. of CNV -‐ Chromosomal transloca5ons -‐ Variant iden5fica5on in mul5ple sclerosis -‐ Sorghum seedling development under Low Temp condi5ons -‐ Etc., etc., etc…

18

Visualizing sequencing data
19 Nielsen et al. Nature Met Suppl 7: 3s. (2010)
Biocura5on 2015 Data Visualiza5on & Annota5on
8th Interna5onal Biocura5on Conference

Genome Browsers
20 Nielsen et al. Nature Met Suppl 7: 3s. (2010)
Biocura5on 2015 Data Visualiza5on & Annota5on
8th Interna5onal Biocura5on Conference
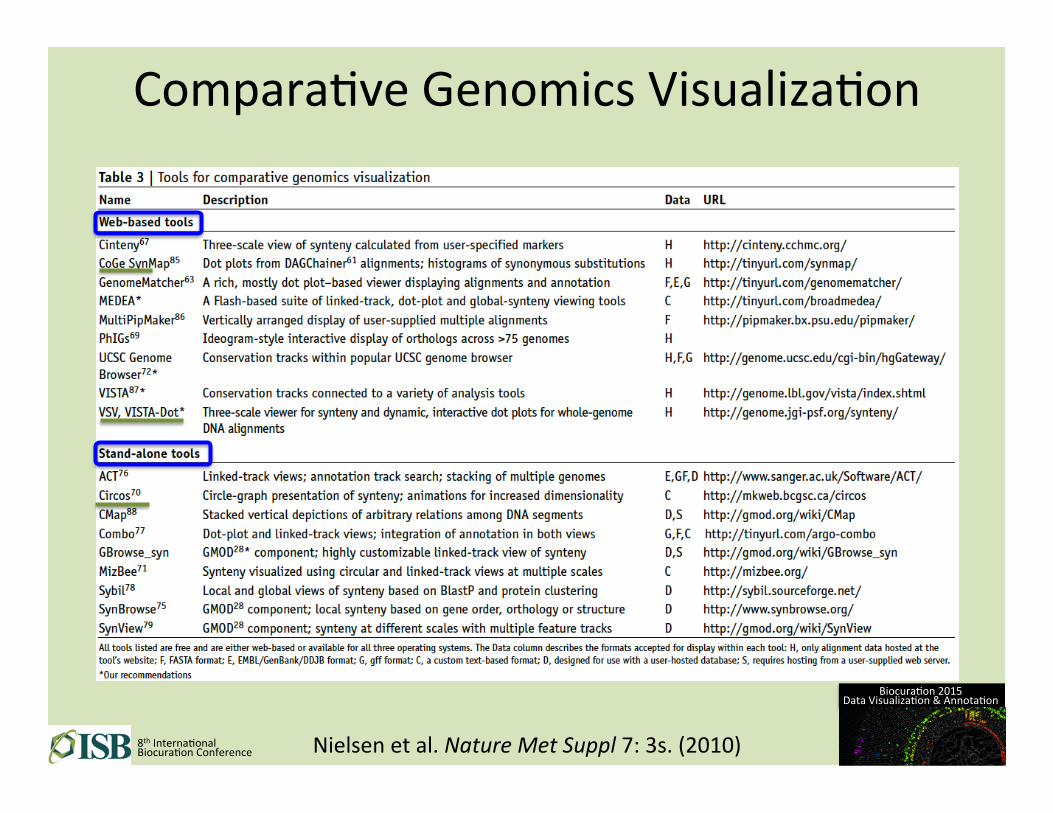
Compara5ve Genomics Visualiza5on
21 Nielsen et al. Nature Met Suppl 7: 3s. (2010)
Biocura5on 2015 Data Visualiza5on & Annota5on
8th Interna5onal Biocura5on Conference

Communica5ng Complex Data Focus on meaning instead of structure—anchor the figure to relevant biology rather than to methodological details.
1) What are the interes5ng findings, and what representa5on would communicate them clearly?
22
2) Forgo conven5onal approaches to displaying mul5dimensional data. Beger to project the data onto familiar visual paradigms, such as a protein network or pathway, to saliently show biological effects in a func5onal context.
Krzywinski and Savig. Nature Methods 10:7, 595 (2013)
Storytelling
• Relate your data using the age-‐old custom of telling a story. – Stories have the capacity to delight and surprise and to spark crea5vity by making meaningful connec5ons between data and the ideas, interests and lives of your readers.
23
Biocura5on 2015 Data Visualiza5on & Annota5on
8th Interna5onal Biocura5on Conference
23
Open-‐source: dissemina5on & contribu5ons
• Gene5c & genomic informa5on is more valuable when shared
• Promote and encourage Open Science: transparency, reproducibility, data provenance. E.g. Open Bioinforma5cs Founda5on hgp://open-‐bio.org
• Public repositories make solware easily accessible and allow collabora5ve efforts, e.g. GitHub
24
hgps://github.com/

25
Biocura5on 2015 Data Visualiza5on & Annota5on
8th Interna5onal Biocura5on Conference
Our Panelists 1. Lorna Richardson:
eMouseAtlas and Image Informa5cs
2. Justyna Szostak: Curated Causal Biological Network Models

![Annotation Graphs: A Graph-Based Visualization for Meta ......an open-source ESDA tool [5] to analyze simulations of building occupants and found that rich annotation support helped](https://img.dokumen.tips/doc/110x75/5f0bf4117e708231d433094b/annotation-graphs-a-graph-based-visualization-for-meta-an-open-source-esda.jpg)