Embed Size (px)
Citation preview

Convolutional Neural Network Architecture and Input Volume Matrix
Design for ERP Classifications in a Tactile P300-Based Brain-Computer Interface
1
Convolutional Neural Network Architecture and Input Volume Matrix
Design for ERP Classifications in a Tactile P300-Based Brain-Computer Interface
1
Takumi Kodama and Shoji Makino
Life Science Center of TARA, University of Tsukuba, Tsukuba, Japan
Introduction - What’s the BCI?
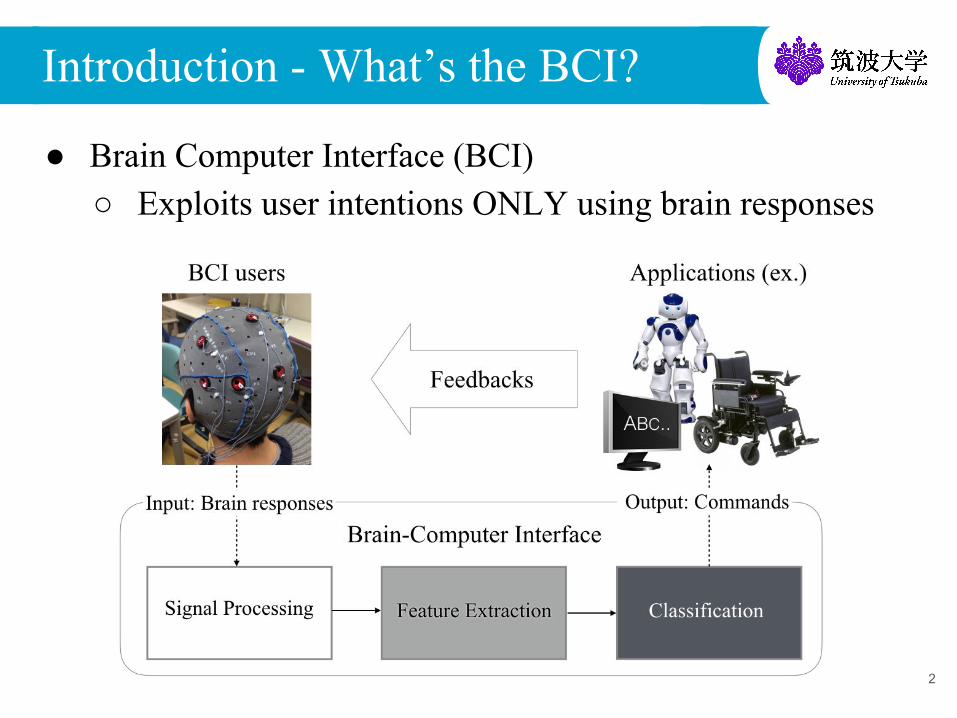
● Brain Computer Interface (BCI)○ Exploits user intentions ONLY using brain responses
2
Introduction - P300-based BCI
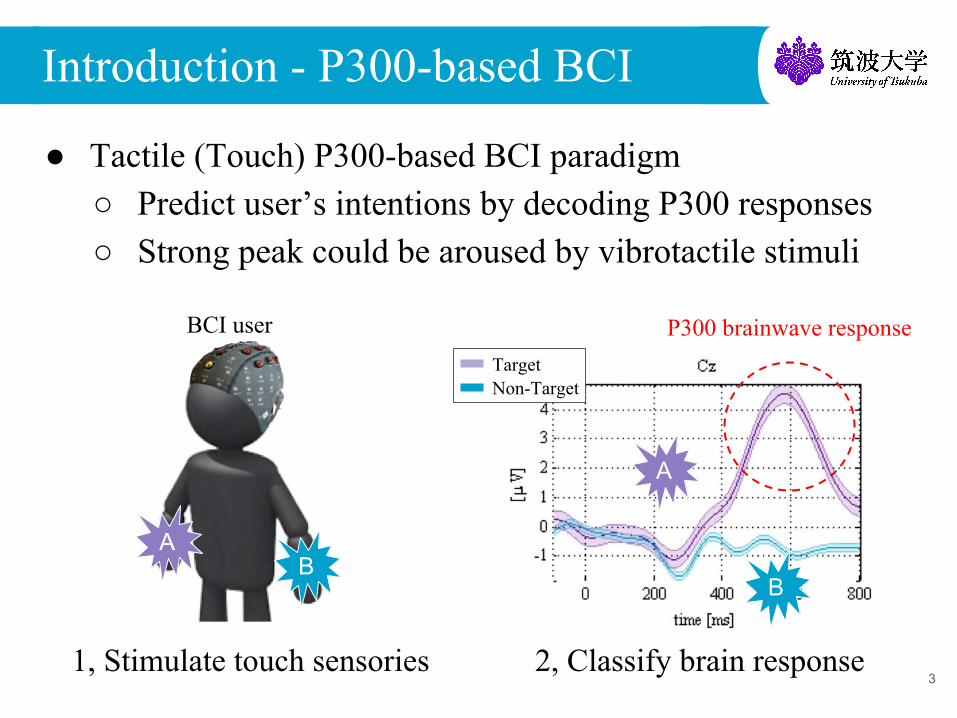
1, Stimulate touch sensories 2, Classify brain response
A
B
TargetNon-Target
P300 brainwave response
3
● Tactile (Touch) P300-based BCI paradigm○ Predict user’s intentions by decoding P300 responses○ Strong peak could be aroused by vibrotactile stimuli
BCI user
AB
Introduction - Our Approach
4
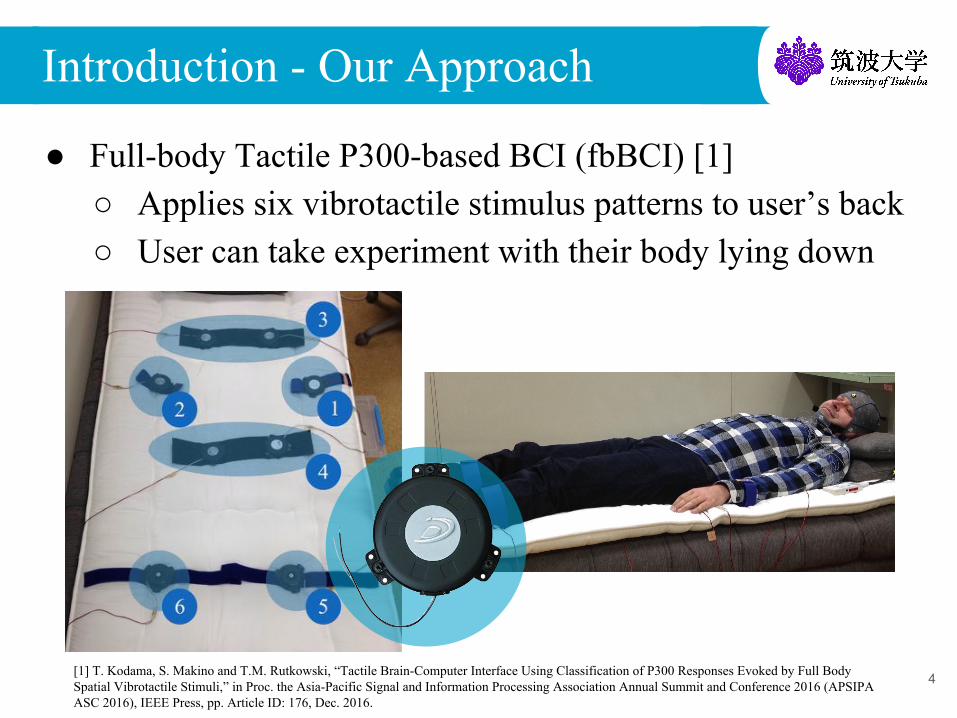
● Full-body Tactile P300-based BCI (fbBCI) [1]○ Applies six vibrotactile stimulus patterns to user’s back○ User can take experiment with their body lying down
[1] T. Kodama, S. Makino and T.M. Rutkowski, “Tactile Brain-Computer Interface Using Classification of P300 Responses Evoked by Full Body Spatial Vibrotactile Stimuli,” in Proc. the Asia-Pacific Signal and Information Processing Association Annual Summit and Conference 2016 (APSIPA ASC 2016), IEEE Press, pp. Article ID: 176, Dec. 2016.
[2] T. Kodama, K. Shimizu, S. Makino and T.M. Rutkowski, “Full–body Tactile P300–based Brain–computer Interface Accuracy Refinement,” in Proc. the International Conference on Bio-engineering for Smart Technologies 2016 (BioSMART 2016), IEEE Press, pp. 20–23, Dec. 2016.
Introduction - fbBCI exp. results
5
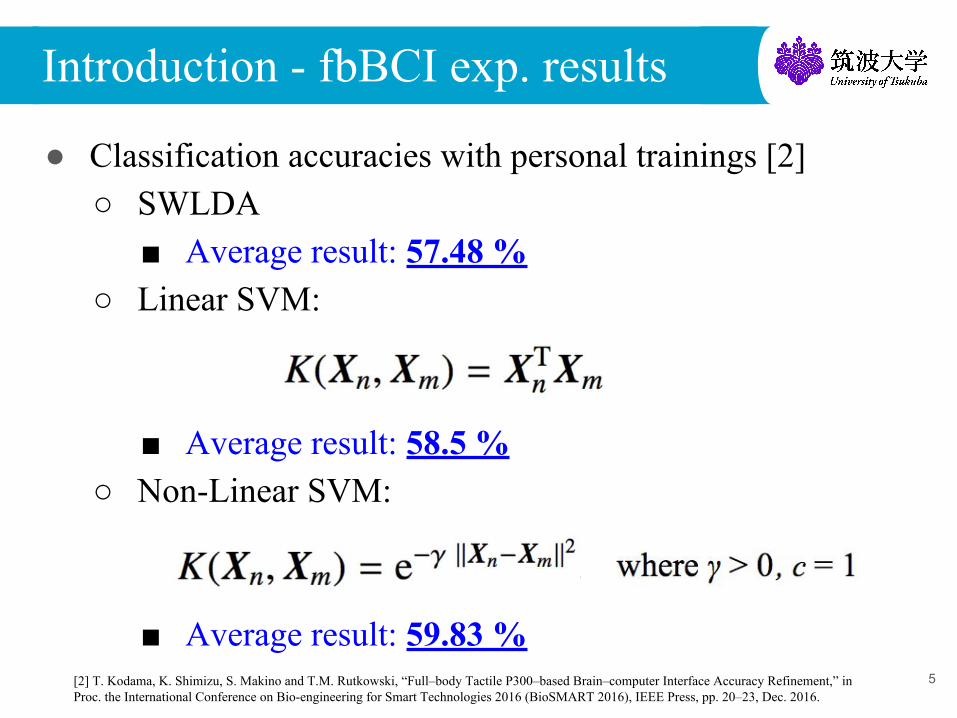
● Classification accuracies with personal trainings [2]○ SWLDA
■ Average result: 57.48 %○ Linear SVM:
■ Average result: 58.5 %○ Non-Linear SVM:
■ Average result: 59.83 %
[2] T. Kodama, K. Shimizu, S. Makino and T.M. Rutkowski, “Full–body Tactile P300–based Brain–computer Interface Accuracy Refinement,” in Proc. the International Conference on Bio-engineering for Smart Technologies 2016 (BioSMART 2016), IEEE Press, pp. 20–23, Dec. 2016.
Introduction - fbBCI results (2)
6
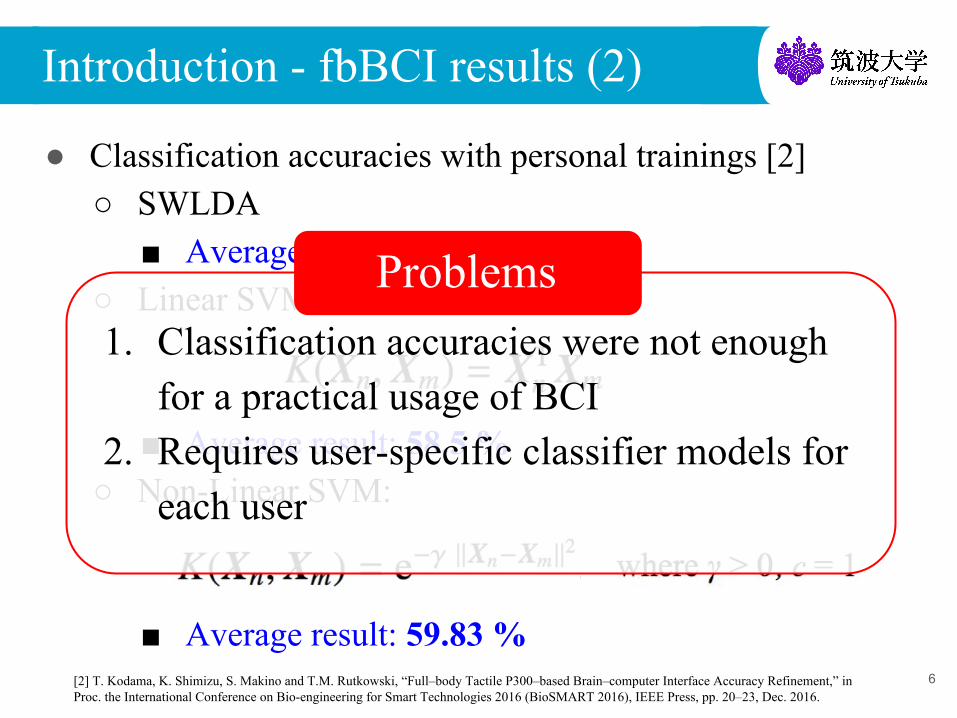
● Classification accuracies with personal trainings [2]○ SWLDA
■ Average result: 57.48 %○ Linear SVM:
■ Average result: 58.5 %○ Non-Linear SVM:
■ Average result: 59.83 %
1. Classification accuracies were not enough for a practical usage of BCI
2. Requires user-specific classifier models for each user
Problems

1. Confirm an effectiveness of the fbBCI modality by improving stimulus pattern classification accuracies
2. Achievement of non-personal-training ERP classifications using a neural network model
Introduction - Research Purpose
7

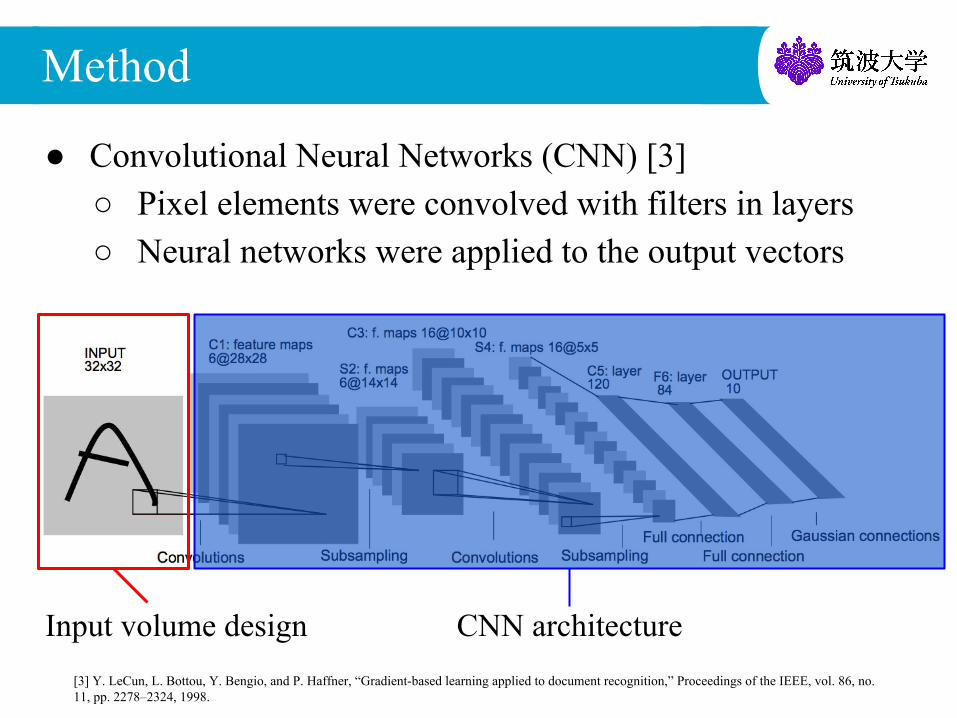
● Convolutional Neural Networks (CNN) [3]○ Pixel elements were convolved with filters in layers○ Neural networks were applied to the output vectors
Method
[3] Y. LeCun, L. Bottou, Y. Bengio, and P. Haffner, “Gradient-based learning applied to document recognition,” Proceedings of the IEEE, vol. 86, no. 11, pp. 2278–2324, 1998.
Input volume design CNN architecture
● Convolutional Neural Networks (CNN) [3]○ Pixel elements were convolved with filters in layers○ Neural networks were applied to the output vectors
Method
Input volume design CNN architecture[3] Y. LeCun, L. Bottou, Y. Bengio, and P. Haffner, “Gradient-based learning applied to document recognition,” Proceedings of the IEEE, vol. 86, no. 11, pp. 2278–2324, 1998.

● Transform ERP intervals to feature vectors
Ch○○
Method - Input volume design
1. Captures 800 ms long after vibrotactile stimulus onsets
2. Converts to feature vectors with their potentials
Method - Input volume design
11
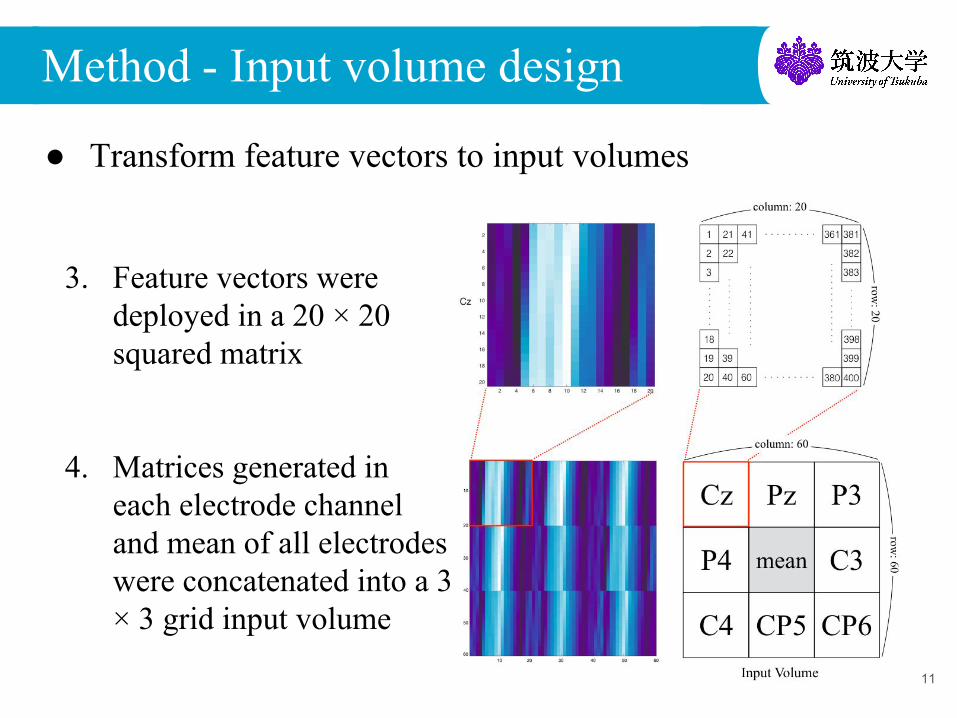
3. Feature vectors were deployed in a 20 × 20 squared matrix
4. Matrices generated in each electrode channel and mean of all electrodes were concatenated into a 3 × 3 grid input volume
● Transform feature vectors to input volumes

● Convolutional Neural Networks (CNN) [3]○ Pixel elements were convolved with filters in layers○ Neural networks were applied to the output vectors
Method
[3] Y. LeCun, L. Bottou, Y. Bengio, and P. Haffner, “Gradient-based learning applied to document recognition,” Proceedings of the IEEE, vol. 86, no. 11, pp. 2278–2324, 1998.
Input volume design CNN architecture

Method - CNN architecture
● Overview of CNN architecture in fbBCI○ CONV > POOL > CONV > POOL (LeNet)○ (Ix, Iy) … Size of the input volume○ (Ax, Ay) … Size of activation maps
13
MLP

● One-hidden layer multilayer perceptron○ Input: 7200 > Hidden: 500 > Output: 2 units
14
Method - CNN architecture
Method - Non-personal-trainings
15
User 1
12 3 4
7 8 9
Classifier model
trained by user 2~10
ERP classification
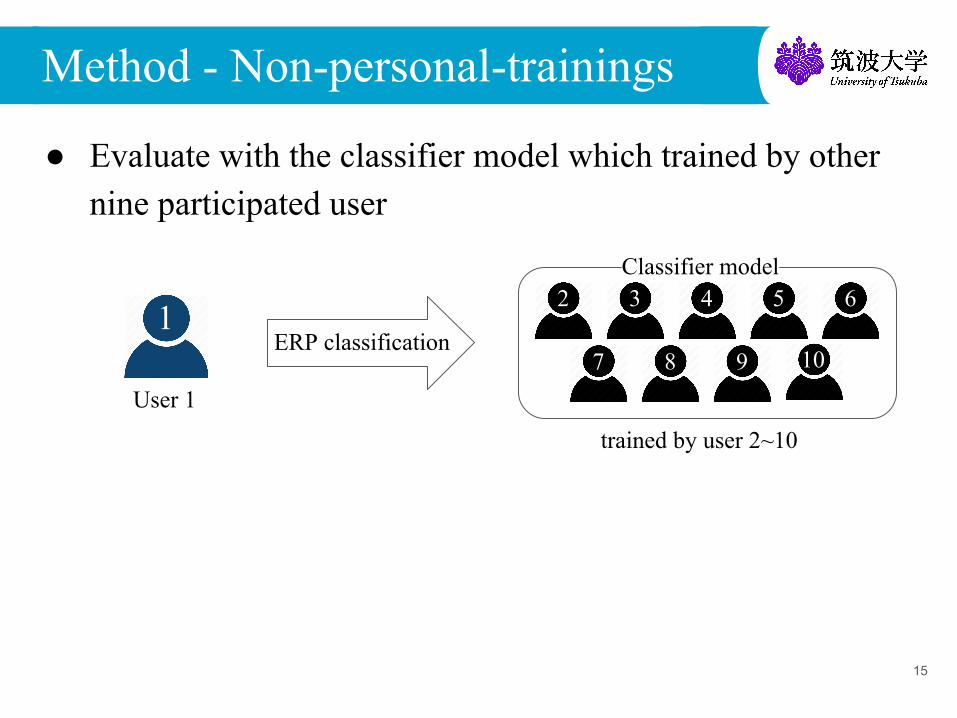
● Evaluate with the classifier model which trained by other nine participated user
5 6
10

Method - Non-personal-trainings
16
User 1
12 3 4
7 8 9
Classifier model
trained by user 2~10
ERP classification
● Evaluate with the classifier model which trained by other nine participated user
5 6
10
User 10
101 2 3
6 7 8
Classifier model
trained by user 1~9
ERP classification
4 5
9

Predicted condition
Non-Target Target
True conditionNon-Target 13.5424 % 86.5476 %
Target 2.5989 % 97.4011 %
● Non averaged ERP
● Moving averaged ERP
17
Results - Confusion matrix
Predicted condition
Non-Target Target
True conditionNon-Target 99.8576 % 0.1243 %
Target 0.0565 % 99.9435 %
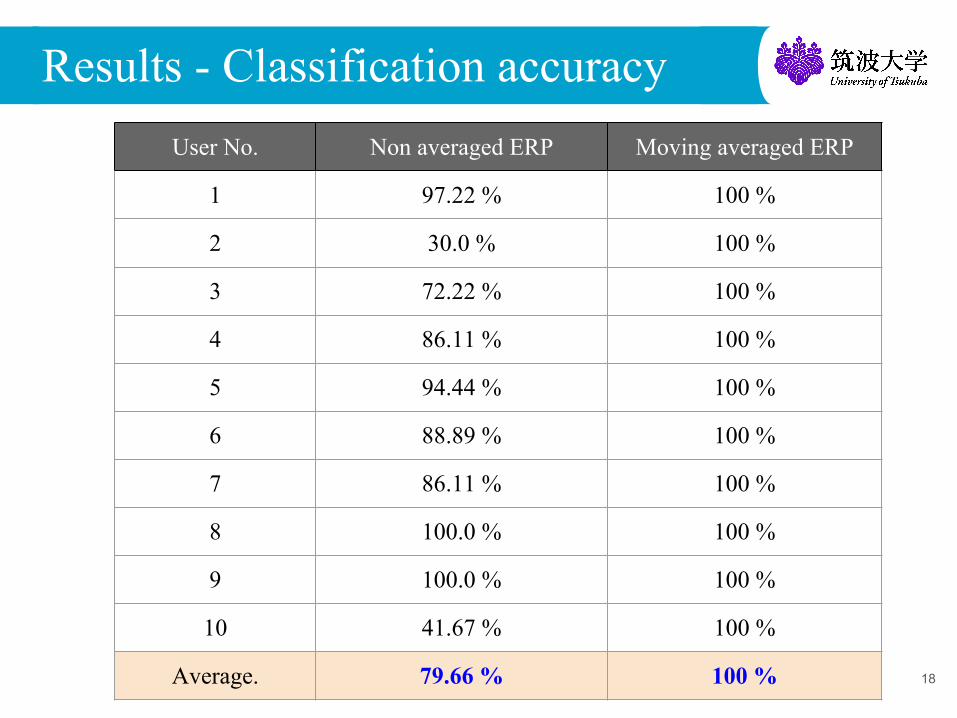
Results - Classification accuracy
18
User No. Non averaged ERP Moving averaged ERP
1 97.22 % 100 %
2 30.0 % 100 %
3 72.22 % 100 %
4 86.11 % 100 %
5 94.44 % 100 %
6 88.89 % 100 %
7 86.11 % 100 %
8 100.0 % 100 %
9 100.0 % 100 %
10 41.67 % 100 %
Average. 79.66 % 100 %
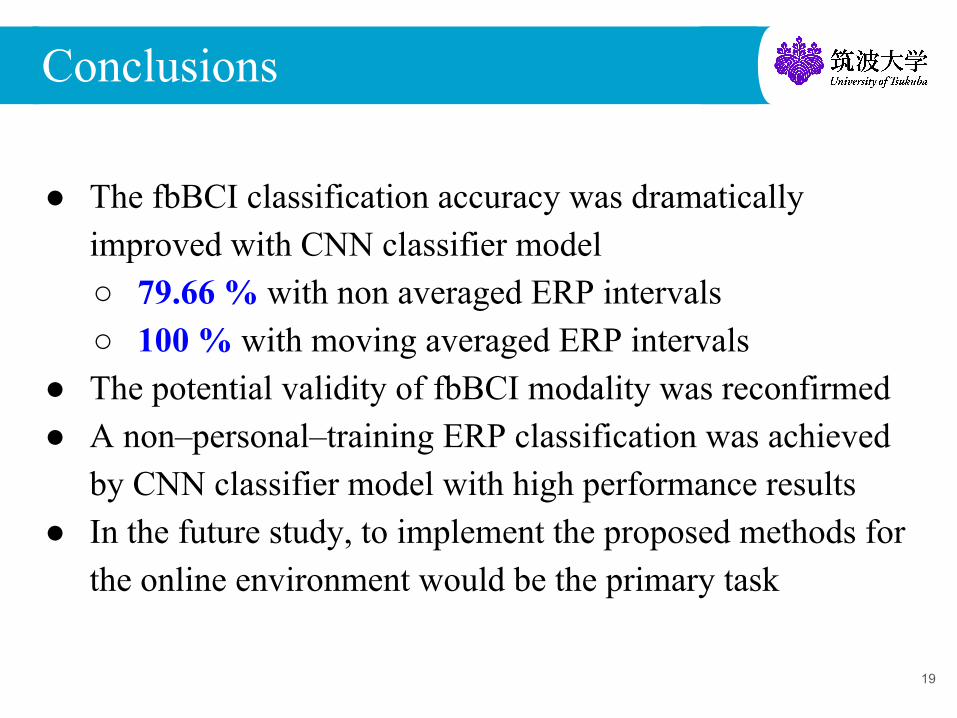
● The fbBCI classification accuracy was dramatically improved with CNN classifier model○ 79.66 % with non averaged ERP intervals○ 100 % with moving averaged ERP intervals
● The potential validity of fbBCI modality was reconfirmed● A non–personal–training ERP classification was achieved
by CNN classifier model with high performance results ● In the future study, to implement the proposed methods for
the online environment would be the primary task
Conclusions
19

20
Many thanks for your attention!
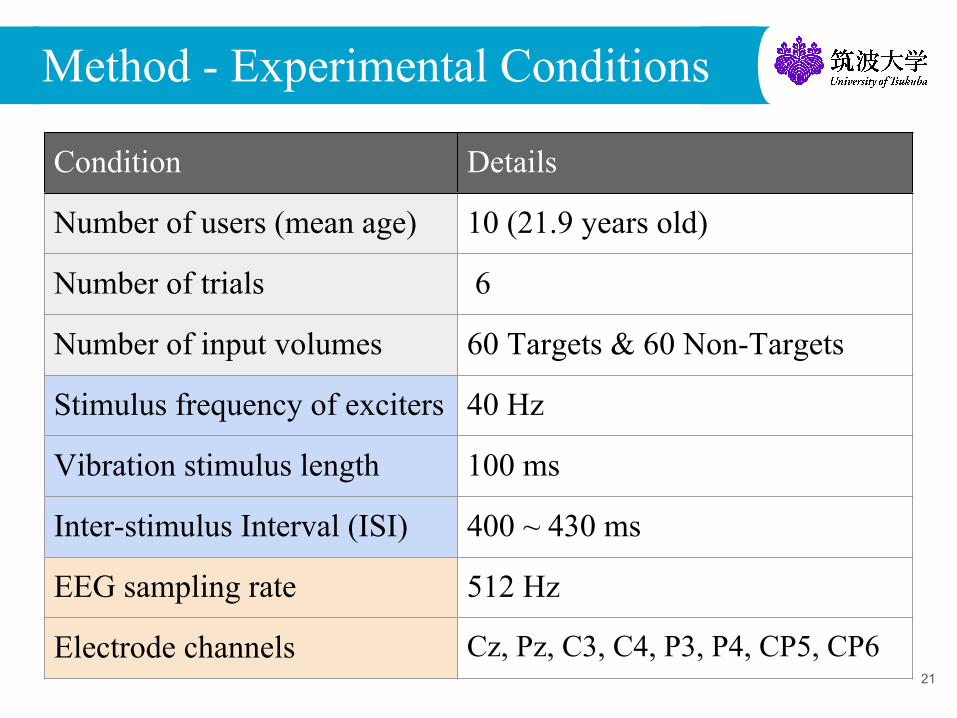
Method - Experimental Conditions
21
Condition Details
Number of users (mean age) 10 (21.9 years old)
Number of trials 6
Number of input volumes 60 Targets & 60 Non-Targets
Stimulus frequency of exciters 40 Hz
Vibration stimulus length 100 ms
Inter-stimulus Interval (ISI) 400 ~ 430 ms
EEG sampling rate 512 Hz
Electrode channels Cz, Pz, C3, C4, P3, P4, CP5, CP6
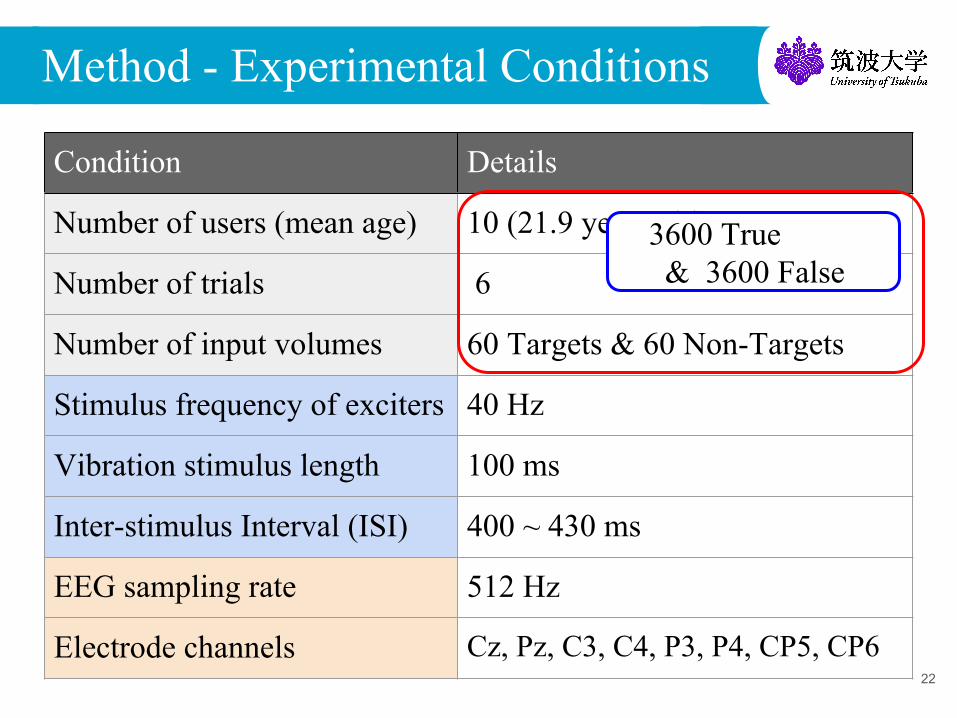
Method - Experimental Conditions
22
Condition Details
Number of users (mean age) 10 (21.9 years old)
Number of trials 6
Number of input volumes 60 Targets & 60 Non-Targets
Stimulus frequency of exciters 40 Hz
Vibration stimulus length 100 ms
Inter-stimulus Interval (ISI) 400 ~ 430 ms
EEG sampling rate 512 Hz
Electrode channels Cz, Pz, C3, C4, P3, P4, CP5, CP6
3600 True & 3600 False
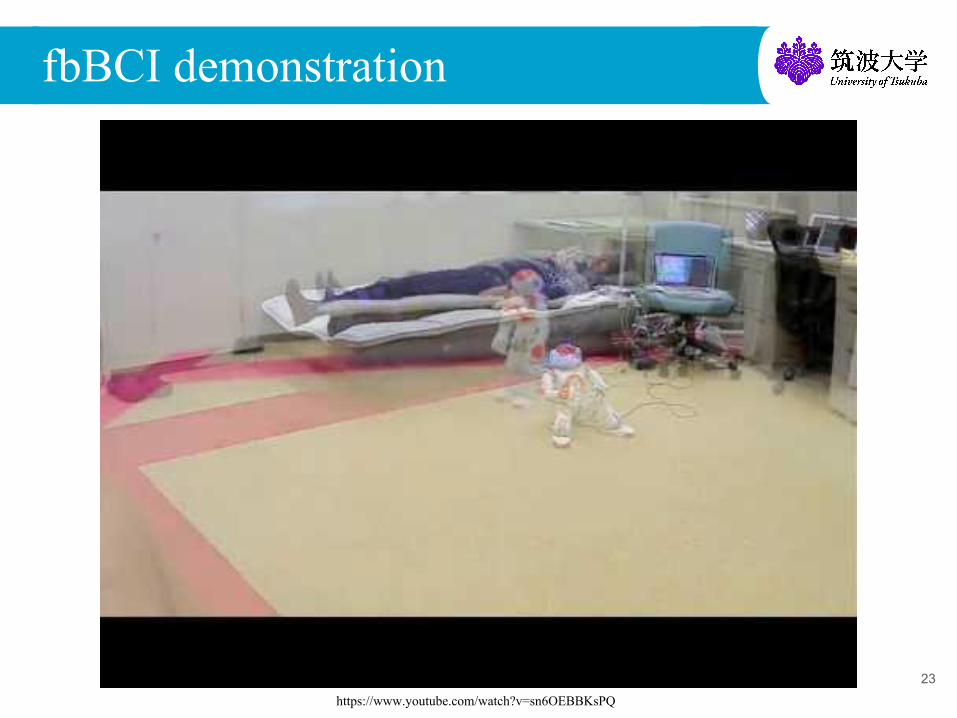
fbBCI demonstration
23https://www.youtube.com/watch?v=sn6OEBBKsPQ
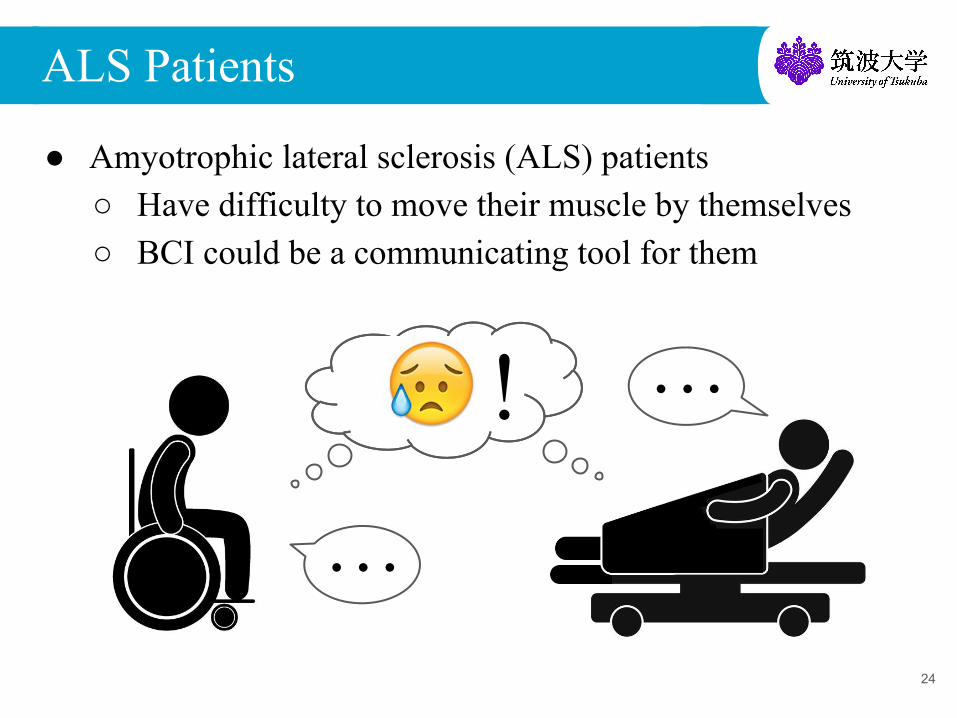
ALS Patients
● Amyotrophic lateral sclerosis (ALS) patients○ Have difficulty to move their muscle by themselves○ BCI could be a communicating tool for them
24
…
… !

● Grand mean ERP intervals in each electrode channel [1]
fbBCI ERP interval results
25*Gray-shaded area … significant difference (p < 0.01) between targets and non-targets

26
● ERP epoch averaging○ To cancel background noise
Non averaged ERP Moving averaged ERP
ERP averaging
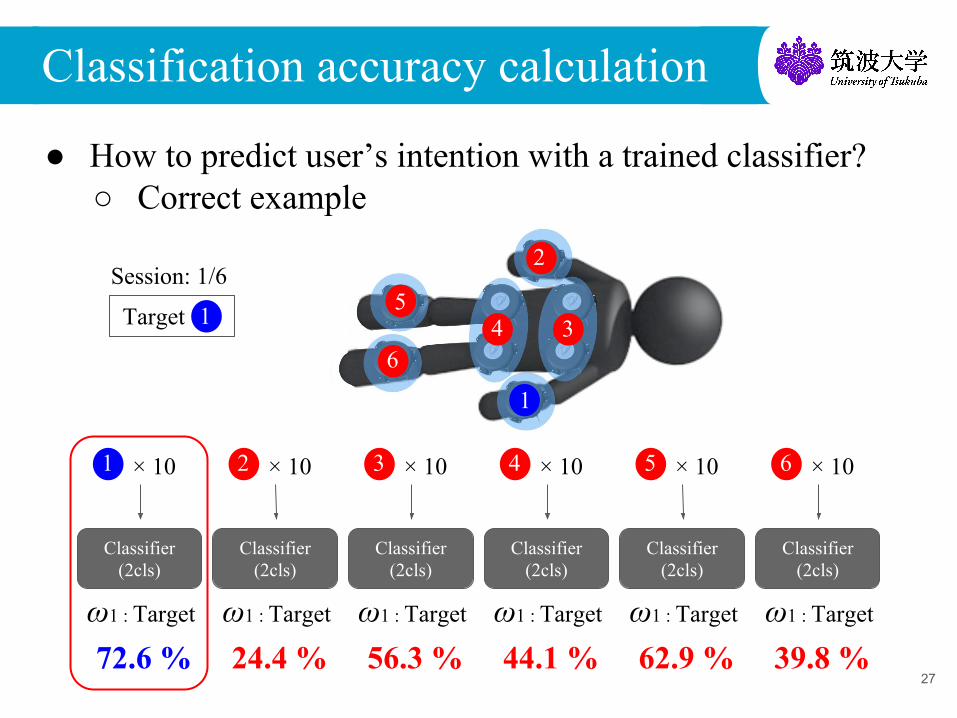
Classification accuracy calculation
● How to predict user’s intention with a trained classifier?○ Correct example
27
ω1 : Target
Classifier (2cls)
1 × 10
72.6 %
Target 1
Session: 1/6
ω1 : Target
Classifier (2cls)
2 × 10
24.4 %ω1 : Target
Classifier (2cls)
3 × 10
56.3 %ω1 : Target
Classifier (2cls)
4 × 10
44.1 %ω1 : Target
Classifier (2cls)
5 × 10
62.9 %ω1 : Target
Classifier (2cls)
6 × 10
39.8 %
1
2
345
6

28
ω1 : Target
Classifier (2cls)
1 × 10
35.1 %
Target 6
Session: 6/6
ω1 : Target
Classifier (2cls)
2 × 10
48.1 %ω1 : Target
Classifier (2cls)
3 × 10
69.2 %ω1 : Target
Classifier (2cls)
4 × 10
54.3 %ω1 : Target
Classifier (2cls)
5 × 10
50.9 %ω1 : Target
Classifier (2cls)
6 × 10
64.3 %
1
2
345
6
● How to predict user’s intention with a trained classifier?○ Wrong example
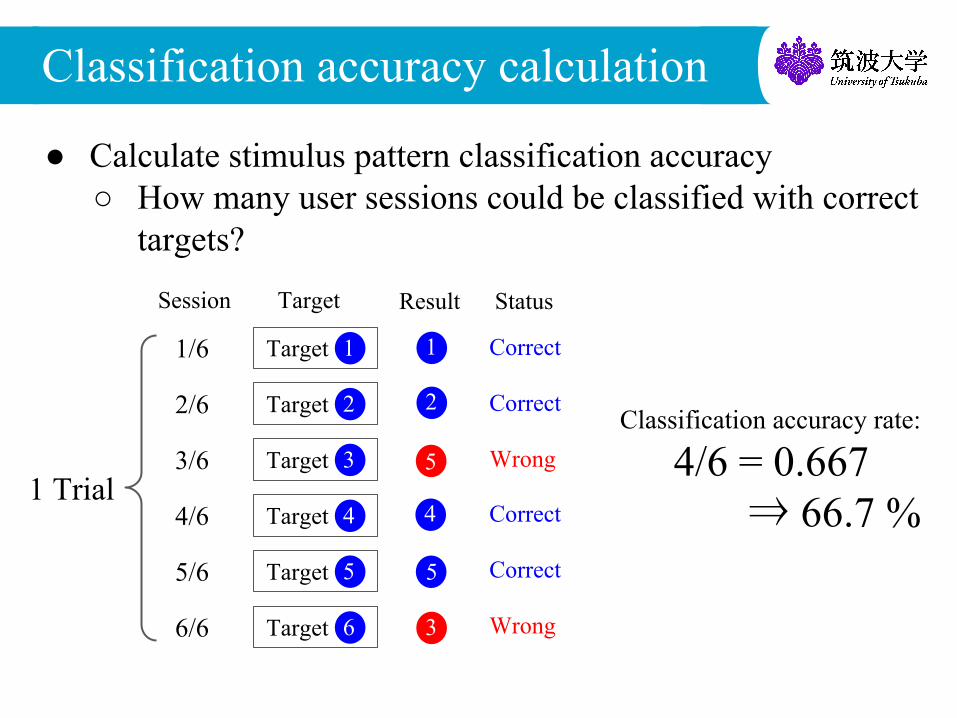
Classification accuracy calculation
Target 11/6
5
Target 2
Target 3
3
5
● Calculate stimulus pattern classification accuracy○ How many user sessions could be classified with correct
targets?
Target 4
Target 5
Target 6
2
4
Result
1
Session
2/6
3/6
4/6
5/6
6/6
1 Trial
Classification accuracy rate:
4/6 = 0.667 ⇒ 66.7 %
Correct
Correct
Wrong
Correct
Correct
Wrong
Target Status
Classification accuracy calculation

![A Tactile P300–based Brain–computer Interface …O6]1607_Others...A Tactile P300–based Brain–computer Interface Accuracy Improvement Takumi Kodama and Shoji Makino Tomasz M](https://img.dokumen.tips/doc/110x75/5f4d75c2f36bf5772d42d5e4/a-tactile-p300abased-brainacomputer-interface-o61607others-a-tactile-p300abased.jpg)


