Embed Size (px)
Citation preview
Michael Moodie
Comparing break crop performance of break crops in the Mallee
Project Aim: To improve our understanding of break crop productivity and profitability across seasons and soil types in the Mallee
First year of a three year project funded by SAGIT
Sites located at Waikerie and Loxton in the SA Mallee
Two trials located at each site: heavy and a light soil
Nine break crop options tested side by side
Agronomy optimised for each treatment
About the trial

Treatments
Crop Variety Target plants per m2
Seeding rate (kg/ha)
Field Pea PBA Wharton 45 90Vetch Rasina 60 40
Narrow‐leaved Lupin PBA Barlock 50 90Albus Lupin Luxor 35 120Faba Bean PBA Samira 20 140
Lentil PBA Hurricane 120 50Desi Chickpea PBA Striker 45 100Kabuli Chickpea Genesis 090 35 120
Canola Stingray 40 2.5
Sowing dates: Loxton 28th April; Waikerie 1st May
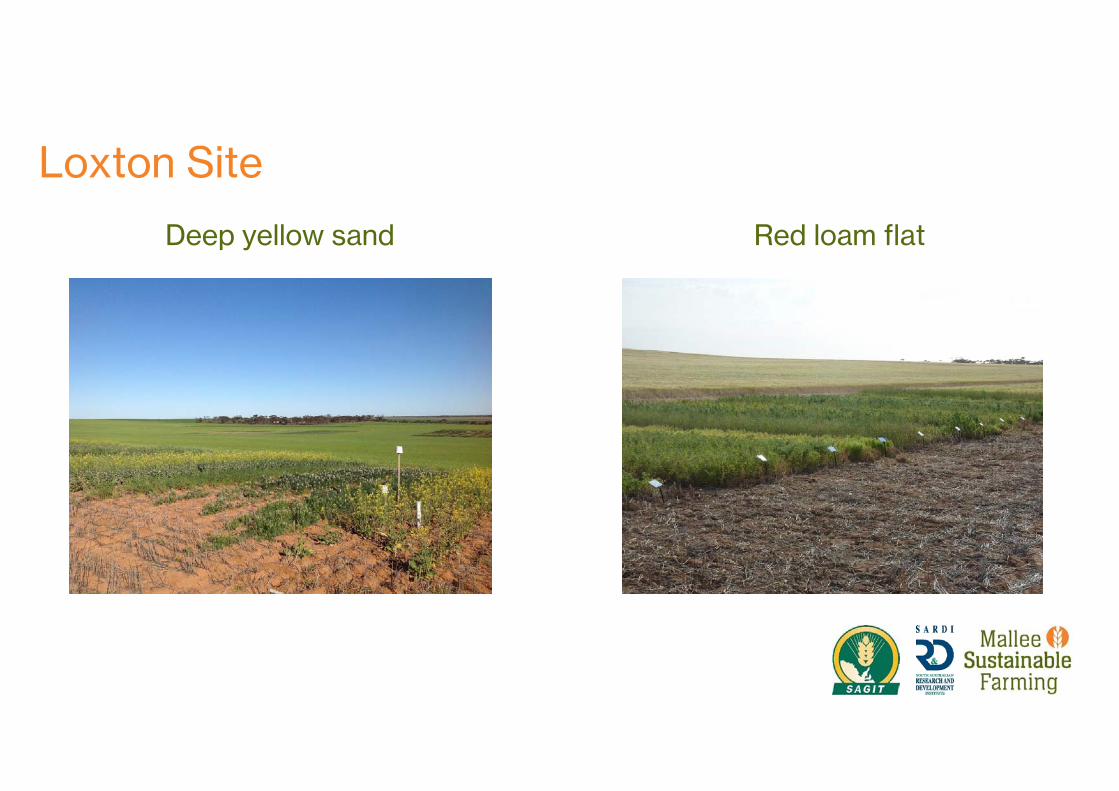
Loxton Site
Deep yellow sand Red loam flat

Waikerie Site
Red sandy loam Shallow – limestone flat
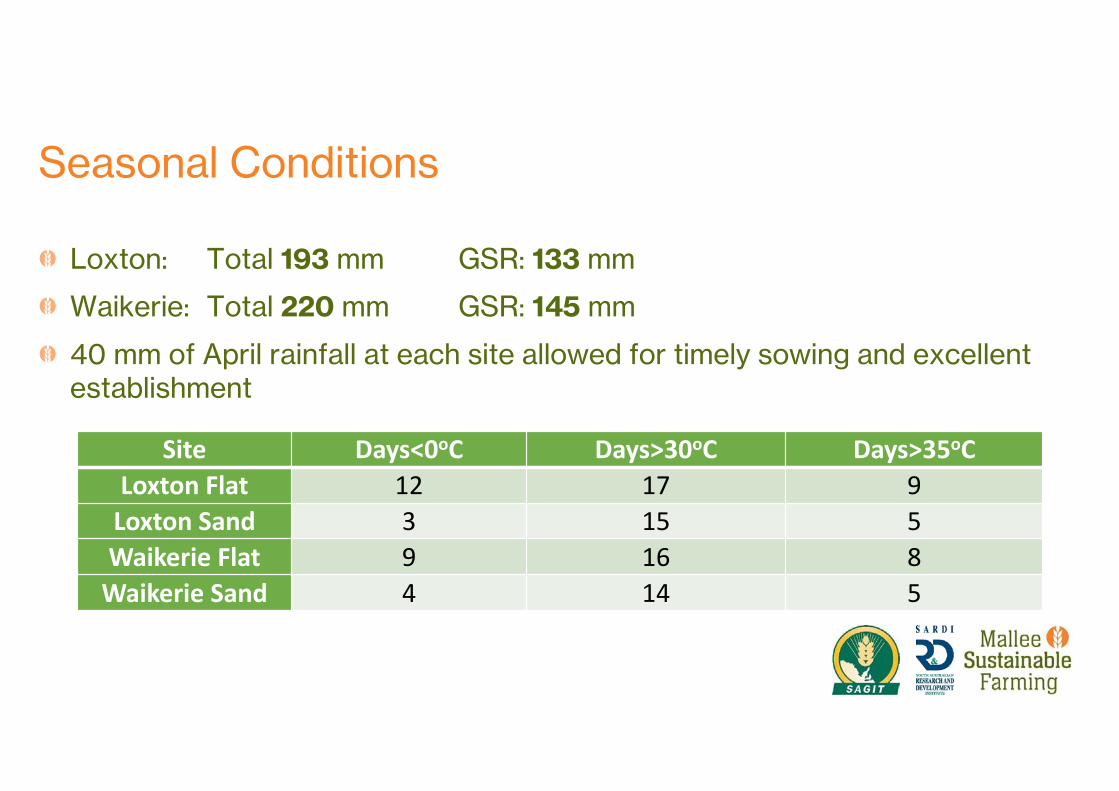
Seasonal Conditions
Site Days<0oC Days>30oC Days>35oCLoxton Flat 12 17 9Loxton Sand 3 15 5Waikerie Flat 9 16 8Waikerie Sand 4 14 5
Loxton: Total 193 mm GSR: 133 mm
Waikerie: Total 220 mm GSR: 145 mm
40 mm of April rainfall at each site allowed for timely sowing and excellent establishment
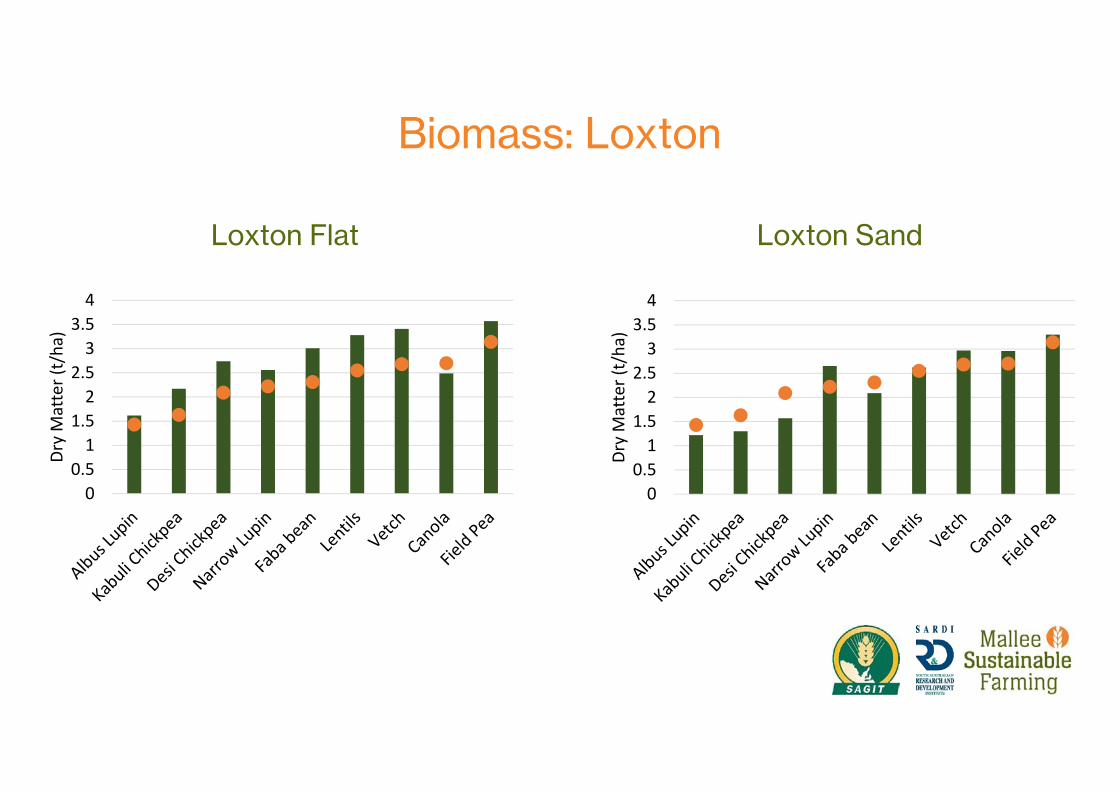
Biomass: Loxton
Loxton Flat Loxton Sand
00.51
1.52
2.53
3.54
Dry Matter (t/ha
)
00.51
1.52
2.53
3.54
Dry Matter (t/ha
)

Biomass: Waikerie
Waikerie Flat Waikerie Sand
00.51
1.52
2.53
3.54
Dry Matter (t/ha
)
00.51
1.52
2.53
3.54
Dry Matter (t/ha
)
Biomass production for each crop was relatively consistent between sites
All crop options except for albus lupin and kabuli chickpea averaged greater than 2 t/ha of biomass
Field pea averaged 3.1 t/ha with no less than 2.7 t/ha
Vetch dry matter production suffered greatest on the limestone flat
Lupin biomass was higher than average on the deep sand but was still less than vetch and field pea
Biomass – key points

Grain yield: Loxton
Loxton Flat Loxton Sand
0
0.2
0.4
0.6
0.8
1
1.2
Grain yield (t/ha)
0
0.2
0.4
0.6
0.8
1
1.2
Grain yield (t/ha)

Grain yield: Waikerie
Waikerie Flat Waikerie Sand
0
0.2
0.4
0.6
0.8
1
1.2
Grain Yield (t/ha)
0
0.2
0.4
0.6
0.8
1
1.2
Grain yield (t/ha)

Earlier maturing crops such as lentils, field pea, vetch and faba bean produced the best grain yields in a season with several heat events during October
Lentils had the most consistent and highest average grain yields (0.73 t/ha)
Field pea had the highest grain yield at any site (1.2 t/ha Waikerie sand) but yields were inconsistent due to frost on lower lying flats
Lupins and chickpeas averaged 0.5 t/ha or less in 2015
Grain yield – key points
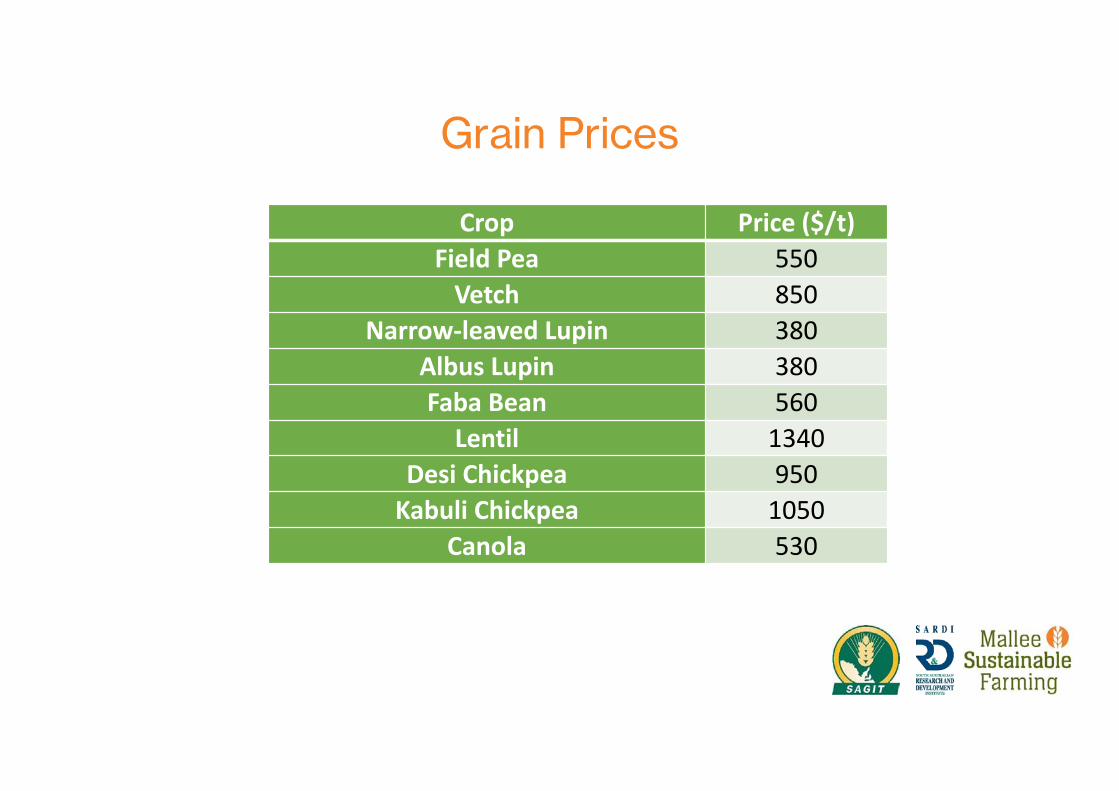
Grain Prices
Crop Price ($/t)Field Pea 550Vetch 850
Narrow‐leaved Lupin 380Albus Lupin 380Faba Bean 560
Lentil 1340Desi Chickpea 950Kabuli Chickpea 1050
Canola 530

Gross Margins - 2015
‐200
0
200
400
600
800
1000
1200
Albus Lupin NarrowLupin
Canola KabuliChickpea
Faba Bean DesiChickpea
Field Pea Vetch Lentil
Gross M
argin ($/ha)
Loxton Flat Loxton Sand Waikerie Flat Waikerie Sand Overall
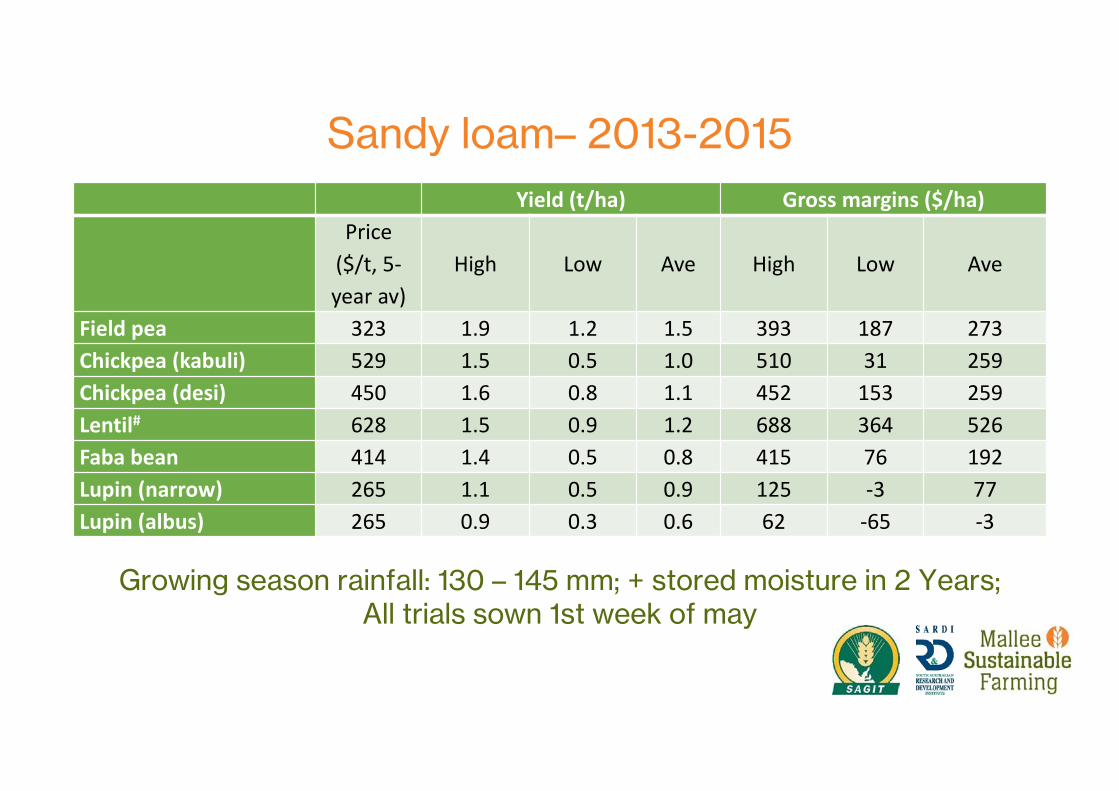
Sandy loam– 2013-2015Yield (t/ha) Gross margins ($/ha)
Price ($/t, 5‐year av)
High Low Ave High Low Ave
Field pea 323 1.9 1.2 1.5 393 187 273Chickpea (kabuli) 529 1.5 0.5 1.0 510 31 259Chickpea (desi) 450 1.6 0.8 1.1 452 153 259Lentil# 628 1.5 0.9 1.2 688 364 526Faba bean 414 1.4 0.5 0.8 415 76 192Lupin (narrow) 265 1.1 0.5 0.9 125 ‐3 77Lupin (albus) 265 0.9 0.3 0.6 62 ‐65 ‐3
Growing season rainfall: 130 – 145 mm; + stored moisture in 2 Years; All trials sown 1st week of may
Questions


