Embed Size (px)
Citation preview

www.ciat.cgiar.org Eco-efficient agriculture for the poor
Cali, 06th May 2015
Tree diversity & C sequestration in rural landscapes in sub-humid Central
America
P. Siles; D. Valbuena; A. Castro; O. Tellez; G. Bonilla; R. van der Hoek

Rural landscapes, degradation & eco-services
• Rural landscapes & soils are highly degraded in Central America (82% soils with erosion)
• Restoration of these landscapes are key for rural livelihoods & ES provision
• Need to co-develop farming systems & rural landscapes that account for ES
Constanza et al. 2014

The seasonally dry tropical forest
17 degrees Celsius rainfall ranging from 250 to 2000 a distinctive seasonality with 4 to 6 dry months
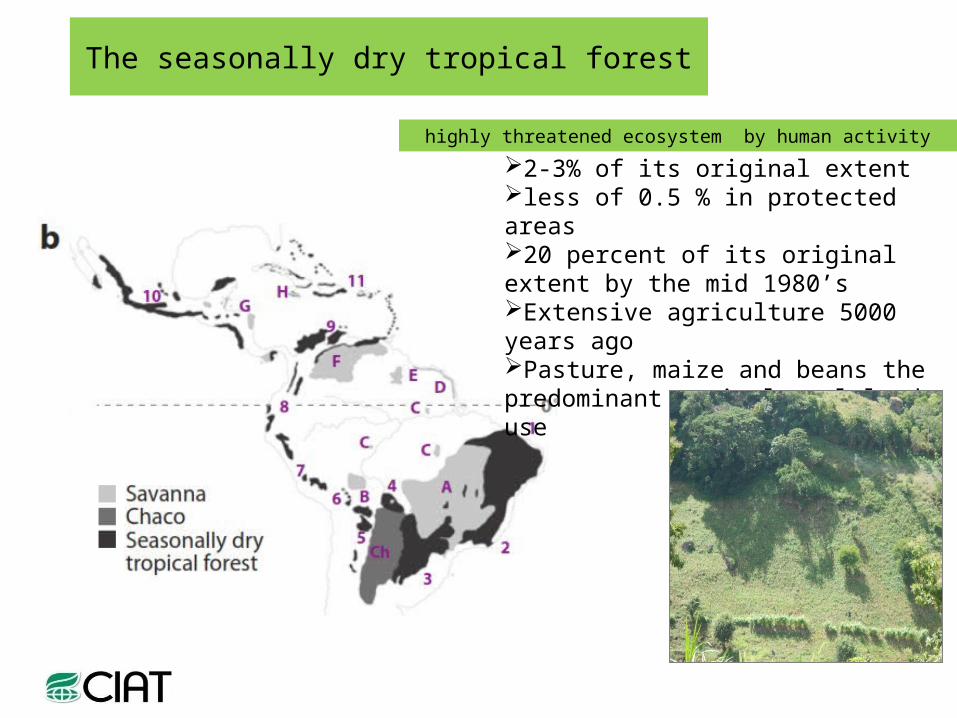
The seasonally dry tropical forest
2-3% of its original extentless of 0.5 % in protected areas20 percent of its original extent by the mid 1980’sExtensive agriculture 5000 years agoPasture, maize and beans the predominant agricultural land use
highly threatened ecosystem by human activity

Challenges in the Mesoamerican Region SDTF
Extensive agriculturePovertyFood security riskLandscape degradation Vulnerability with CC
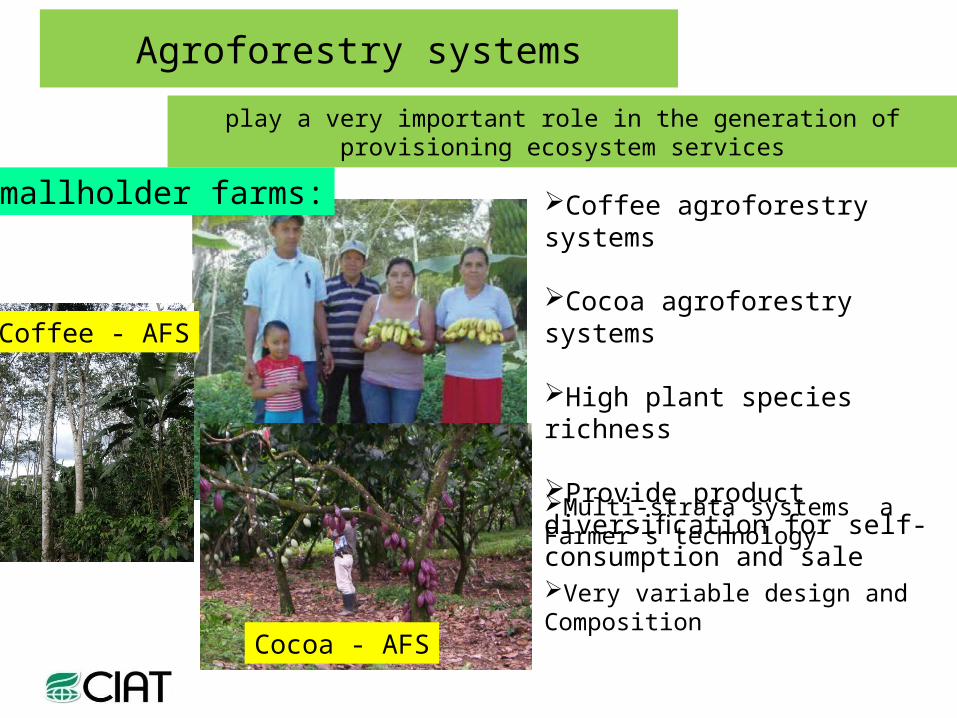
Agroforestry systems
Coffee agroforestry systems
Cocoa agroforestry systems
High plant species richness
Provide product diversification for self-consumption and sale
play a very important role in the generation of provisioning ecosystem services
Cocoa - AFS
Coffee - AFS
Smallholder farms:
Multi-strata systems a Farmer’s technology
Very variable design and Composition

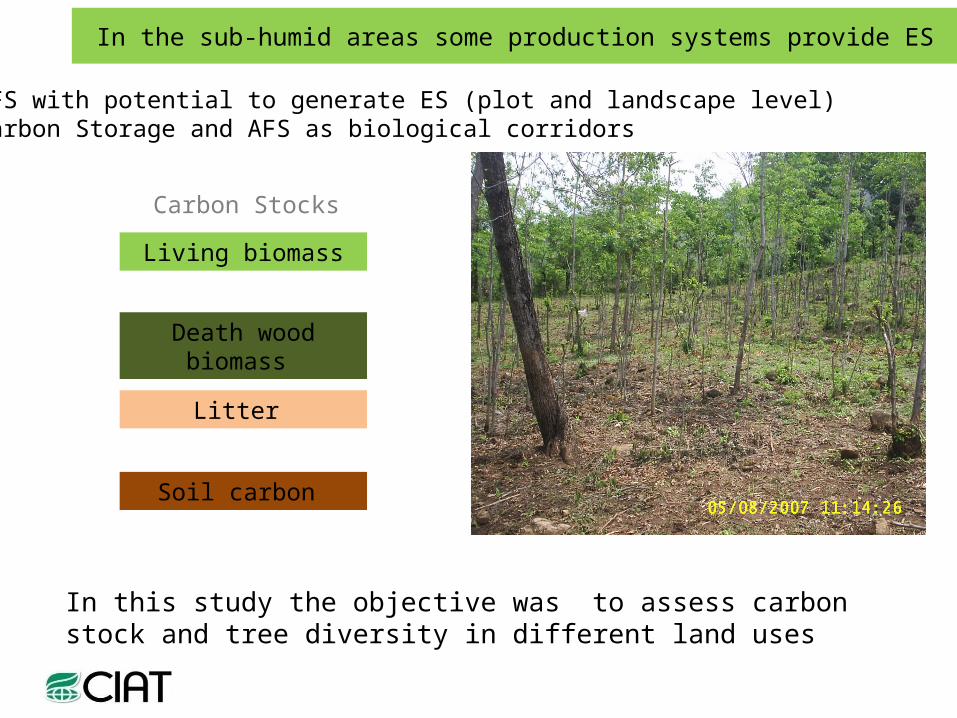
In the sub-humid areas some production systems provide ES
Traditional cropping systems
Silvopastoral systems
Fallows and secondary forestSlash and mulch agroforestry
In the sub-humid areas some production systems provide ES
In this study the objective was to assess carbon stock and tree diversity in different land uses
AFS with potential to generate ES (plot and landscape level)Carbon Storage and AFS as biological corridors
Carbon Stocks
Living biomass
Litter
Death wood biomass
Soil carbon

1 2 3 4 5 6 7 8 9 10 11 120
50
100
150
200
250
300
350
400
Somotillo
1 2 3 4 5 6 7 8 9 10 11 120
50
100
150
200
250
300
350
400
Condega PET 1450 mmPrec 850 mmP/PET=0.58
PET 1900 mmPrec 1700 mmP/PET=0.9
Field sites
• Micro watershed Río Pires (Condega): Potrerillos, Santa Teresa, Los Cerritos
• Micro watershed Río Tecomapa (Somotillo): La Danta y La Flor
• 8 Farms per site (Total 16)

www.ciat.cgiar.org Eco-efficient agriculture for the poor
Land usesT1 – Monocrop and burn T2 – Monocrop with traditional varietiesT3 – Monocrop + improved varieties
T7 – Naturalized pastureT8 – Improved pasture
T9 - Silvopastoril + Improved pasture
T4 – QSMAS+ traditional varietiesT5 - QSMAS+ improved varieties
T6 – Secondary forest
Land uses monitored for production and ESA farmer participative studyEvaluation and design of agroforestry systems Tree species selection
TCS
NP
SPS
QSMAS
SF
www.ciat.cgiar.org Eco-efficient agriculture for the poor
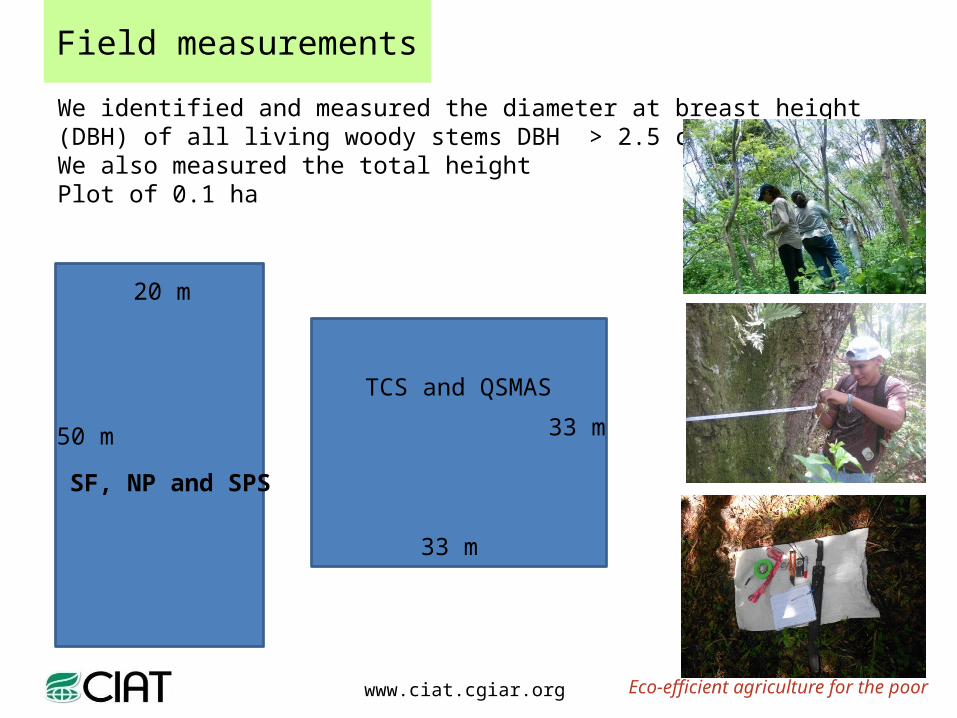
Field measurements
20 m
50 m
We identified and measured the diameter at breast height (DBH) of all living woody stems DBH > 2.5 cmWe also measured the total heightPlot of 0.1 ha
33 m
33 m
SF, NP and SPS
TCS and QSMAS

www.ciat.cgiar.org Eco-efficient agriculture for the poor
Death wood biomass
Field measurements
Litter biomass Soil sampling
Diameter of death woodin the transept
Herbs and litter in 0.25 m2
Soil samples 0-20 cm

www.ciat.cgiar.org Eco-efficient agriculture for the poor
Data analysis

Land Use Systems
TCS NP SPS QSMAS SF
Tre
e ric
hnes
s (s
peci
es 1
000m
-2)
0
5
10
15
20
25
Land Use Systems
TCS NP SPS QSMAS SF
Sha
nnon
Ind
ex H
'
0.0
0.5
1.0
1.5
2.0
2.5
Results
Across all sample sites, species richness ranged from 0 to 39 species/plotThe overall pattern of the the Shannon index was the same as that found for species richness

Number of samples
0 5 10 15 20
Sp
ecie
s ric
hnes
s
0
20
40
60
80
100TCSNPSPSQSMASSF
Number of individuals
500 1000 1500
(a) (b)
Results
SF and QSMAS with the highest species richness accumulationA total 110 tree species found

Results
A total 110 tree species foundFew species with high relative abundance
Species rank
0 10 20 30 40 50 60 70 80
Rel
ativ
e ab
und
ance
(%
)
0
5
10
15
20%P %SPS

Results
Species rank
0 10 20 30 40 50 60 70 80
Rel
ativ
e ab
und
ance
(%
)
0
5
10
15
20%P %SPS %QAS %SDF
A total 110 tree species foundFew species with high relative abundance

Results
Greatest similarity between the SF and QSMAS

Land Use Systems
TCS NP SPS QSMAS SF
Tot
al a
bove
grou
nd
Bio
mas
s (M
g ha
-1)
0
20
40
60
80
100
120
Land Use Systems
TCS NP SPS QSMAS SF
Tre
e B
iom
ass
(M
g h
a-1
)
0
20
40
60
80
100
120
Results
Tree biomass most important compartment in Total AGB
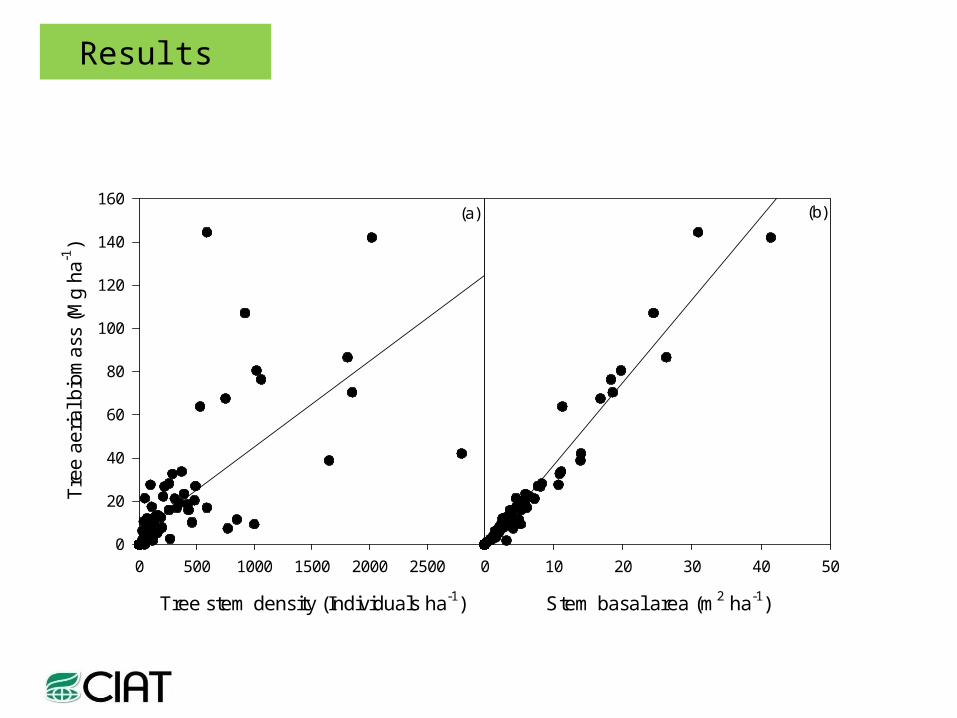
Tree stem density (Individuals ha-1)
0 500 1000 1500 2000 2500
Tre
e ae
rial b
iom
ass
(Mg
ha-1
)
0
20
40
60
80
100
120
140
160
Stem basal area (m2 ha-1)
0 10 20 30 40 50
(a) (b)
Results

Land Use Systems
TCS NP SPS QSMAS SF
Tre
e st
em d
ensi
ty (
Indi
vidu
als
ha-1
)
0
200
400
600
800
1000
1200
Land Use Systems
TCS NP SPS QSMAS SF
Tre
e ae
rial b
iom
ass
(M
g h
a-1
)
0
10
20
30
40
50
< 10 cm10-20 cm20-30 cm> 30 cm
Results

Land Use Systems
TCS NP SPS QSMAS SF
-60
-40
-20
0
Tot
al C
arbo
n st
orag
e (M
g C
ha
-1)
0
10
20
30
40
50
60
Results
Land Use Systems
TCS NP SPS QSMAS SF
-60
-40
-20
0
Tot
al C
arbo
n st
orag
e (M
g C
ha
-1)
0
10
20
30
40
50
60
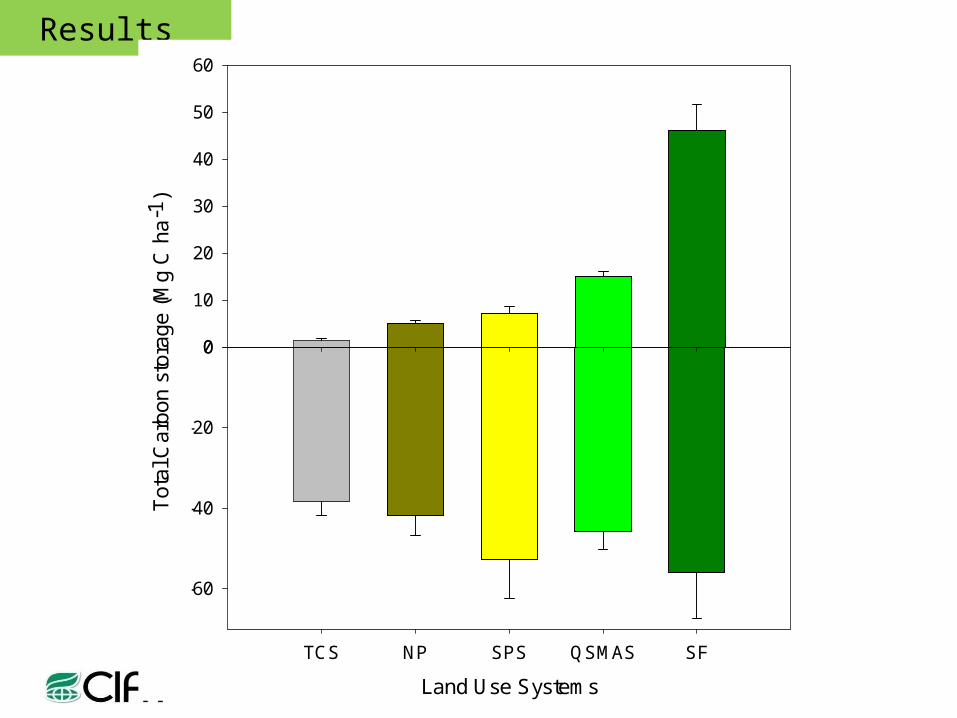
14 Mg ha-1 33% of SF
Results

• Tree biodiversity• Small number of spp accounted for the majority of trees and
shrubs
• Differences among land uses in species richness and community structure, but QSMAS similar in composition to SF
• C stocks • Soils store a large portion of the carbon (even only 20 cm depth)• C stocks in woody biomass the largest compartment of AGB• Forest plots stored on average 46 Mg C ha-1, QSMAS only 33% of
SF• Between 30 to 40% of the biomass C was stored in the largest
trees (DBH> 30 cm)• Based on average values, C stocks could increase by about 14 Mg
C ha-1 by converting cropland to agroforestry
Conclusions

• AFS are promising land uses to restore rural landscapes in sub-humid tropics of Central America
• Maize-beans AFS plantations with higher C stocks, tree diversity and food production is possible, with no trade-offs
• Few examples of successful agroforestry systems in SDTF
• Increasing yield in these systems still a challenge
• High value products from trees are unexplored (reduce biodiversity and ecological complexity)
• Maize-beans AFS and SPS represent a wildlife-friendly farming strategy (corridor and landscape integrity)
Final remarks: agroforestry systems on the SDTF
• Compensations
• These results could assist to develop mechanism to promote an agriculture with trees
• But how to make PES likely in HN, NI or SV?
• Compensation through certification also challenging: no like coffee or cocoa (certification), but maybe livestock?
• Other mechanisms to incentive the AFS (credits)
Final remarks: up/out-scaling of agroforestry systems

www.ciat.cgiar.org Eco-efficient agriculture for the poor
Thanks!

Métodos: Parcelas de muestreo
20 m
50 m
Vegetacion de arbustos y arboles con dap > 2.5 cm
33 m
33 m
Vegetacion de arbustos y arboles con dap > 2.5 cm
Bosque, SSPP
SAQ, Agricultura
www.ciat.cgiar.org Eco-efficient agriculture for the poor
Data analysis

www.ciat.cgiar.org Eco-efficient agriculture for the poor
Métodos: Esquema general de trabajo
Field measurement
s
Tree measurements Soil and litter Dry Matter and SOM
Diversity analysis
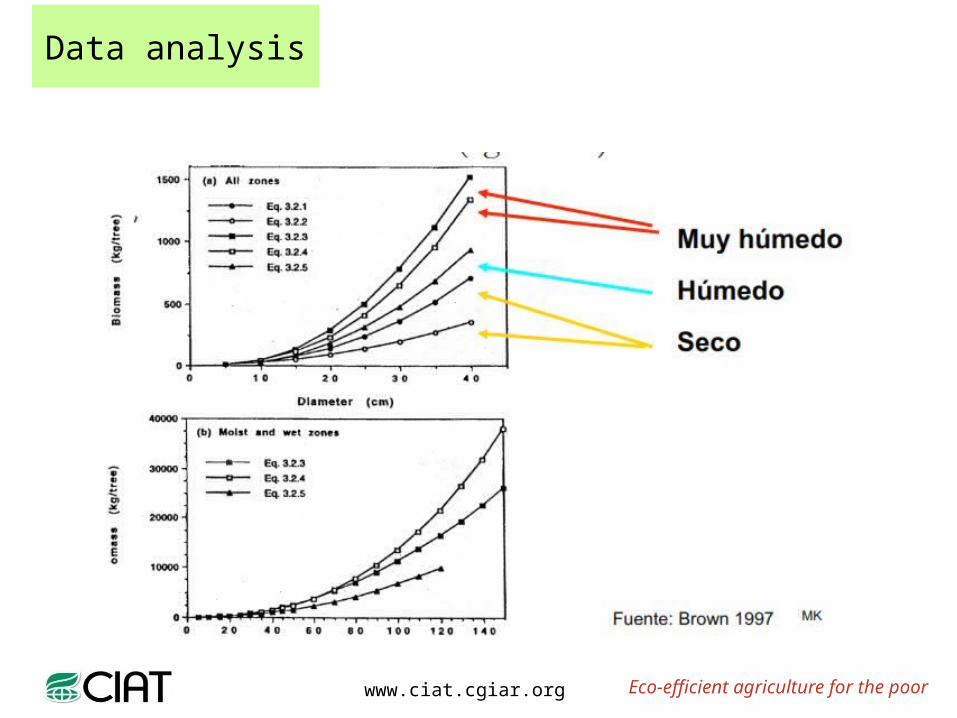
Biomass stimation by allometric equations
Litter C estimation /ha
Soil Carbon estimation /ha
Total C stock /ha

Métodos: Muestreo de hojarasca y suelos
Fase de campo
Muestreo de raíces y hojarasca
Cinco puntos de muestreo de la hojarasca y las raíces finas por parcela
En cada punto de muestreo -Residuos en 0.25 m2 recolectado
Suelos 0-10 y 10-20 cm

Land Use Systems
Family Tree specie % of the total
TCS
Boraginaceae Cordia alliodora 26.3Bignonaceae Tecoma stans 21.1Burserac eae Bursera simarouba 15.8Fabaceae Gliricidia sepium 15.8
NP
Bignonaceae Tecoma stans 16.8Boraginaceae Cordia alliodora 15.6Mimmosaceae Acacia velutina 12.0Rhamnaceae Karwinskia calderonii 8.4
SPS
Rhamnaceae Karwinskia calderonii 18.6Rhamnaceae Tecoma stans 14.0Boraginaceae Cordia alliodora 8.4Simaroubaceae
Alvarodoa amorphiodes
6.5
QSMAS
Boraginaceae Cordia alliodora 15.0
Fabaceae Lonchocarpus minimifolius
14.5
Rhamnaceae Karwinskia calderonii 13.4Bignonaceae Tecoma stans 9.0
TSF
Mimmosaceae Lysiloma divaricatum 16.6Bignonaceae Tecoma stans 8.5Rhamnaceae Karwinskia calderonii 7.9Ebenaceae Diospyros salicifolia 7.8

Land Use Systems
TCS NP SPS QSMAS SF
Dea
th w
ood
Bio
mas
s (M
g ha
-1)
0
1
2
3
4
Land Use Systems
TCS NP SPS QSMAS SF
Litt
er +
her
bs B
iom
ass
(Mg
ha-1
)
0
1
2
3
4
Results