Embed Size (px)
Citation preview

Structure of the Lesser Antilles subduction forearc and
backstop from 3D seismic refraction tomography
Applied Geophysics
Riccardo Pagotto student n° F133629
email [email protected]

Overview ! The Oceanic Subduction and Configuration of the Compressive Margins
• Global Plate Motion and Asthenospheric Flow
• The Caribbean tectonic setting
• The Compressive Margin and its structures
! The “Sismantilles II” and the “OBS Antilles” experiments
• Survey equipments
• Tomographic model
• Velocity model
• Velocity gradient
! The Seismicity of the Compressive Margin
• The seismicity along the Wadati – Benioff subduction plane
• Mercalli vs Richter evaluation

1
Fig 1: Hot Spot Reference Frame and the absolute plate motion. (Gripp and Gordon, 2002).
The Oceanic Subduction and Configuration of the Compressive Margins
2
Fig 2: The global asthenospheric flow field. (Doglioni, 1993).
Global Plate Motion and Asthenospheric Flow

The Caribbean tectonic setting
1
Fig 1: The tectonic setting of the investigated area. (http://www.drgeorgepc.com/TsunamiVolcanicCaribbean.html)
Caribbean Plate
South American Plate
North American Plate
Cocos Plate
N
2
3
Fig 2 and 3: The subduction margin. (http://blogs.egu.eu/)
N
• Convergence rate = 2-3 cm/yr • The Lesser Antilles Arc is an approximately 850 km long, the island arc formed by the subduction of the Atlantic lithosphere from ~84 My at the latitude of Barbuda to 140 My at the latitude of Barbados underneath the Caribbean lithosphere • Active arc since early Eocene with interruption in Late Oligocene • Paleocene back-arc spreading of the Grenada Basin
1
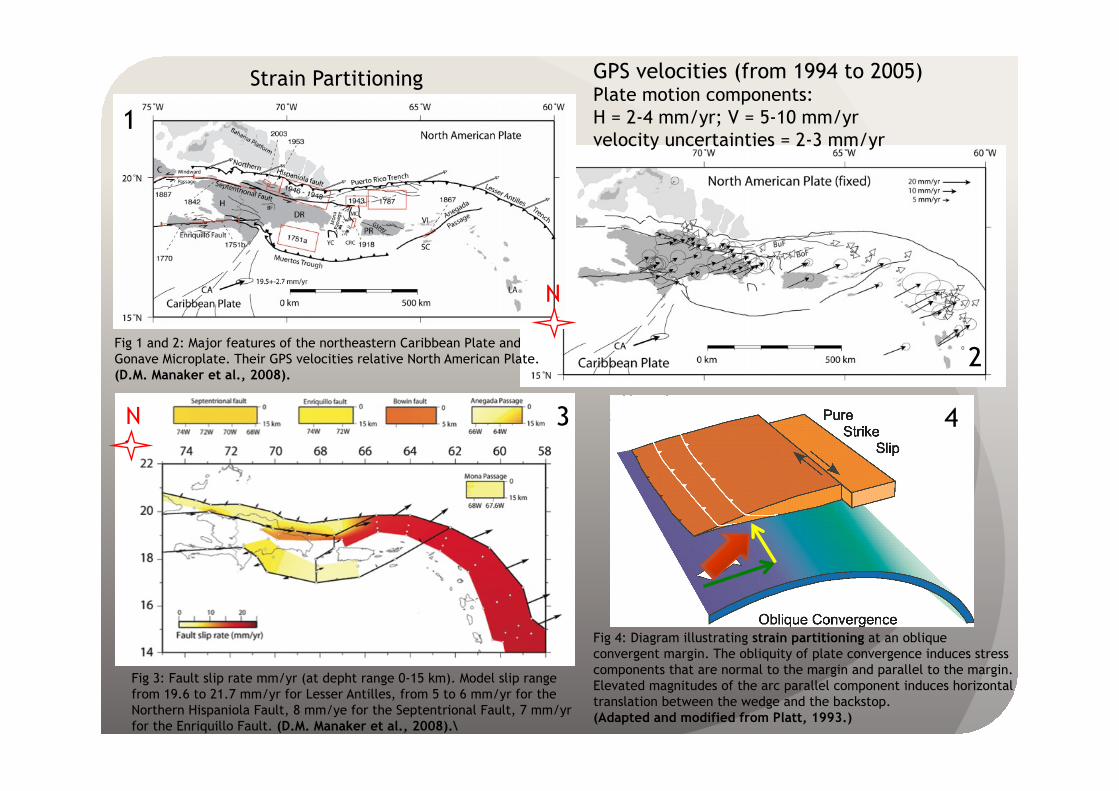
Strain Partitioning
N
1
2 Fig 1 and 2: Major features of the northeastern Caribbean Plate and Gonave Microplate. Their GPS velocities relative North American Plate. (D.M. Manaker et al., 2008).
GPS velocities (from 1994 to 2005) Plate motion components: H = 2-4 mm/yr; V = 5-10 mm/yr velocity uncertainties = 2-3 mm/yr
4
Fig 4: Diagram illustrating strain partitioning at an oblique convergent margin. The obliquity of plate convergence induces stress components that are normal to the margin and parallel to the margin. Elevated magnitudes of the arc parallel component induces horizontal translation between the wedge and the backstop. (Adapted and modified from Platt, 1993.)
N 3
Fig 3: Fault slip rate mm/yr (at depht range 0-15 km). Model slip range from 19.6 to 21.7 mm/yr for Lesser Antilles, from 5 to 6 mm/yr for the Northern Hispaniola Fault, 8 mm/ye for the Septentrional Fault, 7 mm/yr for the Enriquillo Fault. (D.M. Manaker et al., 2008).\
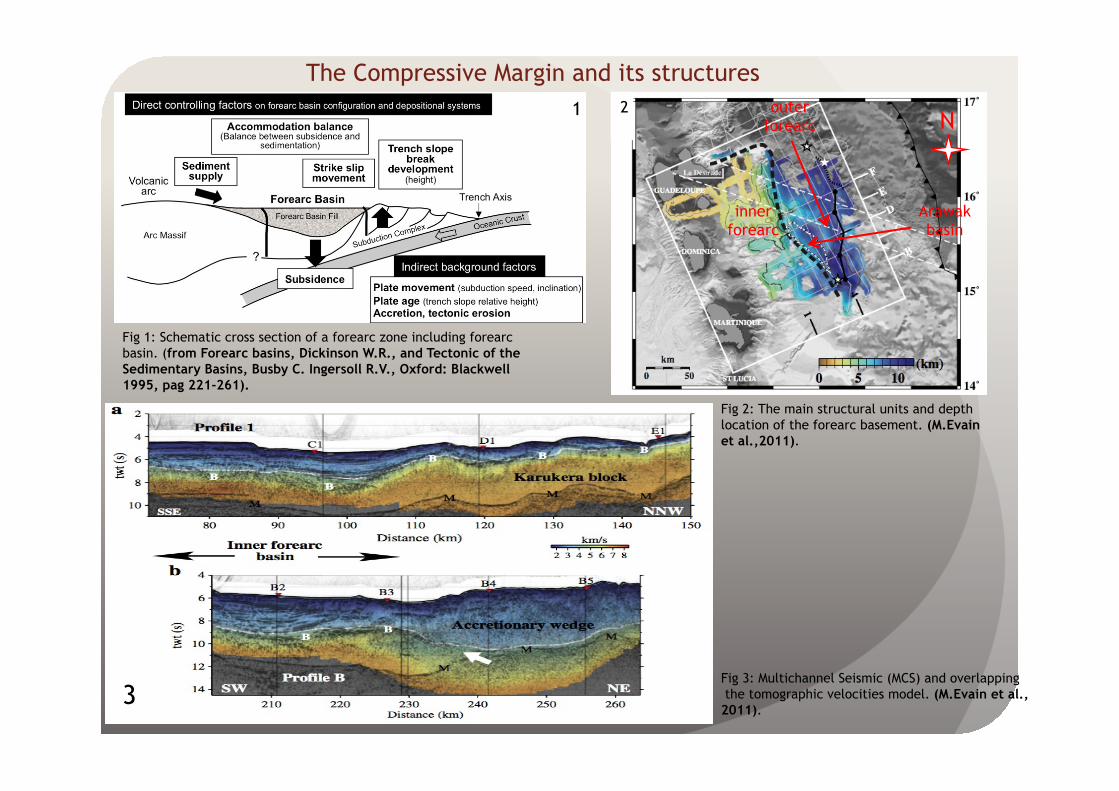
The Compressive Margin and its structures
Fig 1: Schematic cross section of a forearc zone including forearc basin. (from Forearc basins, Dickinson W.R., and Tectonic of the Sedimentary Basins, Busby C. Ingersoll R.V., Oxford: Blackwell 1995, pag 221-261).
1
3 Fig 3: Multichannel Seismic (MCS) and overlapping the tomographic velocities model. (M.Evain et al.,2011).
2N
Fig 2: The main structural units and depth location of the forearc basement. (M.Evain et al.,2011).
inner forearc
outer forearc
Arawak basin

The “Sismantille II” and the “OBS Antilles” experiments (2007)
• Active and passive seismic data were acquired using a network of 80 OBS/H
• The network covered an area about 65 x 95 km2
• Total shots fired = 34,590 using airgun source tuned to generate a single bubble pulse
• GPS trigger at an interval of 150 m
• Wide-angle seismic refraction was adopted to provide a 3D P-wave velocity model
N
Fig 1: Map of the “Sismantilles 2” experiment, the black lines represent the shot lines and Ocean Bottom Seismometers (OBS) locations during experiment. The gray lines are the MCS profiles and the white rectangle area indicates the extent of 3D tomographic inversion. (M.Evain et al.,2011).
1
Fig 2: Schematic view of marine seismic measuring method. Standard measurement configuration for seismic data acquisition, airgun array is dragged as a seismic source. Hydrophones are involved for data recording. (http://www.bgr.bund.de). 2

Survey equipments
• OBS is equipped with hydrophone and 3-component seismometer. 23 of them with short period 4.5 Hz, 21 with broadband ! f cutoff • 24 bit analog/digital recording • OBS sampling interval = 10 ms • sampling rate = 100 sps (samples per sec) • maximum depth = 7000 m at speed ≅ 1 m/s • Seascan clock accuracy = 5*10-8 • from 6 to 12 months autonomy recording
1 2
Fig 1 and 2:”Hippocampe” OBSs, designed at Géoazur, France (Charvis and Hello, 2005; Hello et al., 2006).
3
Fig 3: Filter curve or Corner frequency diagram for broadband seismometers and relative equations.

1
Tomographic model
• Checker-board test are used for tomography inversion
• Model perturbation: using different background velocities. The purpose is to obtain the model parameters from row data
• Assume lateral and vertical resolution values respectively of 20 km and 10 km if 70% of the initial checker-board anomaly is recovered during the inversion
Fig. 1) Located profile map; 2) Horizontal and vertical resolution of final tomographic model based on 3D checkerboard tests (Zelt, 1998). Dotted black and white curve is the 5000 m depth contour of the Arawak Basin. Checkerboard tests were computed for different anomaly size. For each test the semblance was calculated and it quantifies the percentage of the anomaly amplitude recovered during the inversion. It was considered a semblance value greater or equal to 0.7. At any point of the model the resolution corresponds to the interpolated anomaly size from which a semblance of 0.7 is reached.
2

Velocity model
Fig. 1) Horizontal maps made at different depth of final velocity model. Gray contours are 1 km/s and black contours highlight the 4 and 6 km/s velocity contours. Areas uncovered by rays appear in gray. Dotted white line indicates the 5000 m contour of the Arawak Basin. Dashed white lines are the prolongations of the borders of the Tiburon Ridge. Fig 2) Vertical sections through final velocity model. Dashed white line indicates position of the expected bounds of the subducting Tiburon Ridge. The boundary between the inner and the outer forearc near the surface is mark by a black arrow. The red triangles mark the position of the toe of the backstop. The red and pink circles are basement highs.
1 2

Velocity gradient
• The vertical velocity gradient calculated beneath the top of this basement (fig.2) also highlights a major difference between an inner forearc with gradient higher than 0.075 km/s/km and an outer forearc with a lower gradient
• The upper part of the igneous crust is characterized by seismic velocities ranging from 4.0 to 6.5 km/s with an average gradient of 0.5 km/s/km. This part is interpreted as series of basaltic lava flows in the Kerguelen and Galapagos Volcanic Provinces and is consistent with volcanic rocks outcropping in La Désirade and along the Karukera Spur.
• Deeper, the velocity gradient is lower, ~ 0.05 km/s/km, and this part is usually interpreted as plutonic rocks and cumulates emplaced at depth
• The upper crustal velocity of the outer forearc consists of a basement with a velocity of 4 km/s increasing to more than 6km/s, and an average vertical gradient of 0.4 km/s/km
Fig. 1) Graph of the vertical velocity gradient in the upper 5 km of the basement, the top of the basement is based on the 4 km/s velocity contour. Fig 2) Comparison of 1D velocity versus depth curves from the inner forearc (red curves), and from the outer forearc (green curves) in (1) the continental crust (Christensen and Mooney, 1995), (2) in the Kerguelen magmatic province (Borissova et al., 2003; Charvis et al., 1995; Operto and Charvis, 1995, 1996) (3) in the Galapagos mag- matic province (Marcaillou et al., 2006; Sallarès and Charvis, 2003; Sallare�s et al., 2003, 2005) and (4) in the Atlantic oceanic crust (White et al., 1992).
N 1
2

The seismicity of the Compressive Margin
3
Fig. 3) Vertical cross-sections of the hypocentres orthogonal to the deformation front showing seismic events dipping to the SW till 170 km depth. (M. Ruiz et al., 2011).
N
Fig. 1) Map of the Central Lesser Antilles subduction zone and its seismic activity from 1906 to 2008 (ISC Catalog, 2001). Only epicentres with magnitude equal or greater than 4 are shown. Red stars represent the most important historical events which have occurred in this region (Bernard and Lambert, 1988; Dorel, 1981; Dorel et al., 1971; Feuillet et al., 2002; Robson, 1964).
Fig 2) Preliminary location of the 1300 seismic events analysed in this study from January to the end of August 2007. Grey circles indicate events with azimuthal gap greater than 270° not discussed in this work (M. Ruiz et al., 2011).
1 2
N

The seismicity along the Wadati – Benioff subduction plane
Local magnitudes have been estimated using the duration magnitude defined by Lee et al. (1972) as:
Md = 2logT + 0.0035D − 0.87
where:
T = total signal duration in seconds of the first P-arrival [s]
D = epicentral distance [km]
Fig. 1) Final hypocentral locations on complete catalogue. Epicentres in grey will not be discussed in this work. Red dotted line separates the inner forearc from the outer forearc and the red line is the backstop position (Evain et al., 2011). The dashed area is the location of a deep sedimentary basin located on top of the inner forearc(Evain et al., 2011). Focal mechanisms are outlined using lower hemisphere equal-area projection.
N 1
2
Fig. 2) Cross-sections along lines shown in Fig. 1). Red dots are hypocentres. Grey lines represent slab and upper plate Moho positions.
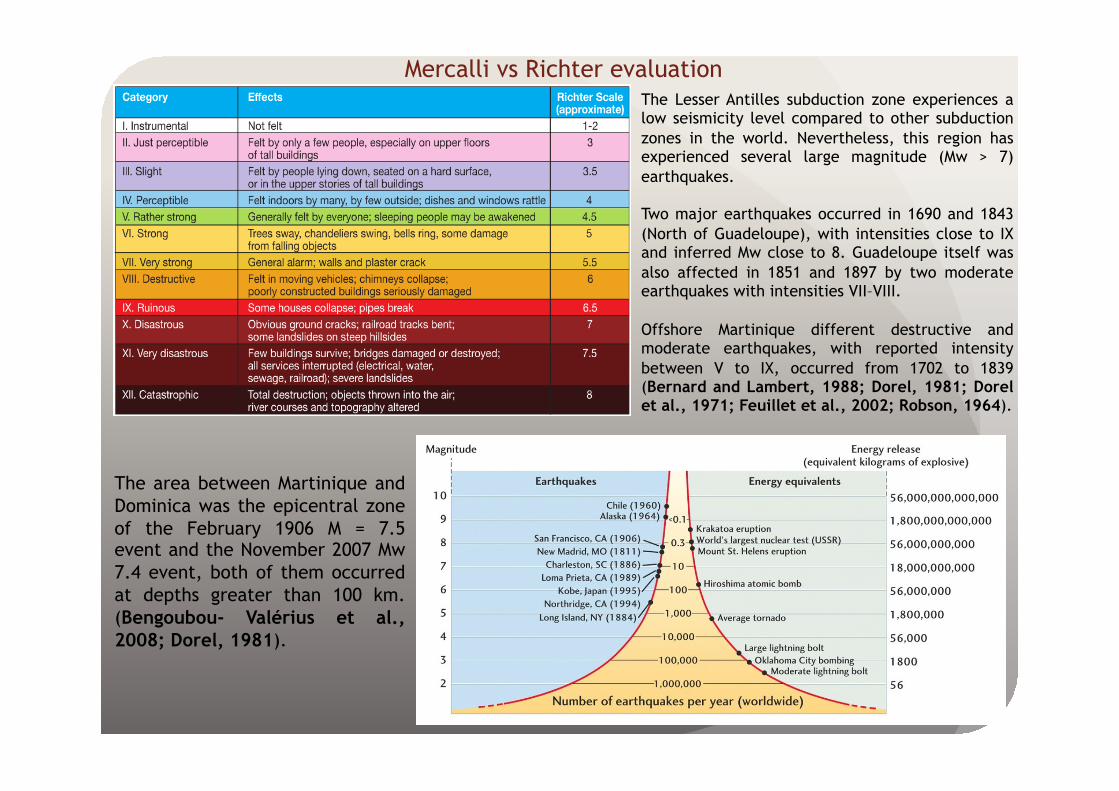
Mercalli vs Richter evaluation The Lesser Antilles subduction zone experiences a low seismicity level compared to other subduction zones in the world. Nevertheless, this region has experienced several large magnitude (Mw > 7) earthquakes.
Two major earthquakes occurred in 1690 and 1843 (North of Guadeloupe), with intensities close to IX and inferred Mw close to 8. Guadeloupe itself was also affected in 1851 and 1897 by two moderate earthquakes with intensities VII–VIII.
Offshore Martinique different destructive and moderate earthquakes, with reported intensity between V to IX, occurred from 1702 to 1839 (Bernard and Lambert, 1988; Dorel, 1981; Dorel et al., 1971; Feuillet et al., 2002; Robson, 1964).
The area between Martinique and Dominica was the epicentral zone of the February 1906 M = 7.5 event and the November 2007 Mw 7.4 event, both of them occurred at depths greater than 100 km. (Bengoubou- Valérius et al., 2008; Dorel, 1981).

Conclusion • The inner forearc corresponds to the eastern margin of the Mesozoic volcanic system. It appears as a rigid crustal block that may be tilted to the south and covered by 4 km thick sedimentary basin
• The basement of the inner forearc is uplifted by 4 km on average, relative to the basement of the outer forearc. It may be due to the subduction of the 2 km high Tiburon
• The basement of the outer forearc exhibits slightly lower velocity and lower velocity gradient compared to the inner forearc basement, but still in the range of the Large Igneous Provinces velocity gradient
• The backstop is the trenchward limit of the outer forearc that forms a rigid buttress to the accretionary wedge. The accretionary wedge reaches a thickness of 7 km. Therefore, the backstop corresponds to the trenchward limit of the inner forearc
• The outer forearc could be either the prolongation of the inner forearc or it could be the result of the accretion of a major volcanic terranes to the inner forearc in the past history of the Lesser Antilles subduction zone
• A scarce seismicity in the Caribbean upper crust,it it mostly located at depth greater than 15 km. The earthquakes mostly located near the base of the ~30 km thick Caribbean crust and in the upper mantle. The earthquakes located between 20 to 45 km depth and a concentration of deep events at around 160 km depths between Martinique and Dominica islands which delineate the slab in the zone
• The seismicity is mainly concentrated beneath the inner forearc which is a dense and rigid remnant Mesozoic crustal block. No significant seismicity was detected either beneath the accretionary wedge or the outer forearc region

References
Thank you for attention!
Structure of the Lesser Antilles subduction forearc and backstop from 3D seismic refraction tomography, (Mikael Evain et al., 2011)
Seismic activity offshore Martinique and Dominica islands (Central Lesser Antilles subduction zone) from temporary onshore and offshore seismic networks, (M. Ruiz et al., 2011)
Interseismic Plate coupling and strain partitioning in the Northeastern Caribbean (D. M. Manaker et al., 2008)
Hippocampe : a new versatile ocean bottom seismometer (Y. Hello et al., 2006)
Seismic networks, Chapter 8 (J. Havskov et al., 2011)