Embed Size (px)
Citation preview

Article
3D-CLEM Reveals that a M
ajor Portion of MitoticChromosomes Is Not ChromatinGraphical Abstract
Highlights
d 3D-CLEM combines light and serial block-face scanning
electron microscopy
d The complete architecture of all 46 human chromosomes has
been defined
d A large portion of mitotic chromosomes is not composed of
chromatin
d Chromosome volumes determined by light and electron
microscopy differ dramatically
Booth et al., 2016, Molecular Cell 64, 1–13November 17, 2016 ª 2016 The Author(s). Published by Elsevierhttp://dx.doi.org/10.1016/j.molcel.2016.10.009
Authors
Daniel G. Booth, Alison J. Beckett,
Oscar Molina, ..., Vladimir Larionov,
Ian A. Prior, William C. Earnshaw
[email protected] (D.G.B.),[email protected] (W.C.E.)
In Brief
Booth et al. develop a microscopy
method called 3D-CLEM. Using this
approach, they find that a large portion of
mitotic chromosomes is not composed of
chromatin, challenging classical
perceptions of chromosomes.
Inc.

Please cite this article in press as: Booth et al., 3D-CLEM Reveals that a Major Portion of Mitotic Chromosomes Is Not Chromatin, Molecular Cell(2016), http://dx.doi.org/10.1016/j.molcel.2016.10.009
Molecular Cell
Article
3D-CLEM Reveals that a Major Portionof Mitotic Chromosomes Is Not ChromatinDaniel G. Booth,1,5,* Alison J. Beckett,4 Oscar Molina,1 Itaru Samejima,1 Hiroshi Masumoto,2 Natalay Kouprina,3
Vladimir Larionov,3 Ian A. Prior,4 and William C. Earnshaw1,*1Wellcome Trust Centre for Cell Biology, Institute of Cell Biology, University of Edinburgh, EH9 3BF Edinburgh, UK2Department of Frontier Research, Laboratory of Cell Engineering, Kazusa DNA Research Institute, Kisarazu, 292-0818 Chiba, Japan3Developmental Therapeutics Branch, National Cancer Institute, National Institutes of Health, Bethesda, MD 20892-4264, USA4Biomedical Electron Microscopy Unit, Division of Cellular and Molecular Physiology, Institute of Translational Medicine,
University of Liverpool, Crown Street, L69 3BX Liverpool, UK5Lead Contact*Correspondence: [email protected] (D.G.B.), [email protected] (W.C.E.)
http://dx.doi.org/10.1016/j.molcel.2016.10.009
SUMMARY
Recent studies have revealed the importance ofKi-67 and the chromosome periphery in chromo-some structure and segregation, but little is knownabout this elusive chromosome compartment. Herewe used correlative light and serial block-face scan-ning electron microscopy, which we term 3D-CLEM,tomodel the entiremitotic chromosome complementat ultra-structural resolution. Prophase chromo-somes exhibit a highly irregular surface appearancewith a volume smaller than metaphase chromo-somes. This may be because of the absence of theperiphery, which associates with chromosomesonly after nucleolar disassembly later in prophase.Indeed, the nucleolar volume almost entirely ac-counts for the extra volume found in metaphasechromosomes. Analysis of wild-type and Ki-67-depleted chromosomes reveals that the peripherycomprises 30%–47% of the entire chromosomevolume and more than 33% of the protein mass ofisolated mitotic chromosomes determined by quan-titative proteomics. Thus, chromatin makes up asurprisingly small percentage of the total mass ofmetaphase chromosomes.
INTRODUCTION
Since their first discovery in 1882 (Flemming, 1882), mitotic chro-
mosomes have been a subject of intense study. Remarkably,
despite the significant developments of light (LM) and electron
microscopy (EM) over the intervening years, the detailed organi-
zation of mitotic chromosomes remains a mystery (Belmont,
2002, 2006; Swedlow and Hirano, 2003; Marko, 2008; Kschon-
sak and Haering, 2015).
Over the years studies of chromosome structure have focused
almost entirely on the chromatin. Major controversies have been
concerned with the folding of the chromatin fiber, which was first
Molecular Cell 64, 1–13, NovThis is an open access article und
proposed to undergo random spaghetti-like packing (DuPraw,
1966) and more recently envisioned as a polymer melt (Eltsov
et al., 2008; Nishino et al., 2012). Others suggested that chromo-
somes have an organized hierarchy of packing interactions, from
helical coiling around the nucleosome (Luger et al., 1997) to a so-
lenoidal 30 nm fiber (Finch and Klug, 1976) to larger gyres (Bajer,
1959; Belmont et al., 1987; Boy de la Tour and Laemmli, 1988;
Kireeva et al., 2004; Kuwada, 1939; Ohnuki, 1968; Rattner and
Lin, 1985; Sedat and Manuelidis, 1978; Strukov et al., 2003).
A third class of models proposes that mitotic chromosomes
consist of chromatin loops constrained by non-histone proteins
(Adolphs et al., 1977; Paulson and Laemmli, 1977; Marsden and
Laemmli, 1979; Earnshaw and Laemmli, 1983). Recent support
for this loop model comes from Hi-C studies suggesting that
human mitotic chromosomes are composed of a linear array of
chromatin loops 80–120 kb in length (Naumova et al., 2013)
and from advanced light microscopy methods (Liang et al.,
2015).
These models all neglected a thin surface layer that has been
recognized on chromosomes by classical light microscopy
(Ohnuki, 1968), fluorescence microscopy (Chaly et al., 1984;
McKeon et al., 1984), and electron microscopy (Booth et al.,
2014; Gautier et al., 1992a). Over the years the periphery was
little studied, and its composition was largely undefined (for re-
view, see Van Hooser et al., 2005). Methods for its functional
analysis were lacking, and it appeared to be simply a thin, amor-
phous layer sticking to the chromosome. We recently showed
that the chromosome periphery compartment requires the pres-
ence of Ki-67 for its assembly (Booth et al., 2014). Ki-67 was
discovered as the target of a monoclonal antibody against the
nuclei of Hodgkin’s lymphoma cells that is now one of the
most widely used histological markers for cell proliferation (Whit-
field et al., 2006). The gene encodes a huge protein of 3,256 aa
that contains 16 repeats of unknown function and that binds
chromatin and heterochromatin protein HP1 (Scholzen et al.,
2002). Ki-67 is located in the nucleolus during interphase and
at themitotic chromosome periphery from late prophase through
telophase of mitosis (Gautier et al., 1992b; Hernandez-Verdun
and Gautier, 1994). It has recently been proposed that Ki-67
coats the chromosome surface as a coat of �80-nm-long
‘‘brush-like’’ structures that functions as a biological surfactant
ember 17, 2016 ª 2016 The Author(s). Published by Elsevier Inc. 1er the CC BY license (http://creativecommons.org/licenses/by/4.0/).
Please cite this article in press as: Booth et al., 3D-CLEM Reveals that a Major Portion of Mitotic Chromosomes Is Not Chromatin, Molecular Cell(2016), http://dx.doi.org/10.1016/j.molcel.2016.10.009
(Cuylen et al., 2016). In its absence, chromosomes clump
together and nucleolar reactivation is impeded (Booth et al.,
2014; Cuylen et al., 2016).
Here we have combined light microscopy, serial block-face
scanning electron microscopy (SBF SEM), and modeling to
develop a semi-automated data processing pipeline that we
term 3D-CLEM. 3D-CLEM has allowed us to determine the
length, width, surface area, volume, and DNA packing density
of all normal human chromosomes and to determine the
DNA content of a small synthetic artificial chromosome (Nakano
et al., 2008). Detailed comparison of prophase and metaphase
chromosomes (the latter plus and minus Ki-67) yielded several
major surprises. First, we were surprised to find that methods
used to calculate the volumes of chromosomes based on light
microscopy give reproducible, but wildly inaccurate, values.
Second, careful analysis of the relative chromosome, chromatin,
and periphery volume has revealed that the periphery consti-
tutes a very much larger percentage of the chromosomal volume
than recently envisioned. Indeed, in metaphase RPE1 cells,
chromatin may comprise as little as 53% of the total chromo-
some volume. This conclusion that the periphery compartment
is much more significant than previously appreciated arose
initially from analysis of correlative light and electron microscopy
images, but quantitative proteomics analysis also confirmed that
putative periphery components comprise more than 33% of the
mass of chromosomal proteins. These results reveal that chro-
mosomes are not simply chromatin structures. As a result, earlier
physical and structural studies of mitotic chromosomes may
need to be reassessed.
RESULTS AND DISCUSSION
Establishing 3D-CLEM: Multimodal Microscopy forTargeted Organelle AnalysisMany key structural features of mitotic chromosomes fall in be-
tween the optimal working resolutions of the light and electron
microscope. We have therefore developed a pipeline for the
three-dimensional analysis of chromosomes by correlative light
and serial block-face scanning electron microscopy. This pipe-
line, which we refer to as 3D-CLEM, allows the modeling of
any aspect of chromosome architecture that can be contrasted
with electron-dense stains at a resolution of 12–24 3 12–24 3
60 nm, in x, y, and z, respectively. When combinedwith high-res-
olution light microscopy, in which individual chromosomal com-
ponents are imaged using fluorescent labels, this allows a much
more comprehensive visualization of the chromosome, or of any
other subcellular organelle for which three-dimensional data
are desired. The 3D-CLEM pipeline is described in Figure 1.
As a first test of the 3D-CLEM method, we performed a
targeted analysis of a synthetic human artificial chromosome
(HAC) (Figure 2). HACs are autonomous DNA elements that repli-
cate and segregate accurately during each cell division with
an efficiency approaching that of natural chromosomes. HACs
have been proposed as potential vectors for gene therapy
because they overcome several limitations of current gene deliv-
ery methods (Kouprina et al., 2014).
The alphoidtetO HACwas assembled from a circular input DNA
construct of 50 kb based on a repeating alpha-satellite dimer
2 Molecular Cell 64, 1–13, November 17, 2016
having one monomer from chromosome 17 with a CENP-B
binding site and one synthetic monomer based on the Choo
consensus sequence (Choo et al., 1991) and containing a tetra-
cycline operator in place of the CENP-B box. When introduced
into HT1080 fibrosarcoma cells, this 50 kb construct assembled
into a fully functional, stable chromosome (Nakano et al., 2008).
Previous structural characterization of the synthetic alphoidtetO
HAC consisted of molecular analysis of its DNA organiza-
tion by transformation-associated recombination (TAR) cloning,
pulsed field gel electrophoresis, and fiber-FISH (fluorescence
in situ hybridization) (Kouprina et al., 2014). During its formation,
the HAC acquired 4.2 Mb of DNA from a gene-poor region of the
arm of chromosome 13 containing the 407 kb KLHL1 gene (MIM
605332) and the 32 kb ATXN80 gene (MIM 603680), and the
alphoidtetO array was expanded to roughly 1.1 Mb (Kouprina
et al., 2012, 2014).
We used light microscopy to confirm that the HAC possesses
all major chromosome functional compartments. We stained
metaphase chromosomes from 1C7 cells, containing a single
copy of the alphoidtetO HAC, with antibodies recognizing
different chromosome compartments. We could clearly see
CENP-C (kinetochore), SMC2 (chromosome scaffold), and
Ki-67 (chromosome periphery) on the HAC (Figure S1A).
Together, these data suggest that the alphoidtetO HAC is a
normal chromosome.
We next analyzed a mitotic 1C7 cell using 3D-CLEM. The
alphoidtetO HAC was detected by expressing a tetR-EYFP fusion
protein in 1C7 cells. A suitable mitotic cell with the HAC slightly
separated from the other chromosomes was identified by LM
(Figure 2A), then processed and imaged by SBF SEM. All of
the mitotic chromosomes were found in �600 3View sections
(Figure 2B). CLEM registration, using both LM and SBF SEM im-
ages, revealed the presence of the HAC in 16 consecutive SBF
SEM sections (Figure 2C). When the 2D EM data were converted
into a volume format, using ImageJ volume viewer (Figures 2D
and 2E), we could clearly observe the presence of a normal
trilaminar kinetochore on the surface of the alphoidtetO HAC,
which had two clearly distinct sister chromatids (Figure 2Eiii,
white arrow).
Semi-automated rendering and segmentation identified 101
individual chromosomes in this 1C7 cell (Figures 2Fi–2Fiv;
Movie S1). This chromosome number reflects the fact that 1C7
cells are a fusion between HT1080 and HeLa cells (Cardinale
et al., 2009). The alphoidtetO HAC was by far the smallest
chromosome (volume: 0.122 mm3, surface area: 2.7 mm2). Deter-
mination of identity of the other chromosomes was not possible
due to the large number of chromosomes and structural chromo-
some reorganizations that occurred during the history of 1C7
and its parental cell lines.
3D-CLEM of Prophase ChromosomesImaging of early prophase chromosomes allowed us to observe
the condensed mitotic chromatin before it acquired a periphery
compartment after nucleolar disassembly.
Using the RPE1 cell line, which has a stable modal karyotype
of 46 chromosomes (Figure S2), we identified an early prophase
cell using light microscopy (Figure 3Ai) and processed it for SBF
SEM (Figure 3Aii). Although prophase chromosomes generate

Figure 1. 3D-CLEM Workflow
(A) Cells seeded onto gridded dishes (MatTek) are
transfected to express fluorescent fusion pro-
teins. Cells are imaged live or fixed for 1 hr with
glutaraldehyde before being treated with dyes (for
example, DAPI, to visualize DNA) or probed with
antibodies as appropriate (Booth et al., 2011).
(B) Both overview (203) and high-magnification
(1003) light microscopy (LM) images are acquired
for the cells of interest. Coverslip coordinates were
recorded using phase contrast, aiding location of
target cells during later stages of the method.
(C) Sampleswere stainedwith osmium, tannic acid,
uranyl acetate, and lead aspartate to generate
contrast for electron microscopy, then dehydrated
with a graded ethanol series before infiltration with
resin. Samples were covered in 100% resin and
cured at 60�C for 48 hr.
(D) The sample was separated from the dish (Booth
et al., 2013), excess resin excised, and the re-
maining 1 3 1 mm block glued to a pin (left and
central panels). Using the coordinates imprinted on
the block face, the area of resin containing the cell
of interest was fine-trimmed into a 100 3 100 mm
block using an ultra-microtome (right panel) and
coated with silver paint and gold palladium. A
single cell can be observed (far right image).
(E) The sample was mounted into a Gatan 3View
microtome, and the block face was repeatedly
imaged during the removal of consecutive sec-
tions. This provides lossless acquisition in which
the entire cell can be imaged and reconstructed.
CLEM registration, merging both LM and EM data,
was used to identify cells and structures of interest.
(F) Cells and structures of interest were annotated
and segmented using Amira software (FEI), re-
sulting in a nanometer resolution, three-dimen-
sional model suitable for further geometric anal-
ysis. For preliminary tests, a DT40 chicken
lymphoma cell was analyzed and modeled. From
start to finish, this method requires R5.5 days,
subject to the time dedicated to image annotation
and data analysis. The typical resolution of the
generated models is 12–24 3 12–24 3 60 nm in
x, y, and z, respectively (60 nm was the thickness
of the sections cut in the 3View).
Scale bars, 20 mm (B); 200 mm (D); 1 mm (F).
Please cite this article in press as: Booth et al., 3D-CLEM Reveals that a Major Portion of Mitotic Chromosomes Is Not Chromatin, Molecular Cell(2016), http://dx.doi.org/10.1016/j.molcel.2016.10.009
less contrast compared with chromosomes during later mitotic
stages, digital registration of both the optical and the physical
microscopy sections allowed us to discriminate between
chromosomes (Figure 3Aiii) and other intracellular structures,
including the nucleolus, which was not stained with DAPI. A
grayscale threshold was used to confirm the distinction between
the chromosomes and nucleolus (prophase chromosomes were
36% darker). Both the chromosomes and the nucleolus were
modeled using the SBF SEM dataset (Figure 3B; Figures S3A
and S3B; Movie S2).
Mo
Segmentation analysis confirmed the
presence of 43 discrete units (Figures 3C
and 3D), with an average diameter of
0.64 ± 0.19 mm and a combined volume
of 109.8 mm3. Prophase chromosomes exhibited an irregular
‘‘lumpy’’ surface with a total area of 1175 mm2 (Figures 3Cv
and 3Cvi). It is tempting to speculate that the lumps could corre-
spond to topologically associated domains (TADs) or other
aspects of interphase chromatin organization that had not yet
disassembled in this early prophase cell (Dekker et al., 2013).
Because the total DNA content of a dividing cell is 12,344 Mb
and the collective chromosome volume is 109.8 mm3, we calcu-
late that the DNA compaction ratio of prophase chromosomes
is 112.4 Mb/mm3.
lecular Cell 64, 1–13, November 17, 2016 3
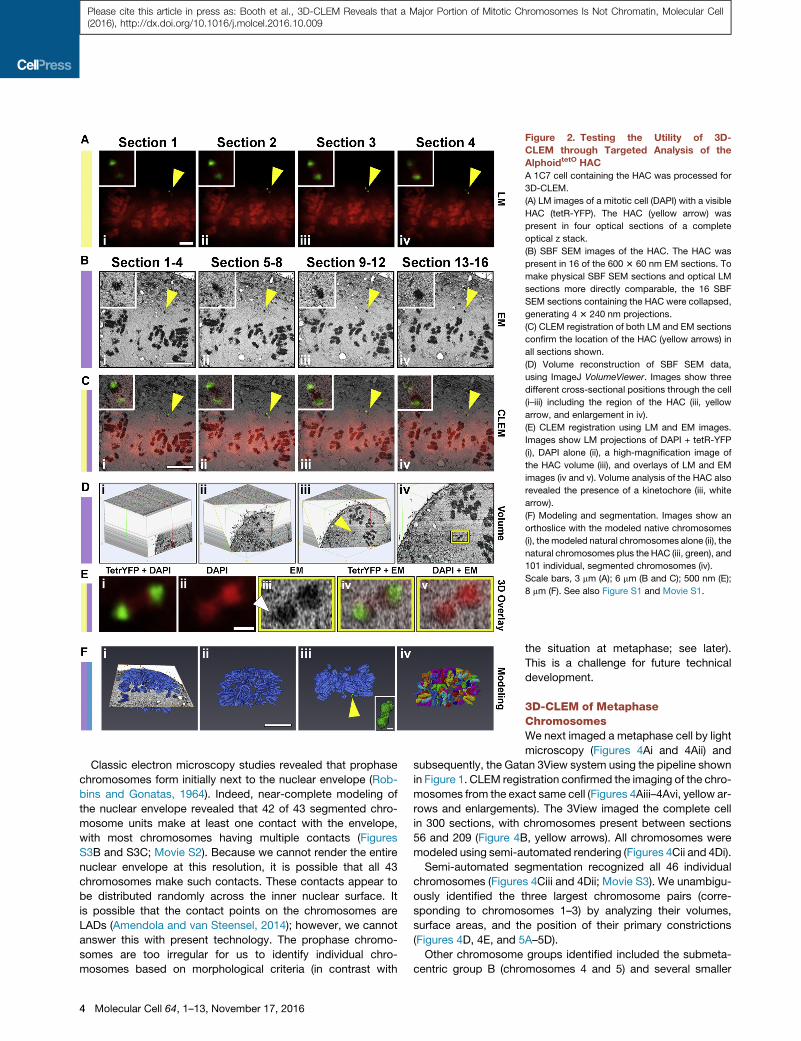
Figure 2. Testing the Utility of 3D-
CLEM through Targeted Analysis of the
AlphoidtetO HAC
A 1C7 cell containing the HAC was processed for
3D-CLEM.
(A) LM images of a mitotic cell (DAPI) with a visible
HAC (tetR-YFP). The HAC (yellow arrow) was
present in four optical sections of a complete
optical z stack.
(B) SBF SEM images of the HAC. The HAC was
present in 16 of the 600 3 60 nm EM sections. To
make physical SBF SEM sections and optical LM
sections more directly comparable, the 16 SBF
SEM sections containing the HAC were collapsed,
generating 4 3 240 nm projections.
(C) CLEM registration of both LM and EM sections
confirm the location of the HAC (yellow arrows) in
all sections shown.
(D) Volume reconstruction of SBF SEM data,
using ImageJ VolumeViewer. Images show three
different cross-sectional positions through the cell
(i–iii) including the region of the HAC (iii, yellow
arrow, and enlargement in iv).
(E) CLEM registration using LM and EM images.
Images show LM projections of DAPI + tetR-YFP
(i), DAPI alone (ii), a high-magnification image of
the HAC volume (iii), and overlays of LM and EM
images (iv and v). Volume analysis of the HAC also
revealed the presence of a kinetochore (iii, white
arrow).
(F) Modeling and segmentation. Images show an
orthoslice with the modeled native chromosomes
(i), themodeled natural chromosomes alone (ii), the
natural chromosomes plus the HAC (iii, green), and
101 individual, segmented chromosomes (iv).
Scale bars, 3 mm (A); 6 mm (B and C); 500 nm (E);
8 mm (F). See also Figure S1 and Movie S1.
Please cite this article in press as: Booth et al., 3D-CLEM Reveals that a Major Portion of Mitotic Chromosomes Is Not Chromatin, Molecular Cell(2016), http://dx.doi.org/10.1016/j.molcel.2016.10.009
Classic electron microscopy studies revealed that prophase
chromosomes form initially next to the nuclear envelope (Rob-
bins and Gonatas, 1964). Indeed, near-complete modeling of
the nuclear envelope revealed that 42 of 43 segmented chro-
mosome units make at least one contact with the envelope,
with most chromosomes having multiple contacts (Figures
S3B and S3C; Movie S2). Because we cannot render the entire
nuclear envelope at this resolution, it is possible that all 43
chromosomes make such contacts. These contacts appear to
be distributed randomly across the inner nuclear surface. It
is possible that the contact points on the chromosomes are
LADs (Amendola and van Steensel, 2014); however, we cannot
answer this with present technology. The prophase chromo-
somes are too irregular for us to identify individual chro-
mosomes based on morphological criteria (in contrast with
4 Molecular Cell 64, 1–13, November 17, 2016
the situation at metaphase; see later).
This is a challenge for future technical
development.
3D-CLEM of MetaphaseChromosomesWe next imaged a metaphase cell by light
microscopy (Figures 4Ai and 4Aii) and
subsequently, the Gatan 3View system using the pipeline shown
in Figure 1. CLEM registration confirmed the imaging of the chro-
mosomes from the exact same cell (Figures 4Aiii–4Avi, yellow ar-
rows and enlargements). The 3View imaged the complete cell
in 300 sections, with chromosomes present between sections
56 and 209 (Figure 4B, yellow arrows). All chromosomes were
modeled using semi-automated rendering (Figures 4Cii and 4Di).
Semi-automated segmentation recognized all 46 individual
chromosomes (Figures 4Ciii and 4Dii; Movie S3). We unambigu-
ously identified the three largest chromosome pairs (corre-
sponding to chromosomes 1–3) by analyzing their volumes,
surface areas, and the position of their primary constrictions
(Figures 4D, 4E, and 5A–5D).
Other chromosome groups identified included the submeta-
centric group B (chromosomes 4 and 5) and several smaller
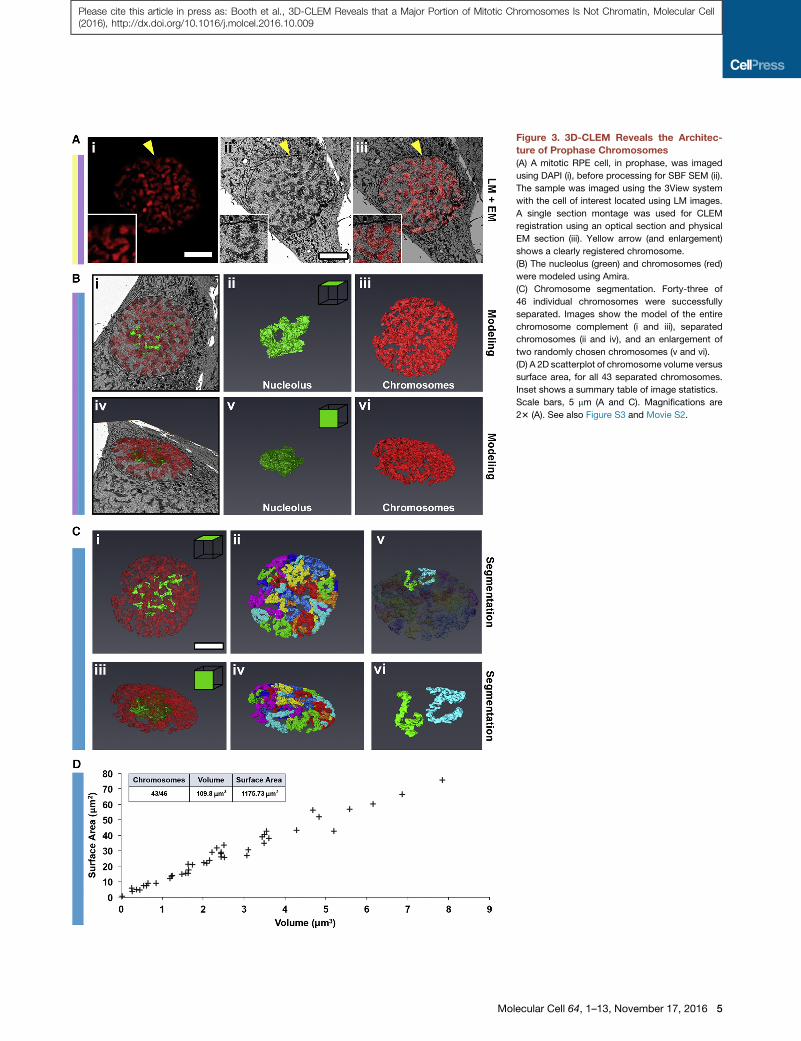
Figure 3. 3D-CLEM Reveals the Architec-
ture of Prophase Chromosomes
(A) A mitotic RPE cell, in prophase, was imaged
using DAPI (i), before processing for SBF SEM (ii).
The sample was imaged using the 3View system
with the cell of interest located using LM images.
A single section montage was used for CLEM
registration using an optical section and physical
EM section (iii). Yellow arrow (and enlargement)
shows a clearly registered chromosome.
(B) The nucleolus (green) and chromosomes (red)
were modeled using Amira.
(C) Chromosome segmentation. Forty-three of
46 individual chromosomes were successfully
separated. Images show the model of the entire
chromosome complement (i and iii), separated
chromosomes (ii and iv), and an enlargement of
two randomly chosen chromosomes (v and vi).
(D) A 2D scatterplot of chromosome volume versus
surface area, for all 43 separated chromosomes.
Inset shows a summary table of image statistics.
Scale bars, 5 mm (A and C). Magnifications are
23 (A). See also Figure S3 and Movie S2.
Molecular Cell 64, 1–13, November 17, 2016 5
Please cite this article in press as: Booth et al., 3D-CLEM Reveals that a Major Portion of Mitotic Chromosomes Is Not Chromatin, Molecular Cell(2016), http://dx.doi.org/10.1016/j.molcel.2016.10.009

Figure 4. 3D-CLEM of All 46 Human Meta-
phase Chromosomes
(A) Amitotic RPE cell was identified using DAPI and
phase contrast (i and ii) before processing for SBF
SEM. The sample was imaged using the 3View
system, with the cell of interest located using LM
images. A single section montage was used for
CLEM registration using an LM optical section (iii
and iv), a physical SBF SEM section (v), and an
overlay of the two (vi). A clear overlap can be seen
between the DAPI- and contrast-stained chromo-
somes of the EM micrograph. (v and vi) Yellow
arrows point to magnified regions of perfect LM
and EM registration.
(B) Five of the 300 SBF SEM images acquired.
Very early and late sections (13 and 248), the
first and last sections to contain chromosomes
(56 and 209, yellow arrows), and a middle section
where numerous chromosomes are visible (150)
are shown.
(C) Chromosome modeling and segmentation with
an orthoslice. Images show the orthoslice alone (i),
the chromosome complement model traversing
the orthoslice (ii), and the segmented chromo-
somes model traversing the orthoslice (iii).
(D) Chromosome modeling alone. Images
show the full chromosome complement (i) and
segmented chromosomes (ii). Arrows point to ex-
amples of individual chromosomes shown in the
zoom panels. These include examples of meta-
centric (cyan) and submetacentric (red, orange)
chromosomes.
(E) A 2D scatterplot of chromosome surface area
versus chromosome volume for all 46 chromo-
somes. Colored marks represent unambiguously
characterized chromosomes, including two copies
of chromosome 1 (indigo), chromosome 2 (pink),
chromosome 3 (green), chromosome 4 (purple),
and chromosome 5 (cyan). Two copies of chro-
mosomes 19–22 (peach) were also identified. Inset
is a summary table of image statistics.
Scale bars, 10 mm (Ai, Aiii, Av, left panel, B–D), 2 mm
(Av, right panel). See also Figure S2 and Movie S3.
Please cite this article in press as: Booth et al., 3D-CLEM Reveals that a Major Portion of Mitotic Chromosomes Is Not Chromatin, Molecular Cell(2016), http://dx.doi.org/10.1016/j.molcel.2016.10.009
chromosomes from groups E, F, and G (Figures 4E and 5D;
Table S1).
The chromosome diameter (mean = 1.15 ± 0.12 mm for the
paired sister chromatids) was remarkably constant regardless
of DNA content (Figures 5B and 5C) and was significantly larger
and less variable than that of prophase chromosomes. The total
volume occupied by all 46 chromosomes was 175.9 mm3, with
a combined surface area of 899 mm2, 23% less than that
6 Molecular Cell 64, 1–13, November 17, 2016
of prophase chromosomes (Figure 4E).
This decrease in surface area may arise
in part because the surface of mitotic
chromosomes is much smoother than
that of their prophase counterparts (cf.
Figures 3Cvi and 4Dii) and in part
because of increased chromatin compac-
tion. Plotting the DNA content (http://
www.ensembl.org) of diploid chromo-
somes that could be unambiguously iden-
tified as a function of chromosome volume revealed an almost
perfectly linear relationship (Figure 5D), suggesting that chro-
mosome compaction is constant regardless of chromosome
shape or size.
A previous electron microscopy study estimated that human
mitotic chromosomeswerecomposedof anaggregation of radial
loops of 83 kb (Earnshaw and Laemmli, 1983). Given the packing
density measured above from full 3D volume measurements, we
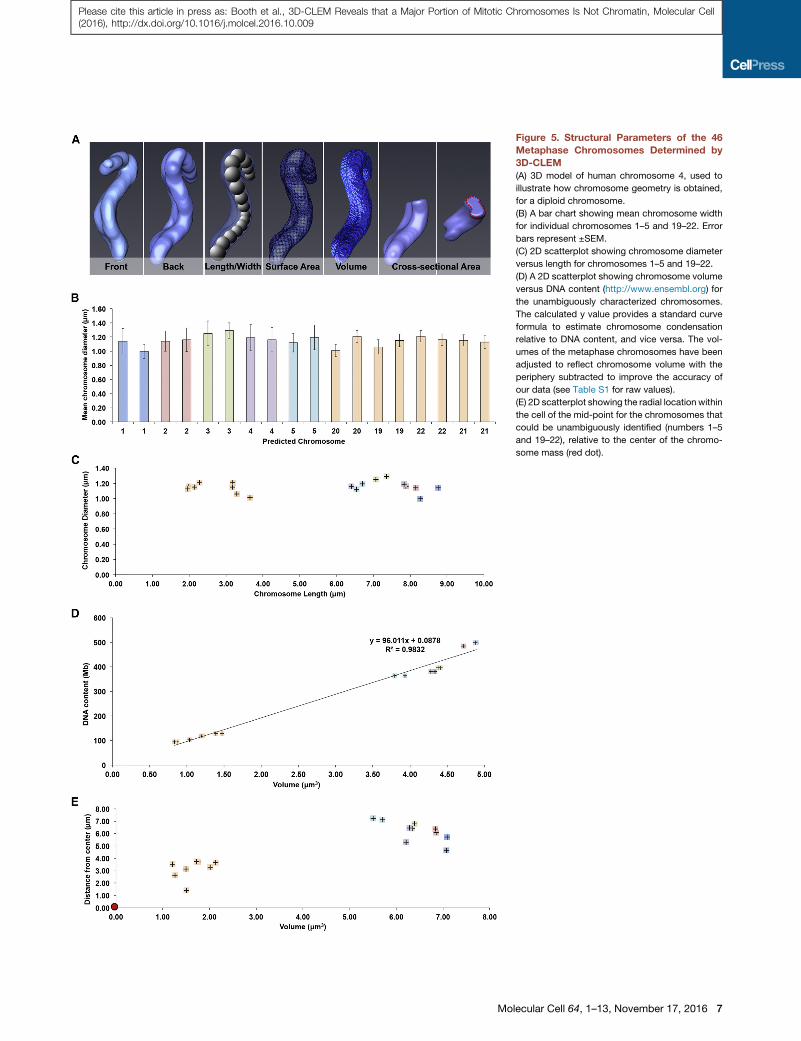
Figure 5. Structural Parameters of the 46
Metaphase Chromosomes Determined by
3D-CLEM
(A) 3D model of human chromosome 4, used to
illustrate how chromosome geometry is obtained,
for a diploid chromosome.
(B) A bar chart showing mean chromosome width
for individual chromosomes 1–5 and 19–22. Error
bars represent ±SEM.
(C) 2D scatterplot showing chromosome diameter
versus length for chromosomes 1–5 and 19–22.
(D) A 2D scatterplot showing chromosome volume
versus DNA content (http://www.ensembl.org) for
the unambiguously characterized chromosomes.
The calculated y value provides a standard curve
formula to estimate chromosome condensation
relative to DNA content, and vice versa. The vol-
umes of the metaphase chromosomes have been
adjusted to reflect chromosome volume with the
periphery subtracted to improve the accuracy of
our data (see Table S1 for raw values).
(E) 2D scatterplot showing the radial location within
the cell of the mid-point for the chromosomes that
could be unambiguously identified (numbers 1–5
and 19–22), relative to the center of the chromo-
some mass (red dot).
Molecular Cell 64, 1–13, November 17, 2016 7
Please cite this article in press as: Booth et al., 3D-CLEM Reveals that a Major Portion of Mitotic Chromosomes Is Not Chromatin, Molecular Cell(2016), http://dx.doi.org/10.1016/j.molcel.2016.10.009
Please cite this article in press as: Booth et al., 3D-CLEM Reveals that a Major Portion of Mitotic Chromosomes Is Not Chromatin, Molecular Cell(2016), http://dx.doi.org/10.1016/j.molcel.2016.10.009
estimate that there are on average 1,040 loops/mm3 along the
condensed mitotic chromosome, or 123,500 loops in total per
mitotic cell. This is reasonably similar to the value of 95,000 loops
of 63 kb proposed more than 30 years ago (Pienta and Coffey,
1984), based on a literature survey of a number of studies of chro-
matin domains (Paulson and Laemmli, 1977; Cook and Brazell,
1978; Marsden and Laemmli, 1979).
The availability of these packing data for known chromosomes
enabled us to perform an independent estimate of the DNA con-
tent of the alphoidtetO HAC. For this, we generated a standard
curve by combining chromosome packing data from both meta-
phase RPE1 and DT40 cells (Figure S1Bi). From the calculated
slope of the curve of DNA content versus volume, we estimated
the HAC to be �11.17 Mb, or �5.58 Mb per sister chromatid
(Figure 1Bii, green box). This is very close to the roughly 5 Mb
previously estimated by molecular biology methods (Kouprina
et al., 2012, 2014). Combining the results from 3D-CLEM and
molecular analysis strongly suggests that the packing density
of chromatin in the synthetic alphoidtetO HAC and the other
native human chromosomes is comparable. Thus, the mecha-
nisms used to form condensed mitotic chromosomes are
independent of chromosome shape, size, and possibly even
species.
The present analysis of a retinal pigment epithelium (RPE) cell
also yielded information about the distribution of metaphase
chromosomes within the cell. As suggested by two previous
studies (McIntosh and Landis, 1971; Mosgoller et al., 1991),
larger chromosomes were positioned toward the cell periphery
(average position 6.21 ± 0.8 mm from the cell center), and
smaller chromosomes were located more centrally (3.13 ±
0.78 mm) (Figure 5E). The reason for this phenomenon is not
known.
Structure of Mitotic Chromosomes Lacking Ki-67We previously reported that Ki-67, which is recruited to the chro-
mosome periphery in late prophase after nucleolar disassembly
(Figure 6A), is required for assembly of much or all of the mitotic
chromosome periphery and for keeping chromosomes individu-
alized during mitosis and mitotic exit (Booth et al., 2014). This
was confirmed by a recent study, which argued that Ki-67 acts
like a biological surfactant on the chromosome surface (Cuylen
et al., 2016). To test the role of Ki-67 in mitotic chromosome
packing, we performed 3D-CLEM of a metaphase RPE1 cell
depleted of Ki-67 (Figures 6B–6E).
We could readily identify and model the Ki-67-depleted chro-
mosomes (Figure 6C), but segmentation analysis identified only
20 individual units, rather than the 46 seen in wild-type cells (Fig-
ures 6D and 6E). This confirms the clumping of Ki-67-depleted
chromosomes as reported in previous studies (Cuylen et al.,
2016; Booth et al., 2014). The total chromosome volume,
170 mm3 (Figure 6E), was slightly less than that of unperturbed
metaphase chromosomes, but light microscope modeling
revealed that the DNA occupied a significantly larger volume
(Figures S4C and S4D).We calculated (see Supplemental Exper-
imental Procedures) that in these chromosomes the thickness of
the periphery layer is likely to be significantly thinner, about
77 nm (roughly half the normal value seen in metaphase cells).
This may account for the fact that the surface of the chromo-
8 Molecular Cell 64, 1–13, November 17, 2016
somes looks significantly ‘‘rougher’’ than the surface of unper-
turbedmetaphase chromosomes (Figure 6Diii), andmay suggest
that there is a small, Ki-67-independent periphery compartment.
This analysis therefore confirmed that Ki-67 is responsible for
assembly of a significant portion of the chromosome periphery,
and in its absence the mitotic chromatin is slightly less com-
pacted than normal.
Rethinking the Structure of Mitotic ChromosomesWe were extremely surprised to find that the total volume of
metaphase chromosomes is 38% greater than that of prophase
chromosomes (176 versus 110 mm3; Figure S4D). This was
particularly surprising, given that a recent study of RPE1 cells
by light microscopy reported that prophase chromosomes had
a significantly larger volume than metaphase chromosomes
(450–800 versus 240 mm3, numbers are extracted from figure 2
in Nagasaka et al., 2016). Indeed, in the present study, the
volume of DAPI-stained prophase chromosomes (635 mm3)
was also significantly larger than the metaphase volume
(256 mm3). These values correspond well to the published fig-
ures, but they are remarkably different from the chromosome
volumes for the same cells determined by electron microscopy
(Figure S4).
Because our experiments used CLEM, we could measure
the diameter of the identical prophase and metaphase chromo-
somes in the light and electron microscope (Figure S5). The re-
sulting values were essentially identical.
We can also be confident in the z value in the EM images,
because an 18.66 mmmetaphase cell was sectioned in 300 sec-
tions (�60 nm per section, as specified on the 3View). The vol-
ume discrepancy appears to be due to problems with structural
modeling of light micrographs in the z direction (where resolution
is less). This confounding effect of limiting z of resolution is sup-
ported by our attempts to apply the same segmentation param-
eters used for the EM data to the light microscope data. When
segmented by Amira, only 6 individual chromosomes could be
recognized in prophase, compared with 43 in the EM (Figures
S4A and S4D). This raises the important caveat that volumemea-
surements from light microscopy of complex objects may differ
systematically, and significantly from reality for objects where
modeling of fine features is required.
Having established that the volume of prophase chromo-
somes is actually less than that of metaphase, we noted that
the volume of the nucleolus (54.4 mm3) almost exactly explains
the difference between the two. All known chromosome periph-
ery proteins, including Ki-67, reside within the nucleolus during
interphase and re-localize to the chromosome periphery after
nucleolar disassembly in late prophase (Gautier et al., 1992b).
If we add the volume of the nucleolus to that of the prophase
chromatin, we achieve a final volume of 164 mm3, which is
much closer to the metaphase volume (176 mm3). Interestingly,
if we model the prophase chromosomes as a cylinder (V =
pr2h), uniform addition of the nucleolar material to the early
prophase chromatin would generate a perichromosomal layer
70 nm thick (Supplemental Experimental Procedures). This is
in remarkable agreement with the recent observation that the
Ki-67 layer on mitotic chromosomes is 87 nm thick (Cuylen
et al., 2016).

Figure 6. 3D-CLEM of Metaphase Chromo-
somes Depleted of Ki-67
(A) Light microscopy and visualization of the
chromosome periphery on RPE metaphase chro-
mosomes using antibodies against anti-centro-
mere antibody (ACA), nucleolin, and Ki-67.
(B) AmitoticRPEcell, depletedofKi-67usingsiRNA,
was identified using DAPI and phase contrast (i–iii)
before processing for SBFSEM (iv). The samplewas
imaged using the 3View system and the cell of
interest located using LM images. A single section
montage was used for CLEM registration using an
LMoptical section and a physical SBF SEM section.
An overlay of the two is shown (v).
(C) Chromosome modeling and segmentation
with an orthoslice. Images show the orthoslice
alone (i and v), the chromosome complement
model traversing the orthoslice (ii and vi), the
chromosome complement model alone (iii and
vii), and the segmented chromosomes model
traversing the orthoslice (iv and viii).
(D) Segmented chromosomes. Images show
model of segmented chromosomes (i and ii) and
an enlargement of one randomly chosen chro-
mosome cluster (iii).
(E) A 2D scatterplot of chromosome volume
versus surface area, for all successfully sepa-
rated chromosomes. Inset is a summary table of
image statistics.
Scale bars, 1 mm (A); 5 mm (B and D).
Please cite this article in press as: Booth et al., 3D-CLEM Reveals that a Major Portion of Mitotic Chromosomes Is Not Chromatin, Molecular Cell(2016), http://dx.doi.org/10.1016/j.molcel.2016.10.009
Previous measurements of the thickness of the periphery layer
on metaphase chromosomes have ranged from 143 nm (our
measurements from the micrographs of Gautier et al., 1992a) to
160 nm (Booth et al., 2014). If we model the chromosomes as a
cylinder and include a periphery compartment of 150 nm in the
volume, we find that the chromatin volume of metaphase chro-
mosomes is actually 15% less than that of the prophase chromo-
Mo
somes determined here (calculations in
Supplemental Experimental Procedures).
This suggests that much of mitotic chro-
matin compaction is actually completed
by early prophase, and that subsequent
changes in morphology involve primar-
ily remodeling (primarily shortening and
thickening) of the structure, resulting in a
further 15% compaction.
An extremely surprising conclusion
from this analysis is that a very substantial
percentage of mitotic chromosomes is
not composed of chromatin. On a volume
basis, we calculate that from 30% to 47%
of the chromosome volume is actually in
the periphery compartment. This sounds
counterintuitive, but volume scales with
the cube of the radius, so a relatively
thin surface layer contains a substantial
proportion of the total volume.
Detailed analysis of proteomic data
backs up the surprising conclusion that
mitotic chromosomes are only 53%–70% chromatin (Ohta
et al., 2010; Samejima et al., 2015). We conducted a clus-
tering and correlation analysis of our total proteomic data (Fig-
ure 7) and could identify two major clusters corresponding to
nucleolar and known periphery proteins (red) and ribosomal
and RNA-associated proteins (purple). Ki-67 (red) occupied
a separate position in the analysis. Using the intensity-based
lecular Cell 64, 1–13, November 17, 2016 9
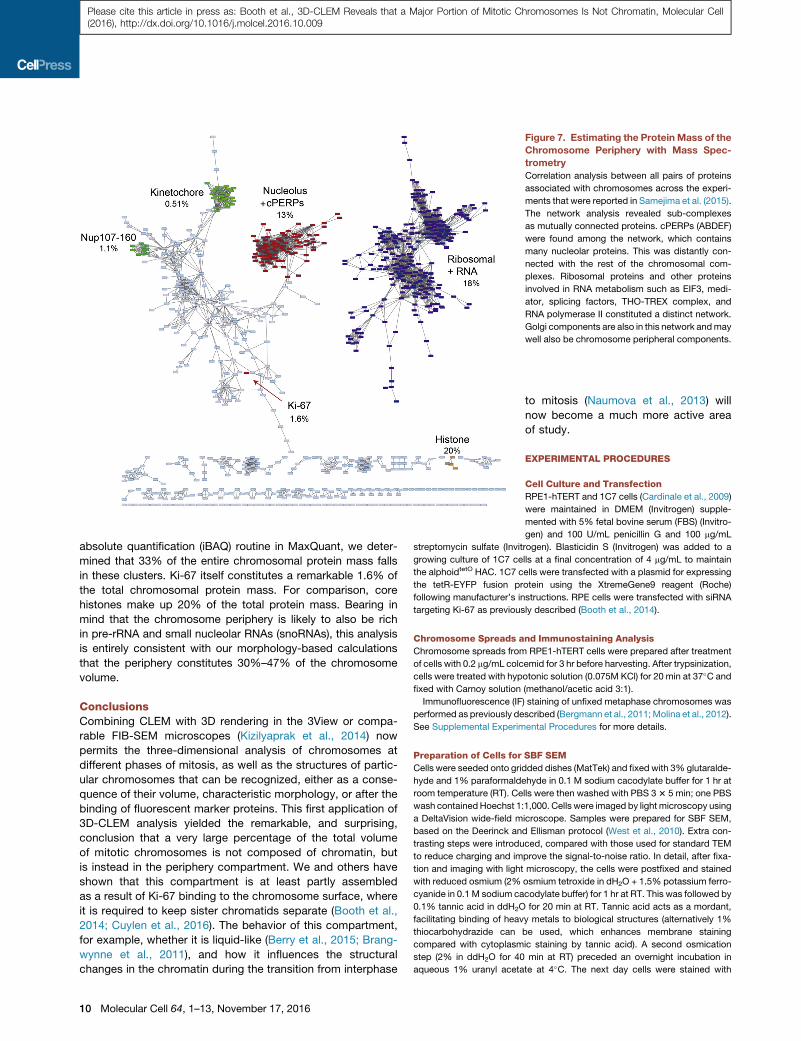
Figure 7. Estimating the Protein Mass of the
Chromosome Periphery with Mass Spec-
trometry
Correlation analysis between all pairs of proteins
associated with chromosomes across the experi-
ments that were reported in Samejima et al. (2015).
The network analysis revealed sub-complexes
as mutually connected proteins. cPERPs (ABDEF)
were found among the network, which contains
many nucleolar proteins. This was distantly con-
nected with the rest of the chromosomal com-
plexes. Ribosomal proteins and other proteins
involved in RNA metabolism such as EIF3, medi-
ator, splicing factors, THO-TREX complex, and
RNA polymerase II constituted a distinct network.
Golgi components are also in this network andmay
well also be chromosome peripheral components.
Please cite this article in press as: Booth et al., 3D-CLEM Reveals that a Major Portion of Mitotic Chromosomes Is Not Chromatin, Molecular Cell(2016), http://dx.doi.org/10.1016/j.molcel.2016.10.009
absolute quantification (iBAQ) routine in MaxQuant, we deter-
mined that 33% of the entire chromosomal protein mass falls
in these clusters. Ki-67 itself constitutes a remarkable 1.6% of
the total chromosomal protein mass. For comparison, core
histones make up 20% of the total protein mass. Bearing in
mind that the chromosome periphery is likely to also be rich
in pre-rRNA and small nucleolar RNAs (snoRNAs), this analysis
is entirely consistent with our morphology-based calculations
that the periphery constitutes 30%–47% of the chromosome
volume.
ConclusionsCombining CLEM with 3D rendering in the 3View or compa-
rable FIB-SEM microscopes (Kizilyaprak et al., 2014) now
permits the three-dimensional analysis of chromosomes at
different phases of mitosis, as well as the structures of partic-
ular chromosomes that can be recognized, either as a conse-
quence of their volume, characteristic morphology, or after the
binding of fluorescent marker proteins. This first application of
3D-CLEM analysis yielded the remarkable, and surprising,
conclusion that a very large percentage of the total volume
of mitotic chromosomes is not composed of chromatin, but
is instead in the periphery compartment. We and others have
shown that this compartment is at least partly assembled
as a result of Ki-67 binding to the chromosome surface, where
it is required to keep sister chromatids separate (Booth et al.,
2014; Cuylen et al., 2016). The behavior of this compartment,
for example, whether it is liquid-like (Berry et al., 2015; Brang-
wynne et al., 2011), and how it influences the structural
changes in the chromatin during the transition from interphase
10 Molecular Cell 64, 1–13, November 17, 2016
to mitosis (Naumova et al., 2013) will
now become a much more active area
of study.
EXPERIMENTAL PROCEDURES
Cell Culture and Transfection
RPE1-hTERT and 1C7 cells (Cardinale et al., 2009)
were maintained in DMEM (Invitrogen) supple-
mented with 5% fetal bovine serum (FBS) (Invitro-
gen) and 100 U/mL penicillin G and 100 mg/mL
streptomycin sulfate (Invitrogen). Blasticidin S (Invitrogen) was added to a
growing culture of 1C7 cells at a final concentration of 4 mg/mL to maintain
the alphoidtetO HAC. 1C7 cells were transfected with a plasmid for expressing
the tetR-EYFP fusion protein using the XtremeGene9 reagent (Roche)
following manufacturer’s instructions. RPE cells were transfected with siRNA
targeting Ki-67 as previously described (Booth et al., 2014).
Chromosome Spreads and Immunostaining Analysis
Chromosome spreads from RPE1-hTERT cells were prepared after treatment
of cells with 0.2 mg/mL colcemid for 3 hr before harvesting. After trypsinization,
cells were treated with hypotonic solution (0.075M KCl) for 20 min at 37�C and
fixed with Carnoy solution (methanol/acetic acid 3:1).
Immunofluorescence (IF) staining of unfixed metaphase chromosomes was
performed as previously described (Bergmann et al., 2011;Molina et al., 2012).
See Supplemental Experimental Procedures for more details.
Preparation of Cells for SBF SEM
Cells were seeded onto gridded dishes (MatTek) and fixed with 3% glutaralde-
hyde and 1% paraformaldehyde in 0.1 M sodium cacodylate buffer for 1 hr at
room temperature (RT). Cells were then washed with PBS 33 5 min; one PBS
wash containedHoechst 1:1,000. Cells were imaged by light microscopy using
a DeltaVision wide-field microscope. Samples were prepared for SBF SEM,
based on the Deerinck and Ellisman protocol (West et al., 2010). Extra con-
trasting steps were introduced, compared with those used for standard TEM
to reduce charging and improve the signal-to-noise ratio. In detail, after fixa-
tion and imaging with light microscopy, the cells were postfixed and stained
with reduced osmium (2% osmium tetroxide in dH2O + 1.5% potassium ferro-
cyanide in 0.1 M sodium cacodylate buffer) for 1 hr at RT. This was followed by
0.1% tannic acid in ddH2O for 20 min at RT. Tannic acid acts as a mordant,
facilitating binding of heavy metals to biological structures (alternatively 1%
thiocarbohydrazide can be used, which enhances membrane staining
compared with cytoplasmic staining by tannic acid). A second osmication
step (2% in ddH2O for 40 min at RT) preceded an overnight incubation in
aqueous 1% uranyl acetate at 4�C. The next day cells were stained with
Please cite this article in press as: Booth et al., 3D-CLEM Reveals that a Major Portion of Mitotic Chromosomes Is Not Chromatin, Molecular Cell(2016), http://dx.doi.org/10.1016/j.molcel.2016.10.009
Walton’s lead aspartate (0.02 M in lead nitrate + 0.03 M in aspartic acid in
ddH2O, adjusted to pH 5.5) for 30 min at 60�C. To prevent precipitation arti-
facts, we washed the cells for a minimum of 5 3 3 min with ddH2O between
each of the staining steps described. Next, samples were dehydrated in a
graded ethanol series of 30%, 50%, 70%, and 90% in ddH2O for 5 min
each, followed by 2 3 5 min 100% ethanol. Samples were then infiltrated
with TAAB Hard Premix resin at ratios of 1:1, 2:1, and 3:1 with resin:100%
ethanol, 30 min per incubation. Finally, samples were incubated in 100% resin
for 23 30 min, before embedding the whole dish in 2 mm of 100% fresh resin.
Samples were cured for 48 hr at 60�C.
Preparation of Blocks for 3View SBF SEM
Resin is separated from the gridded dish by trimming away the excess
plastic and carefully sliding a razor between the dish and the resin
(Booth et al., 2013). Excess resin is removed using a junior hacksaw
and scalpel before the block is mounted onto a cryo pin, cell side up,
using superglue or a non-conductive compound. Targeted trimming is per-
formed using an ultra-microtome and etched coordinates (Booth et al.,
2013).
SBF SEM Imaging and Acquisition
Samples were painted with Electrodag silver paint (avoiding the block face)
and then coated with 10 nm AuPd using a Q150T sputter coater (Quorum
Technologies). The sample was inserted into the Gatan 3View sample
holder and adjusted so the block face would be central in the microtome
and parallel with the knife-edge. After loading into the Gatan 3View micro-
tome, the sample height was raised manually until the block face was close
to the height of the knife. The final approach of the block face to the knife
was achieved by attaching the dissection microscope to the 3View door
and using the automatic approach on Digital Micrograph, at 200 nm thick
slices.
Imaging a single cell creates challenges because the resin surrounding the
cell is non-conductive. Without a conductive escape path for the electrons,
charging builds up, the resin softens, and this causes distortion of the block
face with each subsequent slice. To mitigate charge buildup and maximize
image quality, imaging conditions must be finely balanced. Cells were
imaged in low vacuum mode with a chamber pressure of 50 Pa. Low accel-
erating voltage (2.5 kV) was also used to reduce charging; however, this re-
sults in lower detector efficiency, which was compensated for with a slower
dwell time per pixel (60 ms). Ultimately, a suitable magnification (3,8753) was
determined by the predicted size of the cell at its widest point (�20 mm). To
obtain a typical resolution of 24 nm in x and y, a frame width of 1024 3 1024
was used. Section thickness was 60 nm over 200–600 sections, depending
on the cell type. 1 3 1C7, 2 3 DT40, and 5 3 RPE1-hTERT cells were
imaged.
3D Reconstruction, Modeling, and Segmentation
3View EM stacks were annotated using Amira (FEI). CLEM registration was
performed using primary (EM) and secondary (LM, deconvolved) overlays
with the multiplanar tool.
Chromosomes present in every orthoslice were annotated using masking
and thresholding alone (fully automated) or in combination with magic wand
and blow tools (semiautomated).
The modeled complement of chromosomes was segmented into discern-
able isolated objects using interactive thresholding and separate objectsmod-
ules. Objects were separated using 3D interpretation and a neighborhood
criteria of 26 connected elements, by at least one corner, edge, or face. The
marker contrast range (H-extrema) was set between 5 and 7, depending on
the sample. Label analysis modules were used to measure the geometry of
all isolated structures. Surface renders were generated using unconstrained
smoothing at levels 5–7.
To ascertain the positions of chromosomes within mitotic cells, we defined
the position of a chromosome as being the distance between the midpoint of
the chromosome (along its length) and the centroid of the cell, as stipulated
by the Amira software. We did not use the position of the centromere
because this could not be recognized for every chromosome in the
reconstructions.
SUPPLEMENTAL INFORMATION
Supplemental Information includes Supplemental Experimental Procedures,
five figures, one table, and three movies and can be found with this article
online at http://dx.doi.org/10.1016/j.molcel.2016.10.009.
AUTHOR CONTRIBUTIONS
Conceptualization, D.G.B. and W.C.E.; Methodology, D.G.B.; Investigation,
D.G.B., A.J.B., O.M., and I.S.; Formal Analysis, D.G.B. and W.C.E.; Writing –
Original Draft, D.G.B.; Writing – Review & Editing, D.G.B. and W.C.E.; Funding
Acquisition, I.A.P. andW.C.E.; Resources, D.G.B., H.M., N.K., V.L., and I.A.P.;
Supervision, D.G.B., I.A.P., and W.C.E.
ACKNOWLEDGMENTS
We thank LeonidMirny for helpful discussions and suggestions. This work was
supported by The Wellcome Trust, of which W.C.E. is a Principal Research
Fellow (grant number 073915). I.A.P. gratefully acknowledges support from
NWCR. The Wellcome Trust Centre for Cell Biology is supported by Wellcome
Trust core grants 077707 and 092076.
Received: April 4, 2016
Revised: August 24, 2016
Accepted: October 5, 2016
Published: November 10, 2016
REFERENCES
Adolphs, K.W., Cheng, S.M., Paulson, J.R., and Laemmli, U.K. (1977). Isolation
of a protein scaffold from mitotic HeLa cell chromosomes. Proc. Natl. Acad.
Sci. USA 74, 4937–4941.
Amendola, M., and van Steensel, B. (2014). Mechanisms and dynamics of nu-
clear lamina-genome interactions. Curr. Opin. Cell Biol. 28, 61–68.
Bajer, A. (1959). Change of length and volume ofmitotic chromosomes in living
cells. Hereditas 45, 579–596.
Belmont, A.S. (2002). Mitotic chromosome scaffold structure: new ap-
proaches to an old controversy. Proc. Natl. Acad. Sci. USA 99, 15855–15857.
Belmont, A.S. (2006). Mitotic chromosome structure and condensation. Curr.
Opin. Cell Biol. 18, 632–638.
Belmont, A.S., Sedat, J.W., and Agard, D.A. (1987). A three-dimensional
approach to mitotic chromosome structure: evidence for a complex hierarchi-
cal organization. J. Cell Biol. 105, 77–92.
Bergmann, J.H., Rodrıguez, M.G., Martins, N.M., Kimura, H., Kelly, D.A.,
Masumoto, H., Larionov, V., Jansen, L.E., and Earnshaw, W.C. (2011).
Epigenetic engineering shows H3K4me2 is required for HJURP targeting
and CENP-A assembly on a synthetic human kinetochore. EMBO J. 30,
328–340.
Berry, J., Weber, S.C., Vaidya, N., Haataja, M., and Brangwynne, C.P. (2015).
RNA transcription modulates phase transition-driven nuclear body assembly.
Proc. Natl. Acad. Sci. USA 112, E5237–E5245.
Booth, D.G., Hood, F.E., Prior, I.A., and Royle, S.J. (2011). A TACC3/ch-TOG/
clathrin complex stabilises kinetochore fibres by inter-microtubule bridging.
EMBO J. 30, 906–919.
Booth, D.G., Cheeseman, L.P., Prior, I.A., and Royle, S.J. (2013). Studying
kinetochore-fiber ultrastructure using correlative light-electron microscopy.
Methods Cell Biol. 115, 327–342.
Booth, D.G., Takagi, M., Sanchez-Pulido, L., Petfalski, E., Vargiu, G.,
Samejima, K., Imamoto, N., Ponting, C.P., Tollervey, D., Earnshaw, W.C.,
and Vagnarelli, P. (2014). Ki-67 is a PP1-interacting protein that organises
the mitotic chromosome periphery. eLife 3, e01641.
Boy de la Tour, E., and Laemmli, U.K. (1988). The metaphase scaffold is heli-
cally folded: sister chromatids have predominantly opposite helical handed-
ness. Cell 55, 937–944.
Molecular Cell 64, 1–13, November 17, 2016 11
Please cite this article in press as: Booth et al., 3D-CLEM Reveals that a Major Portion of Mitotic Chromosomes Is Not Chromatin, Molecular Cell(2016), http://dx.doi.org/10.1016/j.molcel.2016.10.009
Brangwynne, C.P., Mitchison, T.J., and Hyman, A.A. (2011). Active liquid-like
behavior of nucleoli determines their size and shape in Xenopus laevis oo-
cytes. Proc. Natl. Acad. Sci. USA 108, 4334–4339.
Cardinale, S., Bergmann, J.H., Kelly, D., Nakano, M., Valdivia, M.M., Kimura,
H., Masumoto, H., Larionov, V., and Earnshaw, W.C. (2009). Hierarchical inac-
tivation of a synthetic human kinetochore by a chromatin modifier. Mol. Biol.
Cell 20, 4194–4204.
Chaly, N., Bladon, T., Setterfield, G., Little, J.E., Kaplan, J.G., and Brown, D.L.
(1984). Changes in distribution of nuclearmatrix antigens during themitotic cell
cycle. J. Cell Biol. 99, 661–671.
Choo, K.H., Vissel, B., Nagy, A., Earle, E., and Kalitsis, P. (1991). A survey of the
genomic distribution of alpha satellite DNA on all the human chromosomes,
and derivation of a new consensus sequence. Nucleic Acids Res. 19, 1179–
1182.
Cook, P.R., and Brazell, I.A. (1978). Spectrofluorometric measurement of the
binding of ethidium to superhelical DNA from cell nuclei. Eur. J. Biochem.
84, 465–477.
Cuylen, S., Blaukopf, C., Politi, A.Z., M€uller-Reichert, T., Neumann, B.,
Poser, I., Ellenberg, J., Hyman, A.A., and Gerlich, D.W. (2016). Ki-67 acts
as a biological surfactant to disperse mitotic chromosomes. Nature 535,
308–312.
Dekker, J., Marti-Renom, M.A., and Mirny, L.A. (2013). Exploring the three-
dimensional organization of genomes: interpreting chromatin interaction
data. Nat. Rev. Genet. 14, 390–403.
DuPraw, E.J. (1966). Evidence for a ‘folded-fibre’ organization in human chro-
mosomes. Nature 209, 577–581.
Earnshaw, W.C., and Laemmli, U.K. (1983). Architecture of metaphase chro-
mosomes and chromosome scaffolds. J. Cell Biol. 96, 84–93.
Eltsov, M., Maclellan, K.M., Maeshima, K., Frangakis, A.S., and Dubochet, J.
(2008). Analysis of cryo-electron microscopy images does not support the ex-
istence of 30-nm chromatin fibers in mitotic chromosomes in situ. Proc. Natl.
Acad. Sci. USA 105, 19732–19737.
Finch, J.T., and Klug, A. (1976). Solenoidal model for superstructure in chro-
matin. Proc. Natl. Acad. Sci. USA 73, 1897–1901.
Flemming, W. (1882). Zellsubstanz, kern und zelltheilung (F.C.W. Vogel).
Gautier, T., Masson, C., Quintana, C., Arnoult, J., and Hernandez-Verdun, D.
(1992a). The ultrastructure of the chromosome periphery in human cell lines.
An in situ study using cryomethods in electron microscopy. Chromosoma
101, 502–510.
Gautier, T., Robert-Nicoud, M., Guilly, M.N., and Hernandez-Verdun, D.
(1992b). Relocation of nucleolar proteins around chromosomes at mitosis.
A study by confocal laser scanning microscopy. J. Cell Sci. 102, 729–737.
Hernandez-Verdun, D., and Gautier, T. (1994). The chromosome periphery
during mitosis. BioEssays 16, 179–185.
Kireeva, N., Lakonishok, M., Kireev, I., Hirano, T., and Belmont, A.S. (2004).
Visualization of early chromosome condensation: a hierarchical folding, axial
glue model of chromosome structure. J. Cell Biol. 166, 775–785.
Kizilyaprak, C., Daraspe, J., and Humbel, B.M. (2014). Focused ion beam
scanning electron microscopy in biology. J. Microsc. 254, 109–114.
Kouprina, N., Samoshkin, A., Erliandri, I., Nakano,M., Lee, H.S., Fu, H., Iida, Y.,
Aladjem, M., Oshimura, M., Masumoto, H., et al. (2012). Organization of syn-
thetic alphoid DNA array in human artificial chromosome (HAC) with a condi-
tional centromere. ACS Synth. Biol. 1, 590–601.
Kouprina, N., Tomilin, A.N., Masumoto, H., Earnshaw, W.C., and Larionov, V.
(2014). Human artificial chromosome-based gene delivery vectors for biomed-
icine and biotechnology. Expert Opin. Drug Deliv. 11, 517–535.
Kschonsak,M., and Haering, C.H. (2015). Shapingmitotic chromosomes: from
classical concepts to molecular mechanisms. BioEssays 37, 755–766.
Kuwada, Y. (1939). Chromosome structure. A critical review. Cytologia (Tokyo)
10, 213–256.
12 Molecular Cell 64, 1–13, November 17, 2016
Liang, Z., Zickler, D., Prentiss, M., Chang, F.S., Witz, G., Maeshima, K., and
Kleckner, N. (2015). Chromosomes progress tometaphase inmultiple discrete
steps via global compaction/expansion cycles. Cell 161, 1124–1137.
Luger, K., M€ader, A.W., Richmond, R.K., Sargent, D.F., and Richmond, T.J.
(1997). Crystal structure of the nucleosome core particle at 2.8 A resolution.
Nature 389, 251–260.
Marko, J.F. (2008). Micromechanical studies of mitotic chromosomes.
Chromosome Res. 16, 469–497.
Marsden, M.P., and Laemmli, U.K. (1979). Metaphase chromosome structure:
evidence for a radial loop model. Cell 17, 849–858.
McIntosh, J.R., and Landis, S.C. (1971). The distribution of spindle microtu-
bules during mitosis in cultured human cells. J. Cell Biol. 49, 468–497.
McKeon, F.D., Tuffanelli, D.L., Kobayashi, S., and Kirschner, M.W. (1984). The
redistribution of a conserved nuclear envelope protein during the cell cycle
suggests a pathway for chromosome condensation. Cell 36, 83–92.
Molina, O., Blanco, J., Anton, E., Vidal, F., and Volpi, E.V. (2012). High-resolu-
tion fish on DNA fibers for low-copy repeats genome architecture studies.
Genomics 100, 380–386.
Mosgoller, W., Leitch, A.R., Brown, J.K., and Heslop-Harrison, J.S. (1991).
Chromosome arrangements in human fibroblasts at mitosis. Hum. Genet.
88, 27–33.
Nagasaka, K., Hossain, M.J., Roberti, M.J., Ellenberg, J., and Hirota, T. (2016).
Sister chromatid resolution is an intrinsic part of chromosome organization in
prophase. Nat. Cell Biol. 18, 692–699.
Nakano, M., Cardinale, S., Noskov, V.N., Gassmann, R., Vagnarelli, P.,
Kandels-Lewis, S., Larionov, V., Earnshaw, W.C., and Masumoto, H. (2008).
Inactivation of a human kinetochore by specific targeting of chromatin modi-
fiers. Dev. Cell 14, 507–522.
Naumova, N., Imakaev, M., Fudenberg, G., Zhan, Y., Lajoie, B.R., Mirny, L.A.,
and Dekker, J. (2013). Organization of the mitotic chromosome. Science 342,
948–953.
Nishino, Y., Eltsov, M., Joti, Y., Ito, K., Takata, H., Takahashi, Y., Hihara, S.,
Frangakis, A.S., Imamoto, N., Ishikawa, T., and Maeshima, K. (2012). Human
mitotic chromosomes consist predominantly of irregularly folded nucleosome
fibres without a 30-nm chromatin structure. EMBO J. 31, 1644–1653.
Ohnuki, Y. (1968). Structure of chromosomes. I. Morphological studies of the
spiral structure of human somatic chromosomes. Chromosoma 25, 402–428.
Ohta, S., Bukowski-Wills, J.C., Sanchez-Pulido, L., Alves, Fde.L., Wood, L.,
Chen, Z.A., Platani, M., Fischer, L., Hudson, D.F., Ponting, C.P., et al. (2010).
The protein composition of mitotic chromosomes determined using multiclas-
sifier combinatorial proteomics. Cell 142, 810–821.
Paulson, J.R., and Laemmli, U.K. (1977). The structure of histone-depleted
metaphase chromosomes. Cell 12, 817–828.
Pienta, K.J., and Coffey, D.S. (1984). A structural analysis of the role of the nu-
clear matrix and DNA loops in the organization of the nucleus and chromo-
some. J. Cell Sci. Suppl. 1, 123–135.
Rattner, J.B., and Lin, C.C. (1985). Radial loops and helical coils coexist in
metaphase chromosomes. Cell 42, 291–296.
Robbins, E., and Gonatas, N.K. (1964). The ultrastructure of a mammalian cell
during the mitotic cycle. J. Cell Biol. 21, 429–463.
Samejima, I., Spanos, C., Alves, Fde.L., Hori, T., Perpelescu, M., Zou, J.,
Rappsilber, J., Fukagawa, T., and Earnshaw, W.C. (2015). Whole-proteome
genetic analysis of dependencies in assembly of a vertebrate kinetochore.
J. Cell Biol. 211, 1141–1156.
Scholzen, T., Endl, E., Wohlenberg, C., van der Sar, S., Cowell, I.G., Gerdes, J.,
and Singh, P.B. (2002). The Ki-67 protein interacts withmembers of the hetero-
chromatin protein 1 (HP1) family: a potential role in the regulation of higher-or-
der chromatin structure. J. Pathol. 196, 135–144.
Sedat, J., and Manuelidis, L. (1978). A direct approach to the structure of eu-
karyotic chromosomes. Cold Spring Harb. Symp. Quant. Biol. 42, 331–350.
Strukov, Y.G., Wang, Y., and Belmont, A.S. (2003). Engineered chromo-
some regions with altered sequence composition demonstrate hierarchical

Please cite this article in press as: Booth et al., 3D-CLEM Reveals that a Major Portion of Mitotic Chromosomes Is Not Chromatin, Molecular Cell(2016), http://dx.doi.org/10.1016/j.molcel.2016.10.009
large-scale folding within metaphase chromosomes. J. Cell Biol. 162,
23–35.
Swedlow, J.R., and Hirano, T. (2003). The making of the mitotic chromosome:
modern insights into classical questions. Mol. Cell 11, 557–569.
Van Hooser, A.A., Yuh, P., and Heald, R. (2005). The perichromosomal layer.
Chromosoma 114, 377–388.
West, J.B., Fu, Z., Deerinck, T.J., Mackey, M.R., Obayashi, J.T., and
Ellisman, M.H. (2010). Structure-function studies of blood and air capillaries
in chicken lung using 3D electron microscopy. Respir. Physiol. Neurobiol.
170, 202–209.
Whitfield, M.L., George, L.K., Grant, G.D., and Perou, C.M. (2006). Common
markers of proliferation. Nat. Rev. Cancer 6, 99–106.
Molecular Cell 64, 1–13, November 17, 2016 13