Embed Size (px)
Citation preview
Audited FY 2011 IFRS ResultsAudited FY 2011 IFRS ResultsAudited FY 2011 IFRS ResultsAudited FY 2011 IFRS Results
DisclaimerDisclaimer
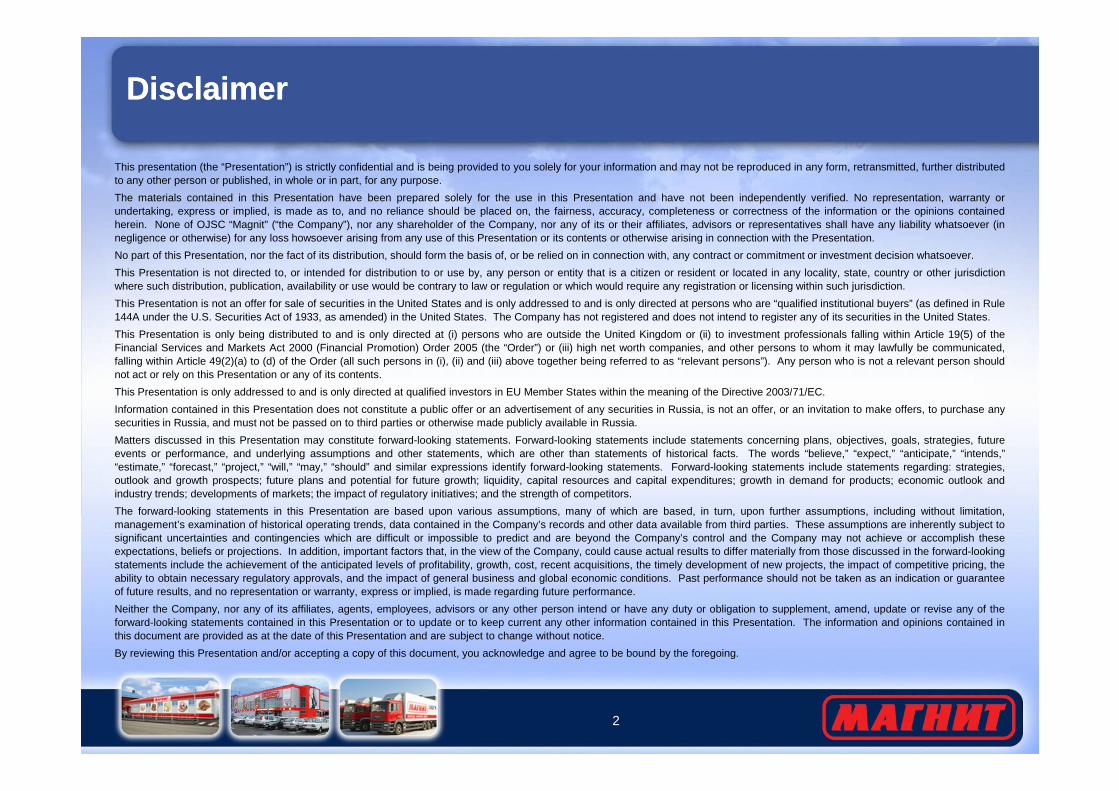
This presentation (the “Presentation”) is strictly confidential and is being provided to you solely for your information and may not be reproduced in any form, retransmitted, further distributedto any other person or published, in whole or in part, for any purpose.
The materials contained in this Presentation have been prepared solely for the use in this Presentation and have not been independently verified. No representation, warranty orundertaking, express or implied, is made as to, and no reliance should be placed on, the fairness, accuracy, completeness or correctness of the information or the opinions containedherein. None of OJSC “Magnit” (“the Company”), nor any shareholder of the Company, nor any of its or their affiliates, advisors or representatives shall have any liability whatsoever (innegligence or otherwise) for any loss howsoever arising from any use of this Presentation or its contents or otherwise arising in connection with the Presentation.
No part of this Presentation, nor the fact of its distribution, should form the basis of, or be relied on in connection with, any contract or commitment or investment decision whatsoever.
This Presentation is not directed to, or intended for distribution to or use by, any person or entity that is a citizen or resident or located in any locality, state, country or other jurisdictionwhere such distribution, publication, availability or use would be contrary to law or regulation or which would require any registration or licensing within such jurisdiction.
This Presentation is not an offer for sale of securities in the United States and is only addressed to and is only directed at persons who are “qualified institutional buyers” (as defined in Rule144A under the U.S. Securities Act of 1933, as amended) in the United States. The Company has not registered and does not intend to register any of its securities in the United States.
This Presentation is only being distributed to and is only directed at (i) persons who are outside the United Kingdom or (ii) to investment professionals falling within Article 19(5) of theFinancial Services and Markets Act 2000 (Financial Promotion) Order 2005 (the “Order”) or (iii) high net worth companies, and other persons to whom it may lawfully be communicated,falling within Article 49(2)(a) to (d) of the Order (all such persons in (i), (ii) and (iii) above together being referred to as “relevant persons”). Any person who is not a relevant person shouldnot act or rely on this Presentation or any of its contents.
This Presentation is only addressed to and is only directed at qualified investors in EU Member States within the meaning of the Directive 2003/71/EC.
2
This Presentation is only addressed to and is only directed at qualified investors in EU Member States within the meaning of the Directive 2003/71/EC.
Information contained in this Presentation does not constitute a public offer or an advertisement of any securities in Russia, is not an offer, or an invitation to make offers, to purchase anysecurities in Russia, and must not be passed on to third parties or otherwise made publicly available in Russia.
Matters discussed in this Presentation may constitute forward-looking statements. Forward-looking statements include statements concerning plans, objectives, goals, strategies, futureevents or performance, and underlying assumptions and other statements, which are other than statements of historical facts. The words “believe,” “expect,” “anticipate,” “intends,”“estimate,” “forecast,” “project,” “will,” “may,” “should” and similar expressions identify forward-looking statements. Forward-looking statements include statements regarding: strategies,outlook and growth prospects; future plans and potential for future growth; liquidity, capital resources and capital expenditures; growth in demand for products; economic outlook andindustry trends; developments of markets; the impact of regulatory initiatives; and the strength of competitors.
The forward-looking statements in this Presentation are based upon various assumptions, many of which are based, in turn, upon further assumptions, including without limitation,management’s examination of historical operating trends, data contained in the Company’s records and other data available from third parties. These assumptions are inherently subject tosignificant uncertainties and contingencies which are difficult or impossible to predict and are beyond the Company’s control and the Company may not achieve or accomplish theseexpectations, beliefs or projections. In addition, important factors that, in the view of the Company, could cause actual results to differ materially from those discussed in the forward-lookingstatements include the achievement of the anticipated levels of profitability, growth, cost, recent acquisitions, the timely development of new projects, the impact of competitive pricing, theability to obtain necessary regulatory approvals, and the impact of general business and global economic conditions. Past performance should not be taken as an indication or guaranteeof future results, and no representation or warranty, express or implied, is made regarding future performance.
Neither the Company, nor any of its affiliates, agents, employees, advisors or any other person intend or have any duty or obligation to supplement, amend, update or revise any of theforward-looking statements contained in this Presentation or to update or to keep current any other information contained in this Presentation. The information and opinions contained inthis document are provided as at the date of this Presentation and are subject to change without notice.
By reviewing this Presentation and/or accepting a copy of this document, you acknowledge and agree to be bound by the foregoing.
Table of ContentsTable of Contents
1.1. MagnitMagnit at a Glanceat a Glance
3.3. Operational Overview by FormatOperational Overview by Format-- Convenience StoreConvenience Store-- HypermarketHypermarket
2.2. StrategyStrategy
3
4.4. Financial OverviewFinancial Overview
6.6. Summary ConclusionsSummary Conclusions
5.5. General Business OverviewGeneral Business Overview
AppendixAppendix

1. Magnit at a Glance1. Magnit at a Glance
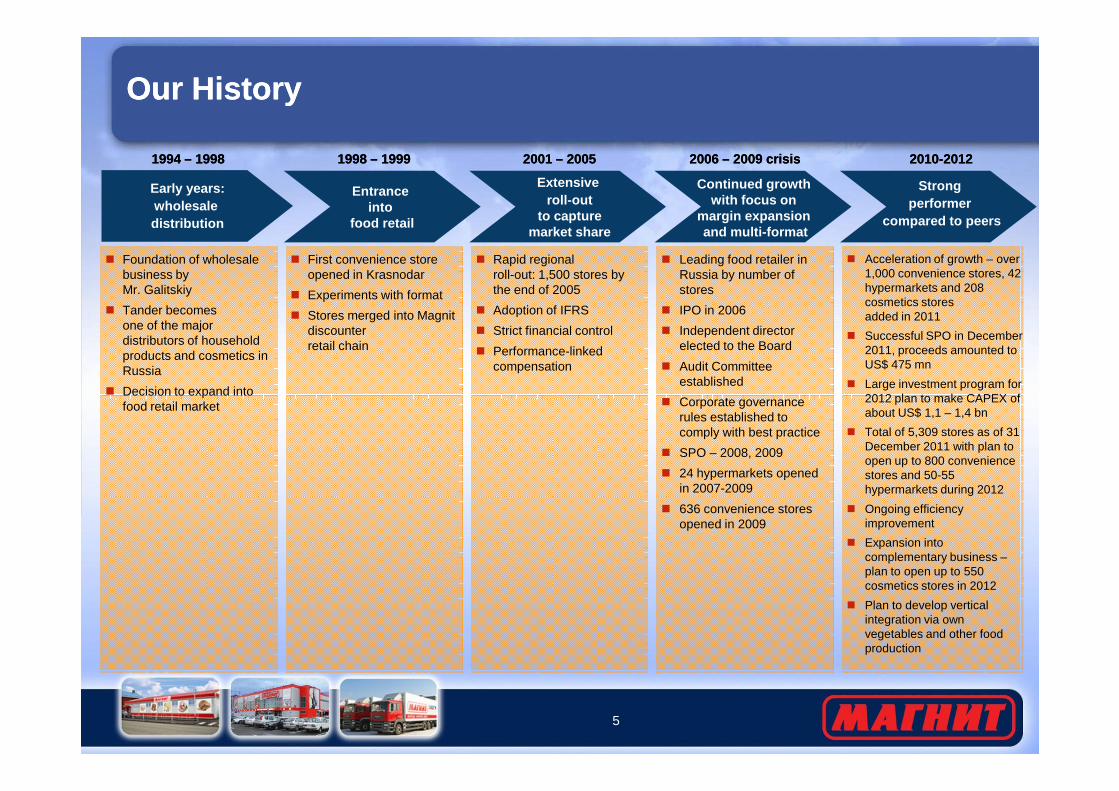
Our HistoryOur History
� Foundation of wholesale business by Mr. Galitskiy
� Tander becomesone of the major distributors of household products and cosmetics in Russia
� Decision to expand into
1994 1994 –– 19981998
Early years:wholesale distribution
� First convenience store opened in Krasnodar
� Experiments with format
� Stores merged into Magnitdiscounter retail chain
1998 1998 –– 19991999
Entrance into
food retail
� Rapid regionalroll-out: 1,500 stores by the end of 2005
� Adoption of IFRS
� Strict financial control
� Performance-linked compensation
2001 2001 –– 20052005
Extensive roll-out
to capturemarket share
� Leading food retailer inRussia by number ofstores
� IPO in 2006
� Independent director elected to the Board
� Audit Committee established
� Corporate governance
2006 2006 –– 2009 crisis2009 crisis
Continued growth with focus on
margin expansion and multi-format
� Acceleration of growth – over 1,000 convenience stores, 42 hypermarkets and 208 cosmetics storesadded in 2011
� Successful SPO in December 2011, proceeds amounted to US$ 475 mn
� Large investment program for 2012 plan to make CAPEX of
20102010--20120122
Strong performer
compared to peers
5
� Decision to expand into food retail market � Corporate governance
rules established to comply with best practice
� SPO – 2008, 2009
� 24 hypermarkets openedin 2007-2009
� 636 convenience stores opened in 2009
2012 plan to make CAPEX of about US$ 1,1 – 1,4 bn
� Total of 5,309 stores as of 31 December 2011 with plan to open up to 800 convenience stores and 50-55 hypermarkets during 2012
� Ongoing efficiency improvement
� Expansion into complementary business –plan to open up to 550 cosmetics stores in 2012
� Plan to develop vertical integration via own vegetables and other food production
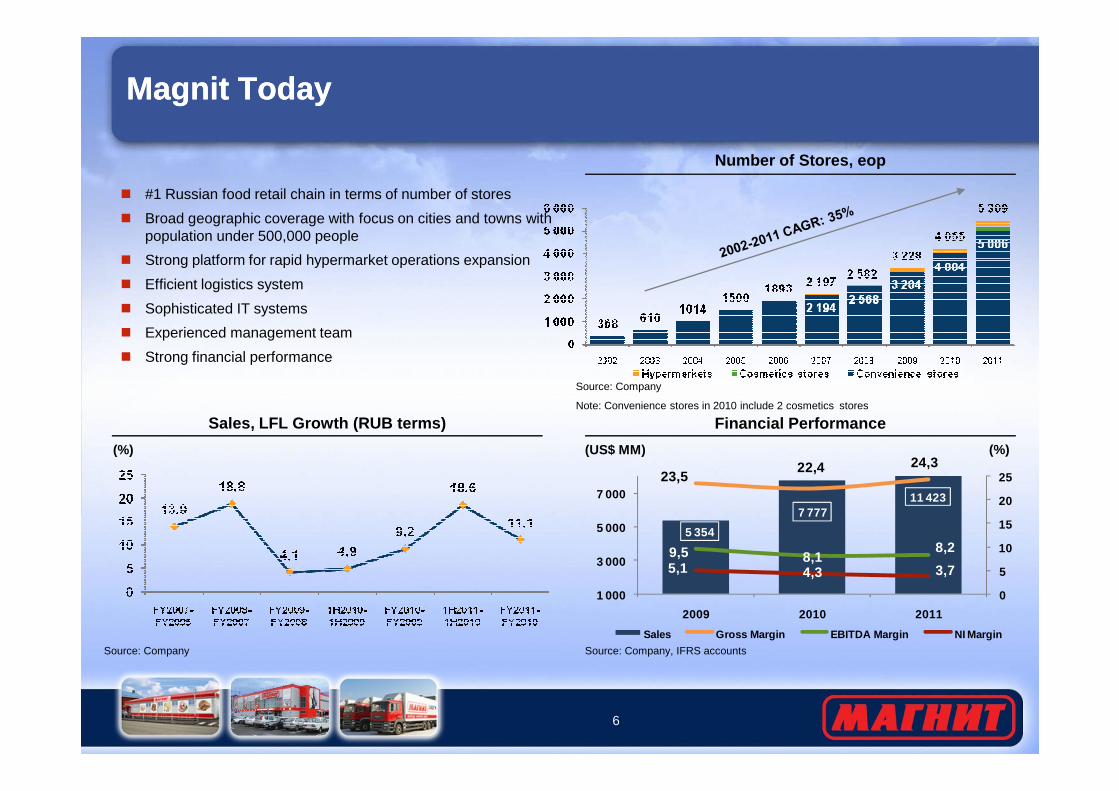
Magnit TodayMagnit Today
� #1 Russian food retail chain in terms of number of stores
� Broad geographic coverage with focus on cities and towns with population under 500,000 people
� Strong platform for rapid hypermarket operations expansion
� Efficient logistics system
� Sophisticated IT systems
� Experienced management team
� Strong financial performance
Number of Stores, eop
Source: Company
6
Financial Performance
5 354
7 77711 423
23,522,4 24,3
9,5 8,18,2
5,1 4,3 3,7
0
5
10
15
20
25
1 000
3 000
5 000
7 000
2009 2010 2011
Sales Gross Margin EBITDA Margin NI Margin
(US$ MM) (%)
Source: Company Source: Company, IFRS accounts
Note: Convenience stores in 2010 include 2 cosmetics stores
Sales, LFL Growth (RUB terms)
(%)

2. Strategy2. Strategy
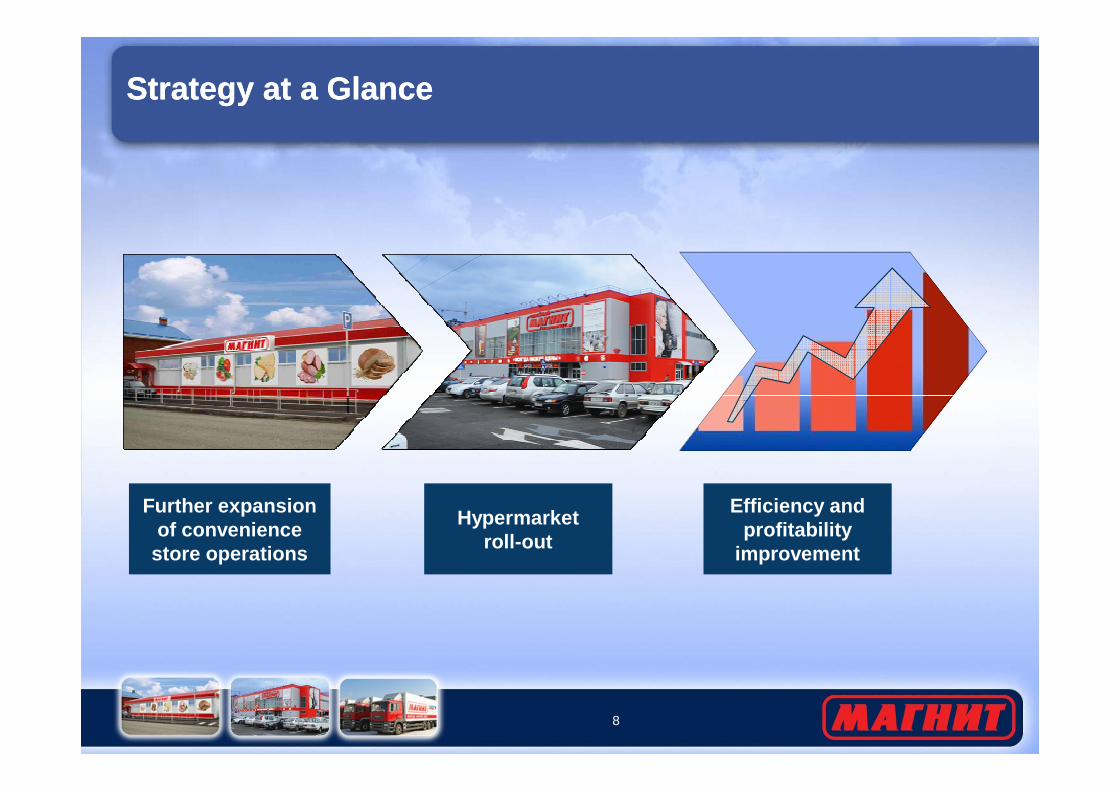
Strategy at a GlanceStrategy at a Glance
8
Further expansionof convenience
store operations
Hypermarketroll-out
Efficiency and profitability
improvement
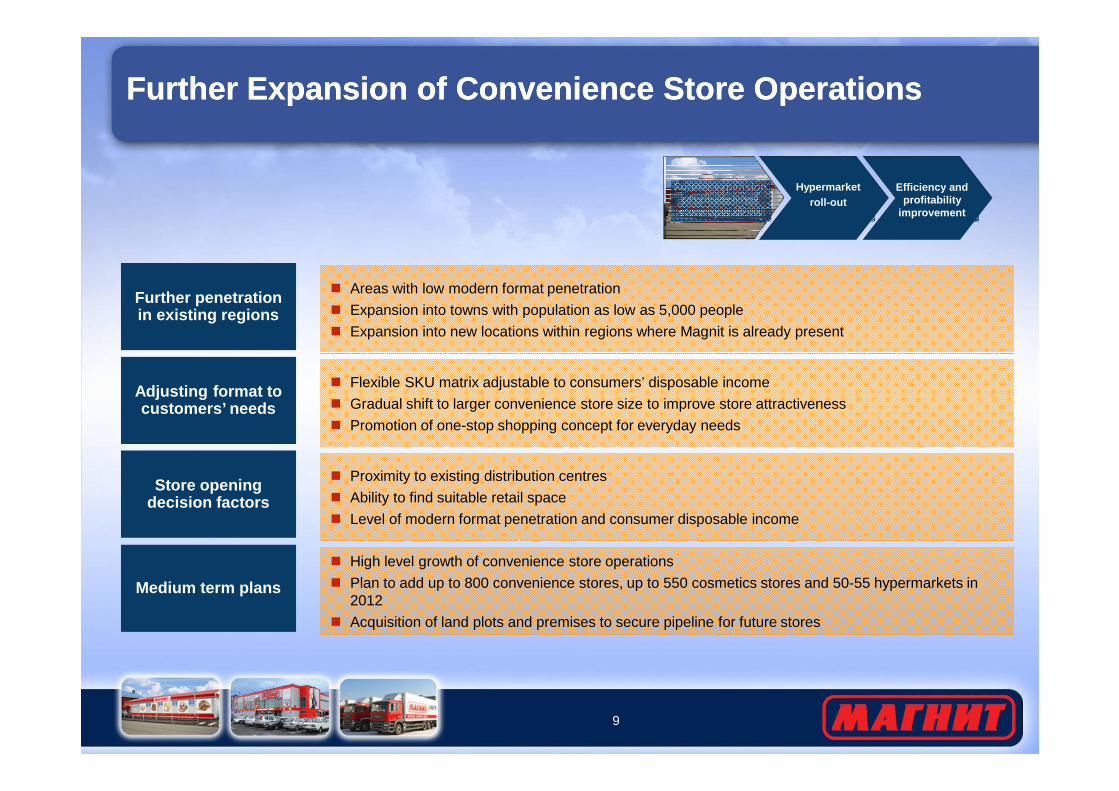
Further Expansion of Convenience Store OperationsFurther Expansion of Convenience Store Operations
Further penetration in existing regions
� Areas with low modern format penetration
� Expansion into towns with population as low as 5,000 people
� Expansion into new locations within regions where Magnit is already present
Adjusting format to � Flexible SKU matrix adjustable to consumers’ disposable income
Gradual shift to larger convenience store size to improve store attractiveness
Hypermarketroll-out
Efficiency and profitability
improvement
Further expansion of convenience
store operations
9
Medium term plans
� High level growth of convenience store operations
� Plan to add up to 800 convenience stores, up to 550 cosmetics stores and 50-55 hypermarkets in 2012
� Acquisition of land plots and premises to secure pipeline for future stores
Store opening decision factors
� Proximity to existing distribution centres
� Ability to find suitable retail space
� Level of modern format penetration and consumer disposable income
Adjusting format to customers’ needs � Gradual shift to larger convenience store size to improve store attractiveness
� Promotion of one-stop shopping concept for everyday needs
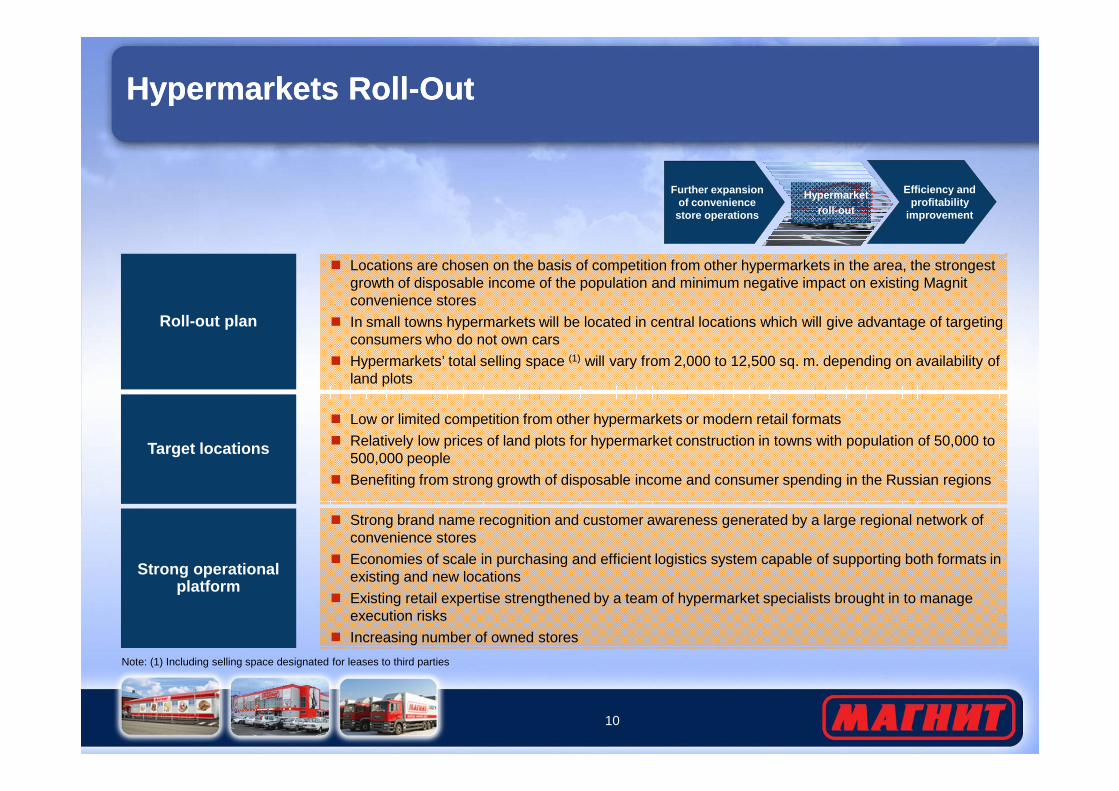
Hypermarkets Roll-OutHypermarkets Roll-Out
Roll-out plan
� Locations are chosen on the basis of competition from other hypermarkets in the area, the strongest growth of disposable income of the population and minimum negative impact on existing Magnit convenience stores
� In small towns hypermarkets will be located in central locations which will give advantage of targeting consumers who do not own cars
� Hypermarkets’ total selling space (1) will vary from 2,000 to 12,500 sq. m. depending on availability of land plots
Further expansion of convenience
store operations
Efficiency and profitability
improvement
Hypermarketroll-out
10
Strong operational platform
� Strong brand name recognition and customer awareness generated by a large regional network of convenience stores
� Economies of scale in purchasing and efficient logistics system capable of supporting both formats in existing and new locations
� Existing retail expertise strengthened by a team of hypermarket specialists brought in to manage execution risks
� Increasing number of owned stores
Target locations
� Low or limited competition from other hypermarkets or modern retail formats
� Relatively low prices of land plots for hypermarket construction in towns with population of 50,000 to 500,000 people
� Benefiting from strong growth of disposable income and consumer spending in the Russian regions
Note: (1) Including selling space designated for leases to third parties
� Further growth of the share of high margin products, including fresh food products, ready-made meals and private label
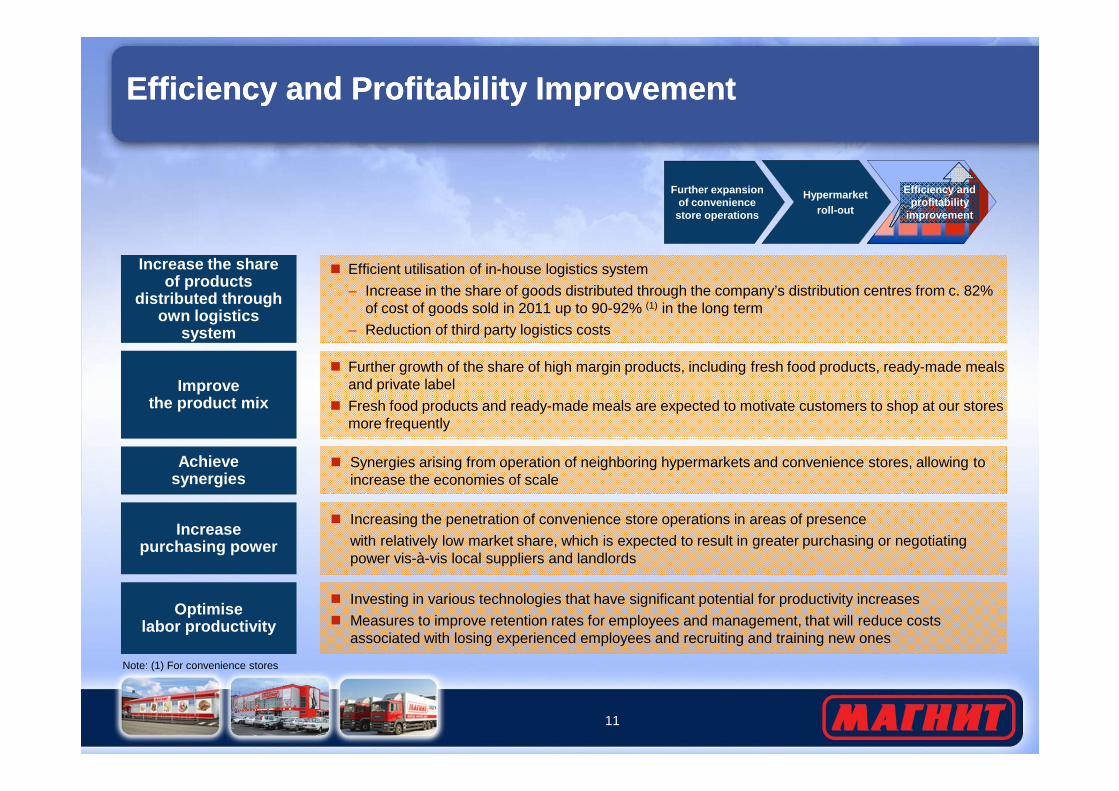
Efficiency and Profitability ImprovementEfficiency and Profitability Improvement
Increase the share of products
distributed through own logistics
system
� Efficient utilisation of in-house logistics system
– Increase in the share of goods distributed through the company’s distribution centres from c. 82% of cost of goods sold in 2011 up to 90-92% (1) in the long term
– Reduction of third party logistics costs
Improve the product mix
Further expansion of convenience
store operations
Hypermarketroll-out
Efficiency and profitability
improvement
11
� Fresh food products and ready-made meals are expected to motivate customers to shop at our stores more frequently
Achievesynergies
� Synergies arising from operation of neighboring hypermarkets and convenience stores, allowing to increase the economies of scale
the product mix
Increasepurchasing power
� Increasing the penetration of convenience store operations in areas of presence
with relatively low market share, which is expected to result in greater purchasing or negotiating power vis-à-vis local suppliers and landlords
Optimiselabor productivity
� Investing in various technologies that have significant potential for productivity increases
� Measures to improve retention rates for employees and management, that will reduce costs associated with losing experienced employees and recruiting and training new ones
Note: (1) For convenience stores
3. Operational Overview by Format3. Operational Overview by Format
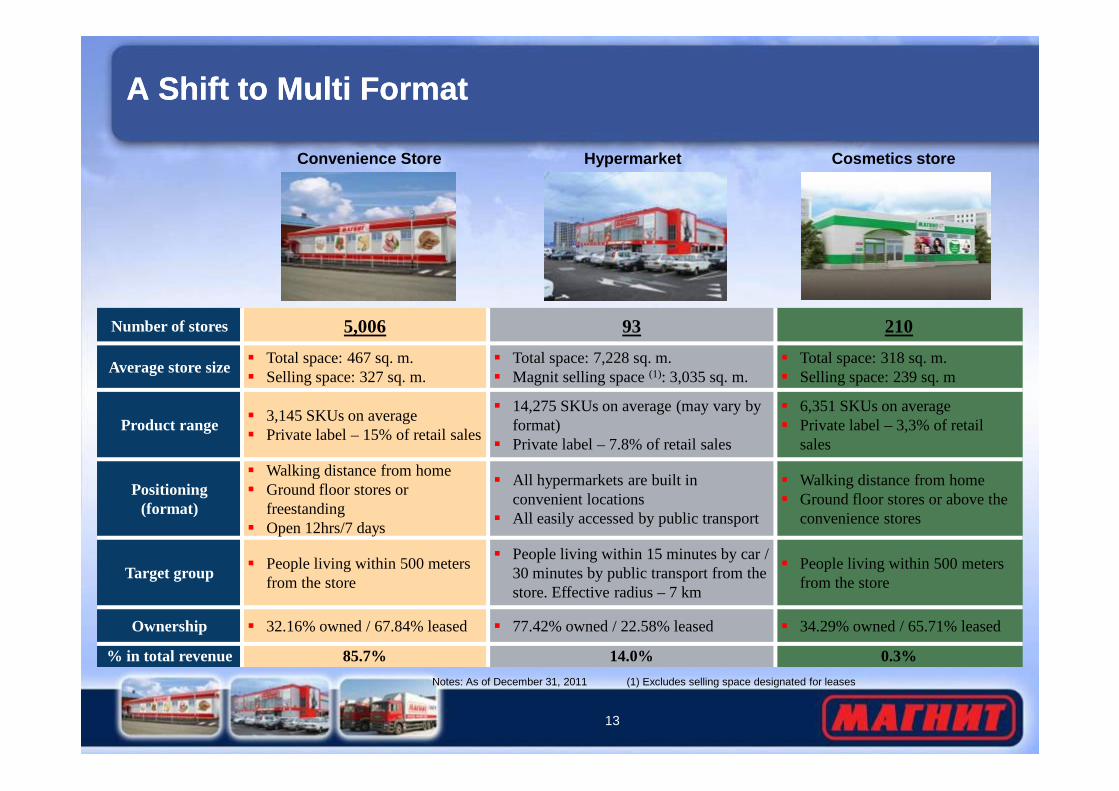
A Shift to Multi FormatA Shift to Multi Format
Number of stores 5,006 93 210
Average store size� Total space: 467 sq. m.� Selling space: 327 sq. m.
� Total space: 7,228 sq. m.� Magnit selling space (1): 3,035 sq. m.
� Total space: 318 sq. m.� Selling space: 239 sq. m
Convenience Store Hypermarket Cosmetics store
13
Product range� 3,145 SKUs on average� Private label – 15% of retail sales
� 14,275 SKUs on average (may vary by format)
� Private label – 7.8% of retail sales
� 6,351 SKUs on average� Private label – 3,3% of retail
sales
Positioning (format)
� Walking distance from home� Ground floor stores or
freestanding� Open 12hrs/7 days
� All hypermarkets are built in convenient locations
� All easily accessed by public transport
� Walking distance from home� Ground floor stores or above the
convenience stores
Target group� People living within 500 meters
from the store
� People living within 15 minutes by car / 30 minutes by public transport from the store. Effective radius – 7 km
� People living within 500 meters from the store
Ownership � 32.16% owned / 67.84% leased � 77.42% owned / 22.58% leased � 34.29% owned / 65.71% leased
% in total revenue 85.7% 14.0% 0.3%
Notes: As of December 31, 2011 (1) Excludes selling space designated for leases
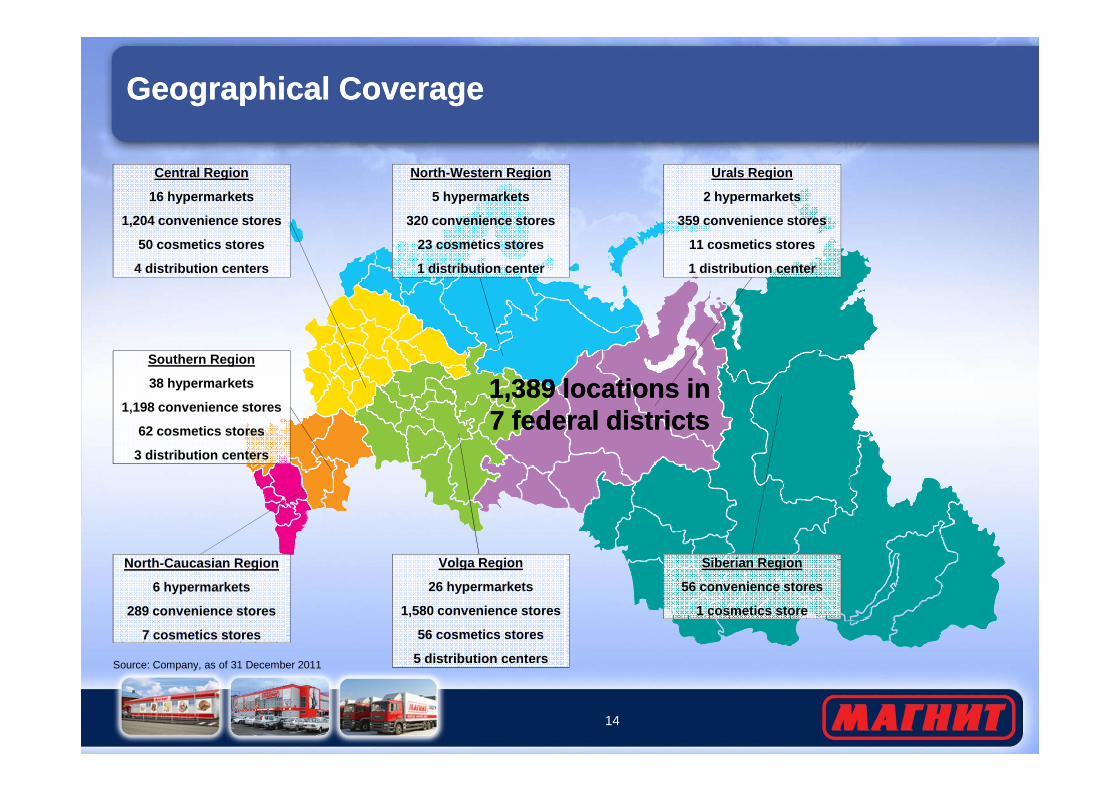
Geographical CoverageGeographical Coverage
1,389 locations in 1,389 locations in
Urals Region
2 hypermarkets
359 convenience stores
11 cosmetics stores
1 distribution center
North-Western Region
5 hypermarkets
320 convenience stores
23 cosmetics stores
1 distribution center
Central Region
16 hypermarkets
1,204 convenience stores
50 cosmetics stores
4 distribution centers
Southern Region
38 hypermarkets
14
1,389 locations in 1,389 locations in 7 federal districts7 federal districts
Source: Company, as of 31 December 2011
Siberian Region
56 convenience stores
1 cosmetics store
North-Caucasian Region
6 hypermarkets
289 convenience stores
7 cosmetics stores
Volga Region
26 hypermarkets
1,580 convenience stores
56 cosmetics stores
5 distribution centers
1,198 convenience stores
62 cosmetics stores
3 distribution centers

Convenience StoreConvenience Store
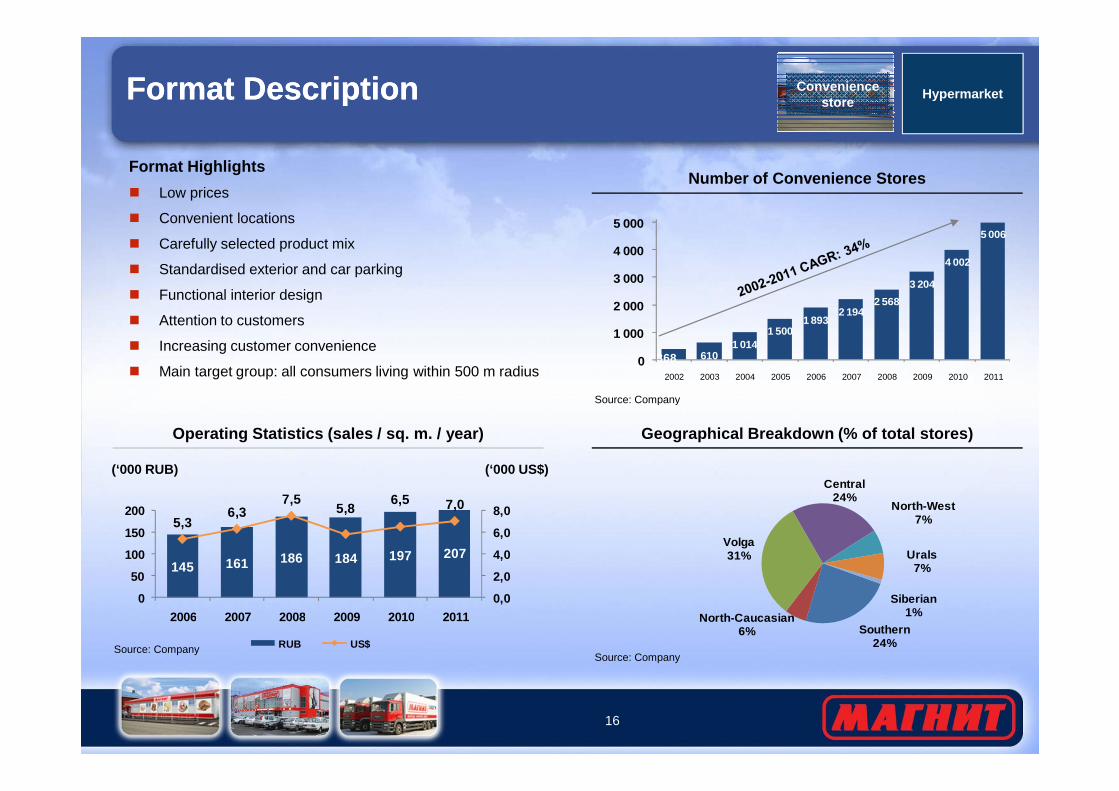
Format DescriptionFormat Description
Format Highlights
� Low prices
� Convenient locations
� Carefully selected product mix
� Standardised exterior and car parking
� Functional interior design
� Attention to customers
� Increasing customer convenience
� Main target group: all consumers living within 500 m radius
Number of Convenience Stores
368 6101 014
1 5001 893
2 1942 568
3 204
4 002
5 006
0
1 000
2 000
3 000
4 000
5 000
2002 2003 2004 2005 2006 2007 2008 2009 2010 2011
Source: Company
HypermarketConvenience store
16
145 161 186 184 197 207
5,36,3
7,55,8
6,5 7,0
0,0
2,0
4,0
6,0
8,0
0
50
100
150
200
2006 2007 2008 2009 2010 2011
RUB US$
Geographical Breakdown (% of total stores)Operating Statistics (sales / sq. m. / year)
Source: Company
Source: Company
Source: Company
(‘000 RUB) (‘000 US$)
Southern24%
North-Caucasian6%
Volga31%
Central24%
North-West7%
Urals7%
Siberian1%
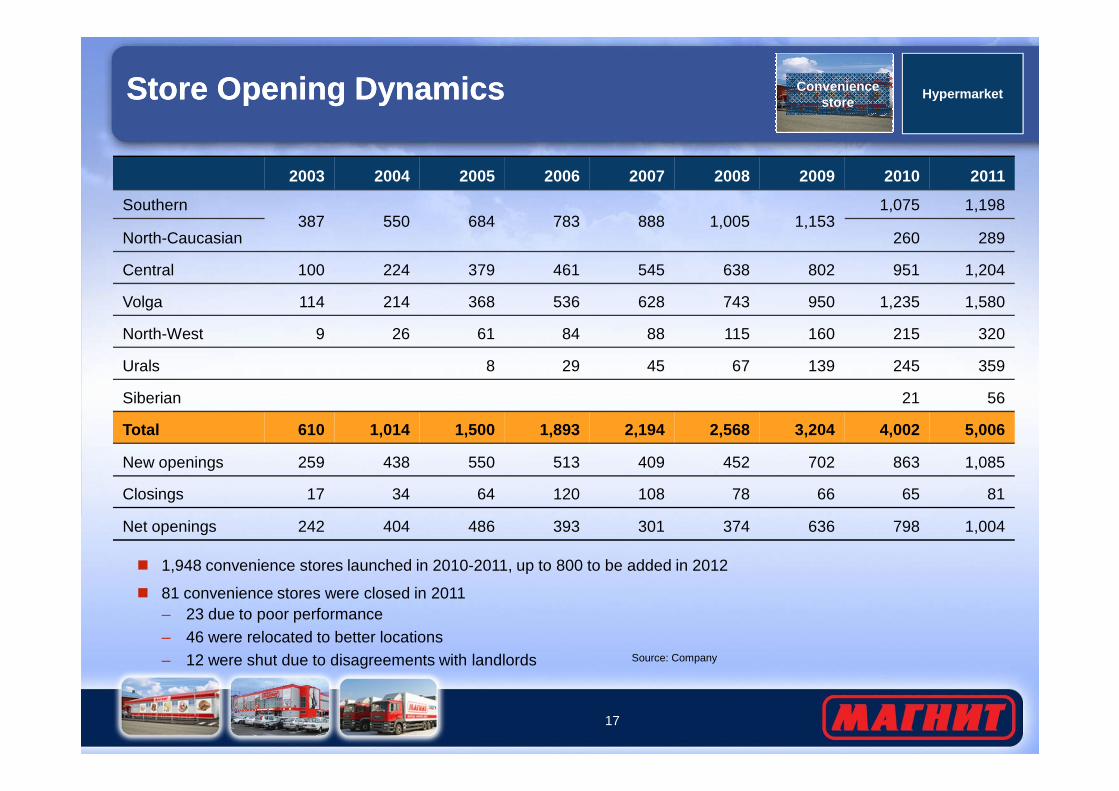
Store Opening DynamicsStore Opening Dynamics
2003 2004 2005 2006 2007 2008 2009 2010 2011
Southern 387 550 684 783 888 1,005 1,153
1,075 1,198
North-Caucasian 260 289
Central 100 224 379 461 545 638 802 951 1,204
Volga 114 214 368 536 628 743 950 1,235 1,580
North-West 9 26 61 84 88 115 160 215 320
Urals 8 29 45 67 139 245 359
Siberian 21 56
HypermarketConvenience store
17
Siberian 21 56
Total 610 1,014 1,500 1,893 2,194 2,568 3,204 4,002 5,006
New openings 259 438 550 513 409 452 702 863 1,085
Closings 17 34 64 120 108 78 66 65 81
Net openings 242 404 486 393 301 374 636 798 1,004
� 1,948 convenience stores launched in 2010-2011, up to 800 to be added in 2012
� 81 convenience stores were closed in 2011– 23 due to poor performance– 46 were relocated to better locations– 12 were shut due to disagreements with landlords Source: Company
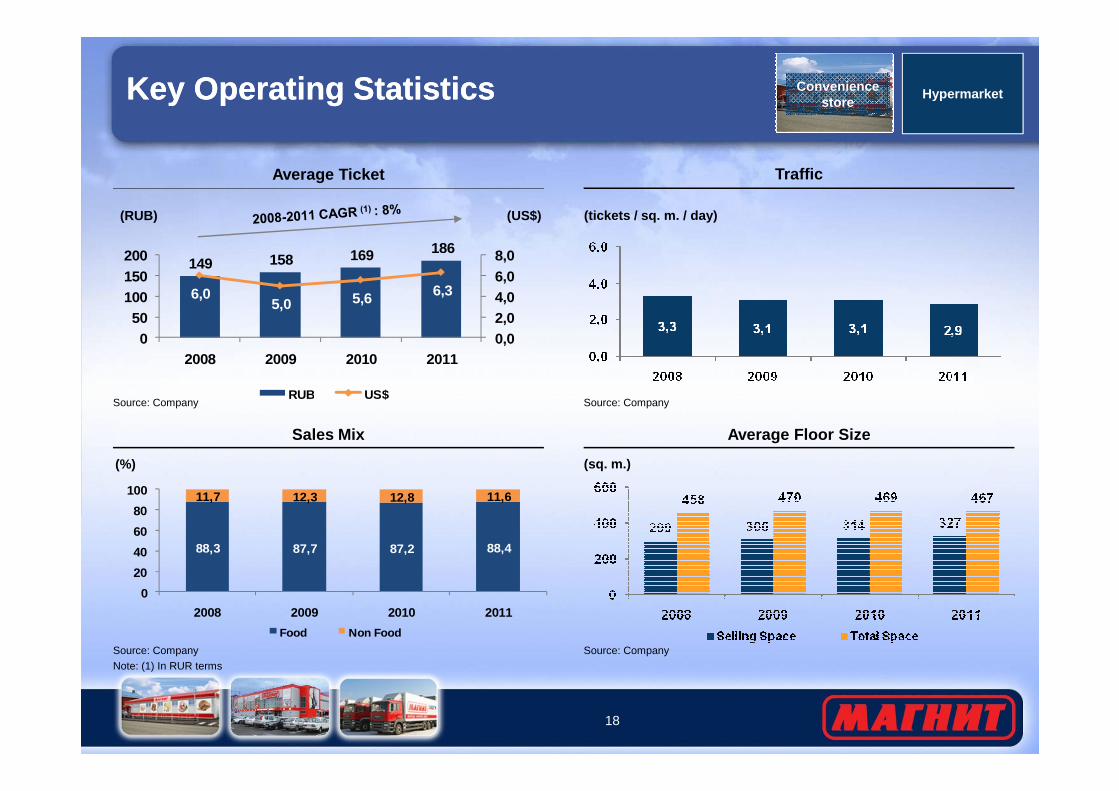
Key Operating StatisticsKey Operating Statistics
Traffic
(tickets / sq. m. / day)
Average Ticket
(RUB) (US$)
Hypermarket
149 158 169 186
6,05,0 5,6 6,3
0,02,04,06,08,0
050
100150200
2008 2009 2010 2011
RUB US$
Convenience store
18
88,3 87,7 87,2 88,4
11,7 12,3 12,8 11,6
0
20
40
60
80
100
2008 2009 2010 2011
Food Non Food
Sales Mix Average Floor Size
Source: Company
Note: (1) In RUR terms
Source: Company
Source: Company
Source: Company
(sq. m.)(%)
RUB US$
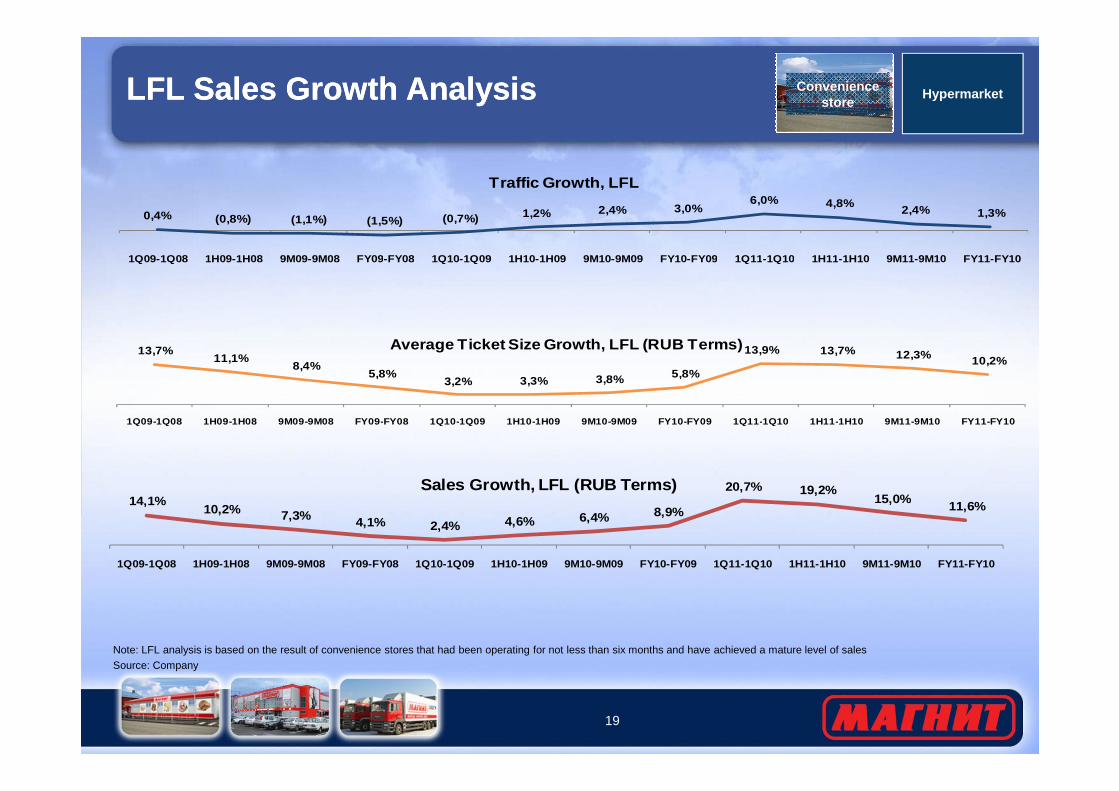
LFL Sales Growth AnalysisLFL Sales Growth Analysis Hypermarket
0,4% (0,8%) (1,1%) (1,5%) (0,7%) 1,2% 2,4% 3,0%6,0% 4,8%
2,4% 1,3%
1Q09-1Q08 1H09-1H08 9M09-9M08 FY09-FY08 1Q10-1Q09 1H10-1H09 9M10-9M09 FY10-FY09 1Q11-1Q10 1H11-1H10 9M11-9M10 FY11-FY10
Traffic Growth, LFL
13,7%11,1%
8,4%5,8%
3,2% 3,3% 3,8% 5,8%
13,9% 13,7% 12,3% 10,2%Average Ticket Size Growth, LFL (RUB Terms)
Convenience store
19
Note: LFL analysis is based on the result of convenience stores that had been operating for not less than six months and have achieved a mature level of sales
Source: Company
1Q09-1Q08 1H09-1H08 9M09-9M08 FY09-FY08 1Q10-1Q09 1H10-1H09 9M10-9M09 FY10-FY09 1Q11-1Q10 1H11-1H10 9M11-9M10 FY11-FY10
14,1%10,2% 7,3% 4,1% 2,4% 4,6% 6,4% 8,9%
20,7% 19,2%15,0%
11,6%
1Q09-1Q08 1H09-1H08 9M09-9M08 FY09-FY08 1Q10-1Q09 1H10-1H09 9M10-9M09 FY10-FY09 1Q11-1Q10 1H11-1H10 9M11-9M10 FY11-FY10
Sales Growth, LFL (RUB Terms)

HypermarketHypermarket
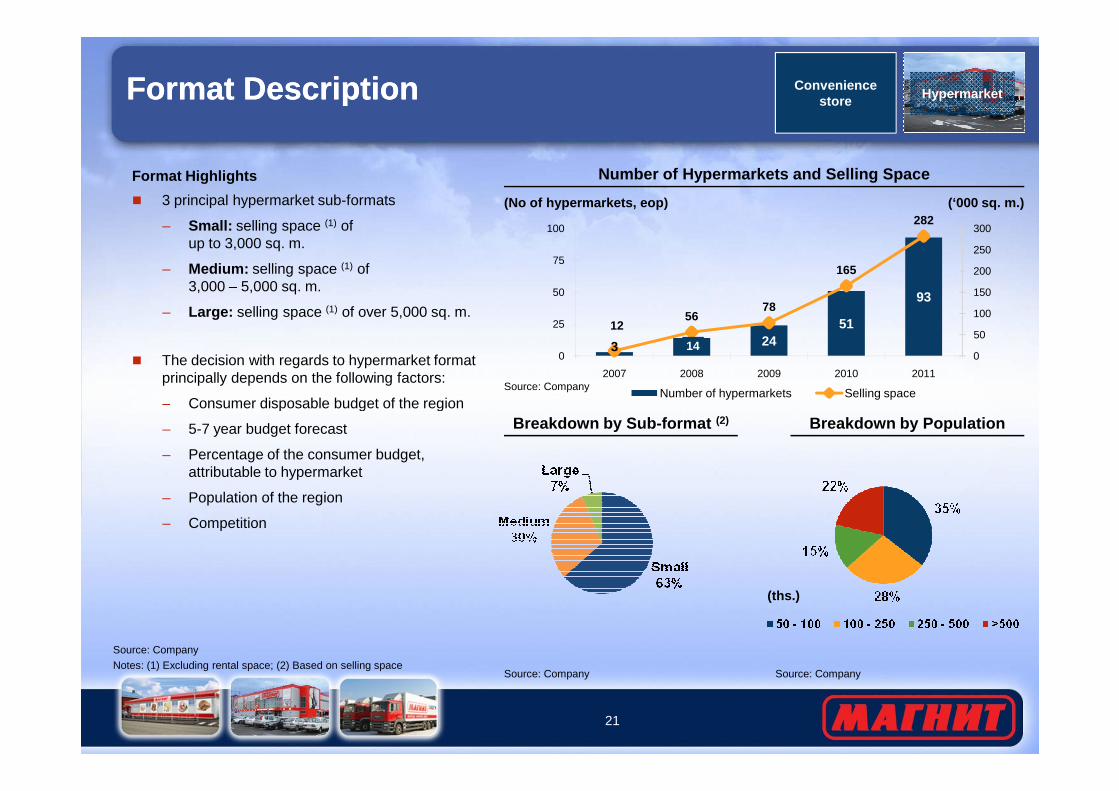
Format DescriptionFormat Description
Format Highlights
� 3 principal hypermarket sub-formats
– Small: selling space (1) of up to 3,000 sq. m.
– Medium: selling space (1) of3,000 – 5,000 sq. m.
– Large: selling space (1) of over 5,000 sq. m.
� The decision with regards to hypermarket format principally depends on the following factors:
– Consumer disposable budget of the region
Number of Hypermarkets and Selling Space
Conveniencestore
Source: Company
(No of hypermarkets, eop) (‘000 sq. m.)
Hypermarket
3 14 2451
93
1256
78
165
282
0
50
100
150
200
250
300
0
25
50
75
100
2007 2008 2009 2010 2011
Number of hypermarkets Selling space
21
Source: Company
– Consumer disposable budget of the region
– 5-7 year budget forecast
– Percentage of the consumer budget, attributable to hypermarket
– Population of the region
– Competition
Breakdown by Sub-format (2) Breakdown by Population
Source: Company
Notes: (1) Excluding rental space; (2) Based on selling spaceSource: Company
(ths.)
Number of hypermarkets Selling space
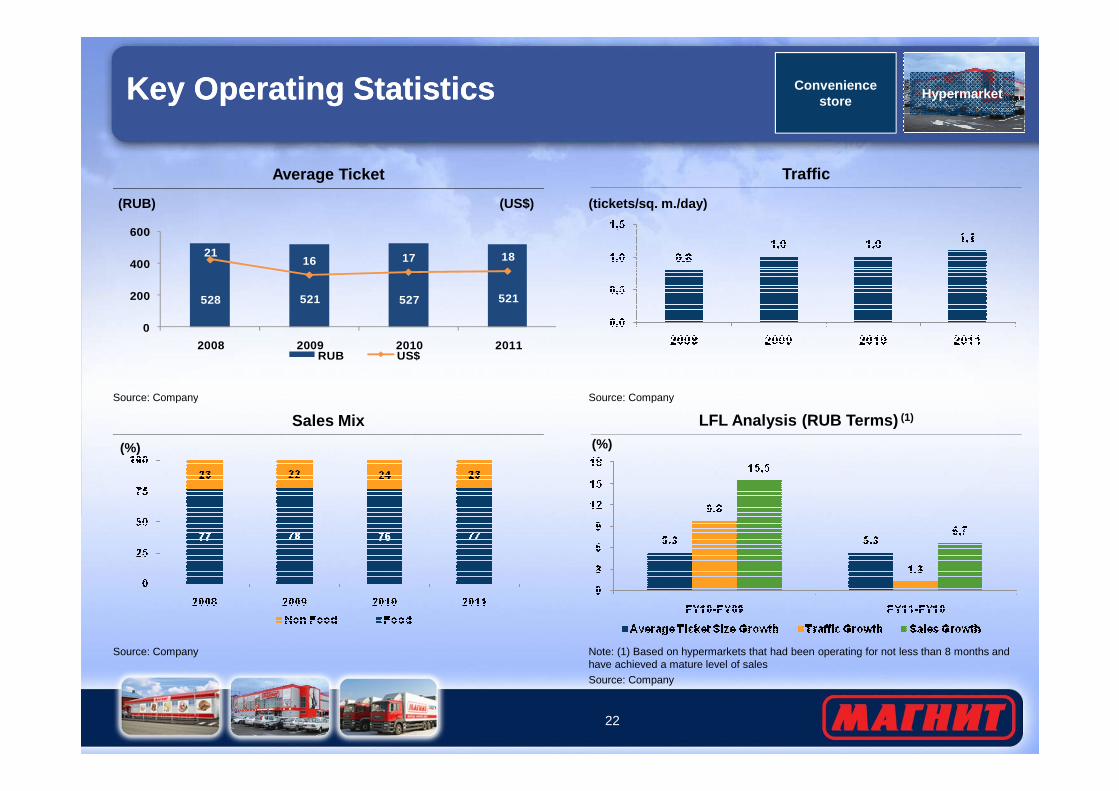
Key Operating StatisticsKey Operating Statistics
TrafficAverage Ticket
(tickets/sq. m./day)
528 521 527 521
2116 17 18
0
200
400
600
2008 2009 2010 2011RUB US$
(RUB) (US$)
Conveniencestore
Source: Company Source: Company
Hypermarket
22
LFL Analysis (RUB Terms) (1)Sales Mix(%)(%)
Source: Company
Source: Company
Note: (1) Based on hypermarkets that had been operating for not less than 8 months and have achieved a mature level of sales
Source: Company
Source: Company
4. Financial Overview4. Financial Overview
Summary P&LSummary P&L
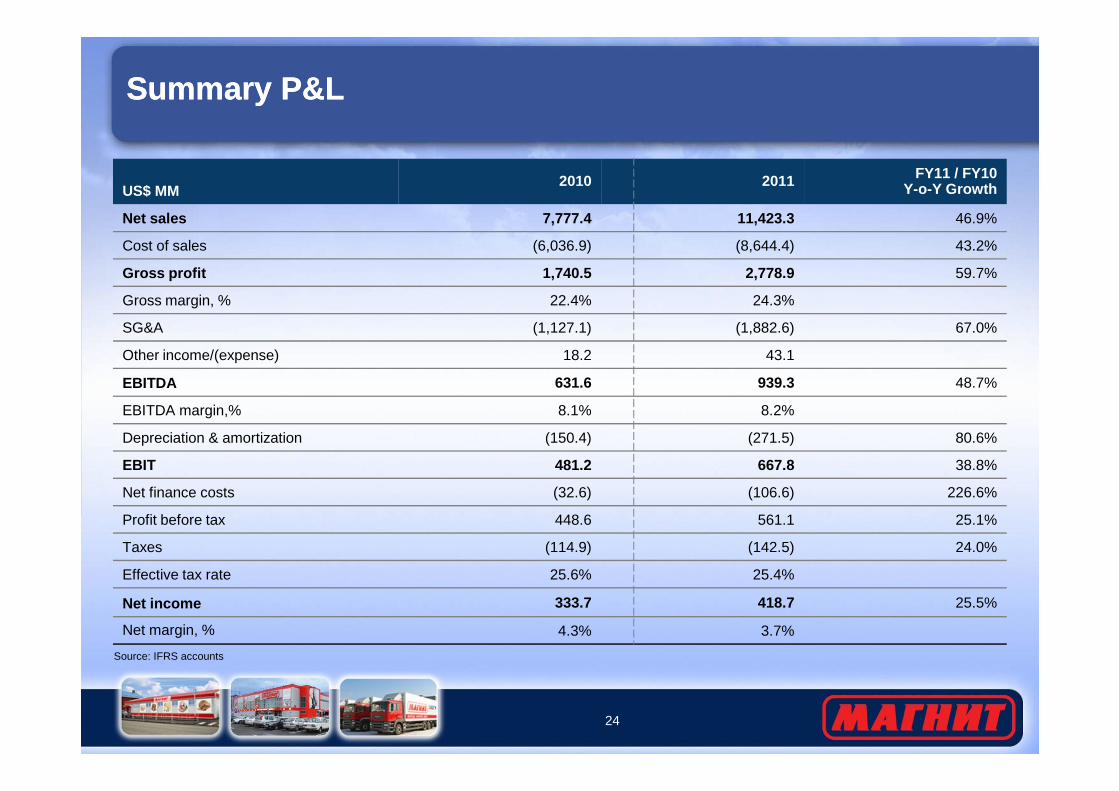
US$ MM2010 2011 FY11 / FY10
Y-o-Y Growth
Net sales 7,777.4 11,423.3 46.9%
Cost of sales (6,036.9) (8,644.4) 43.2%
Gross profit 1,740.5 2,778.9 59.7%
Gross margin, % 22.4% 24.3%
SG&A (1,127.1) (1,882.6) 67.0%
Other income/(expense) 18.2 43.1
EBITDA 631.6 939.3 48.7%
24
Source: IFRS accounts
EBITDA margin,% 8.1% 8.2%
Depreciation & amortization (150.4) (271.5) 80.6%
EBIT 481.2 667.8 38.8%
Net finance costs (32.6) (106.6) 226.6%
Profit before tax 448.6 561.1 25.1%
Taxes (114.9) (142.5) 24.0%
Effective tax rate 25.6% 25.4%
Net income 333.7 418.7 25.5%
Net margin, % 4.3% 3.7%
Gross Margin / EBITDA Margin BridgesGross Margin / EBITDA Margin Bridges
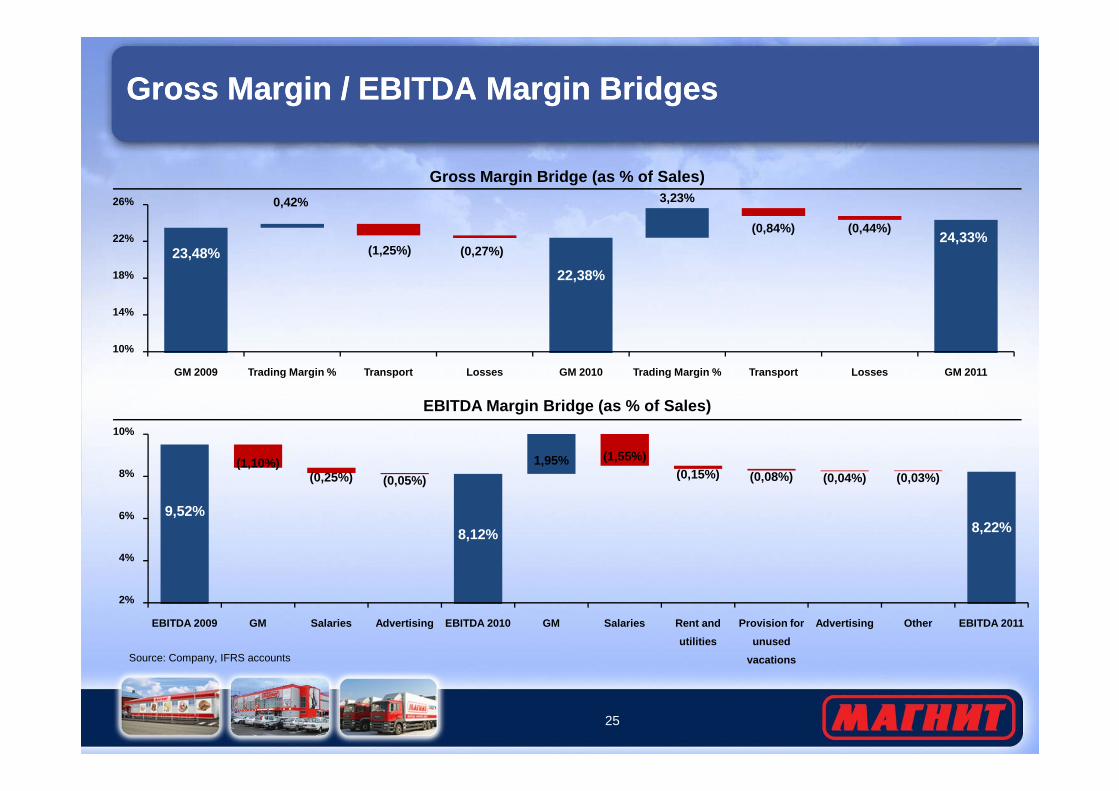
Gross Margin Bridge (as % of Sales)
23,48%
0,42%
(1,25%) (0,27%)
22,38%
3,23%
(0,84%) (0,44%)24,33%
10%
14%
18%
22%
26%
GM 2009 Trading Margin % Transport Losses GM 2010 Tradin g Margin % Transport Losses GM 2011
25
Source: Company, IFRS accounts
EBITDA Margin Bridge (as % of Sales)
9,52%
(1,10%)(0,25%) (0,05%)
8,12%
1,95% (1,55%)(0,15%) (0,08%) (0,04%) (0,03%)
8,22%
2%
4%
6%
8%
10%
EBITDA 2009 GM Salaries Advertising EBITDA 2010 GM Salari es Rent and
utilities
Provision for
unused
vacations
Advertising Other EBITDA 2011
Balance SheetBalance Sheet
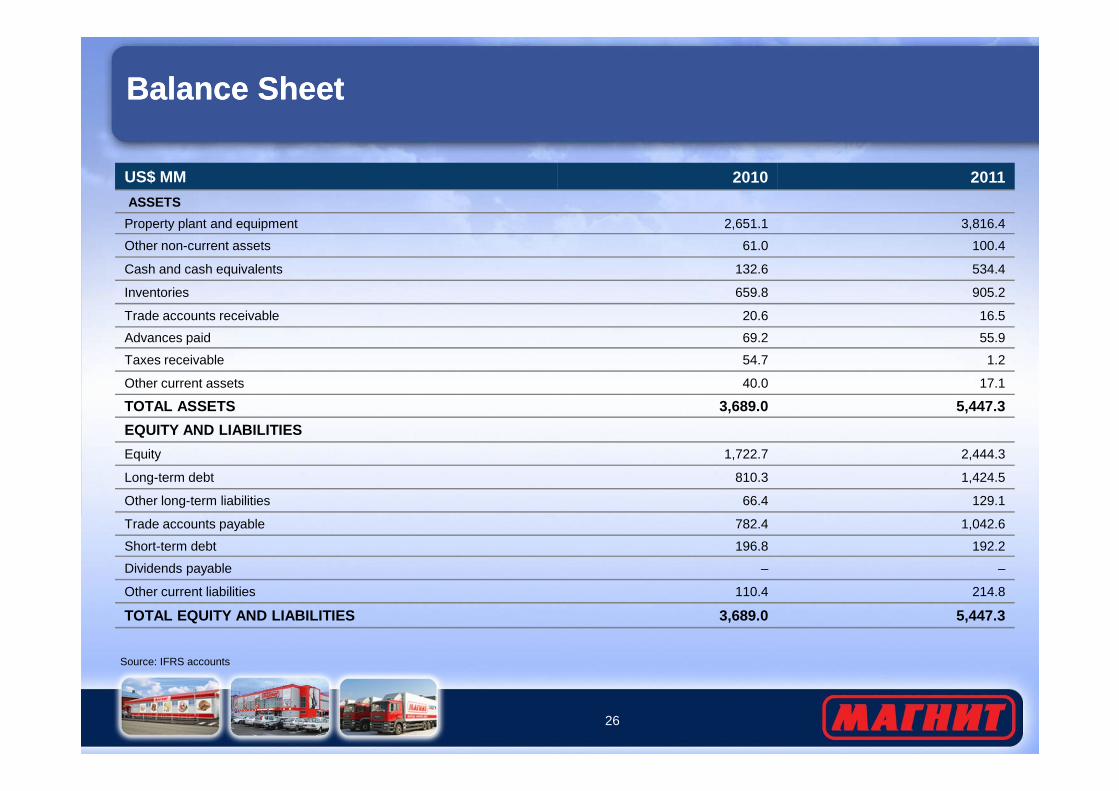
US$ MM 2010 2011
ASSETS
Property plant and equipment 2,651.1 3,816.4
Other non-current assets 61.0 100.4
Cash and cash equivalents 132.6 534.4
Inventories 659.8 905.2
Trade accounts receivable 20.6 16.5
Advances paid 69.2 55.9
Taxes receivable 54.7 1.2
Other current assets 40.0 17.1
26
Source: IFRS accounts
TOTAL ASSETS 3,689.0 5,447.3
EQUITY AND LIABILITIES
Equity 1,722.7 2,444.3
Long-term debt 810.3 1,424.5
Other long-term liabilities 66.4 129.1
Trade accounts payable 782.4 1,042.6
Short-term debt 196.8 192.2
Dividends payable – –
Other current liabilities 110.4 214.8
TOTAL EQUITY AND LIABILITIES 3,689.0 5,447.3
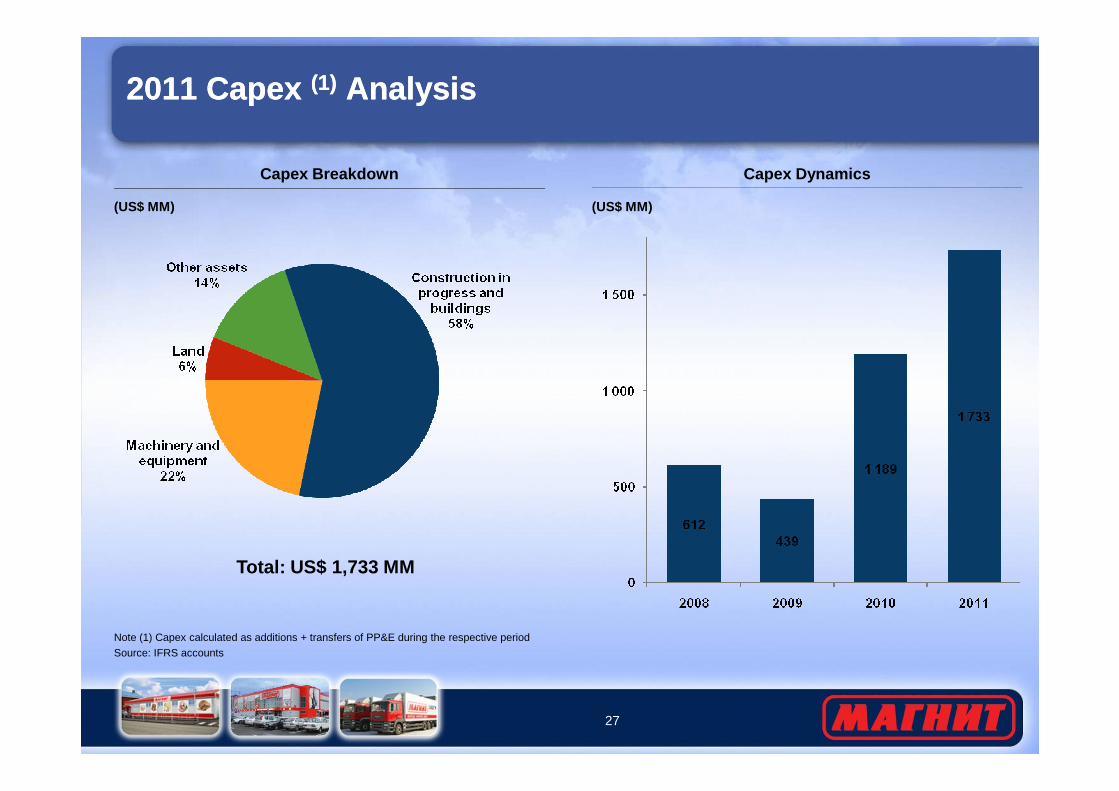
2011 Capex (1) Analysis2011 Capex (1) Analysis
(US$ MM)
Capex DynamicsCapex Breakdown
(US$ MM)
27
Note (1) Capex calculated as additions + transfers of PP&E during the respective period
Source: IFRS accounts
Total: US$ 1,733 MM
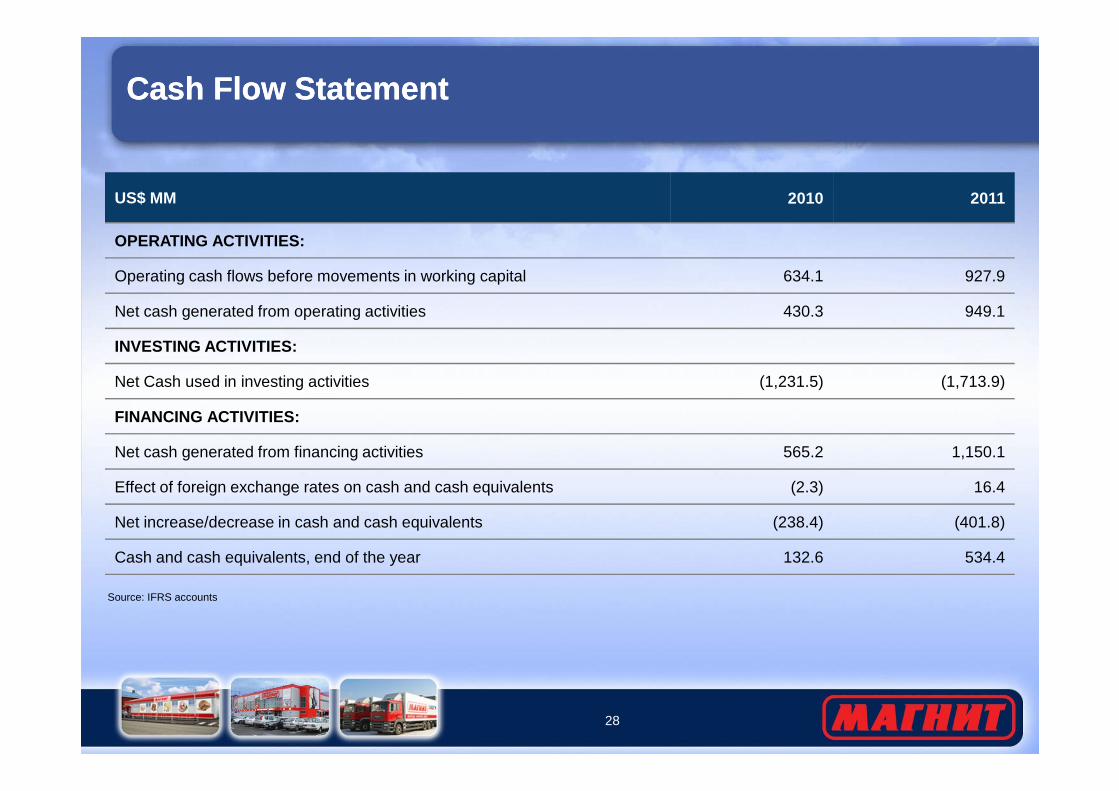
Cash Flow StatementCash Flow Statement
US$ MM 2010 2011
OPERATING ACTIVITIES:
Operating cash flows before movements in working capital 634.1 927.9
Net cash generated from operating activities 430.3 949.1
INVESTING ACTIVITIES:
Net Cash used in investing activities (1,231.5) (1,713.9)
28
Source: IFRS accounts
FINANCING ACTIVITIES:
Net cash generated from financing activities 565.2 1,150.1
Effect of foreign exchange rates on cash and cash equivalents (2.3) 16.4
Net increase/decrease in cash and cash equivalents (238.4) (401.8)
Cash and cash equivalents, end of the year 132.6 534.4
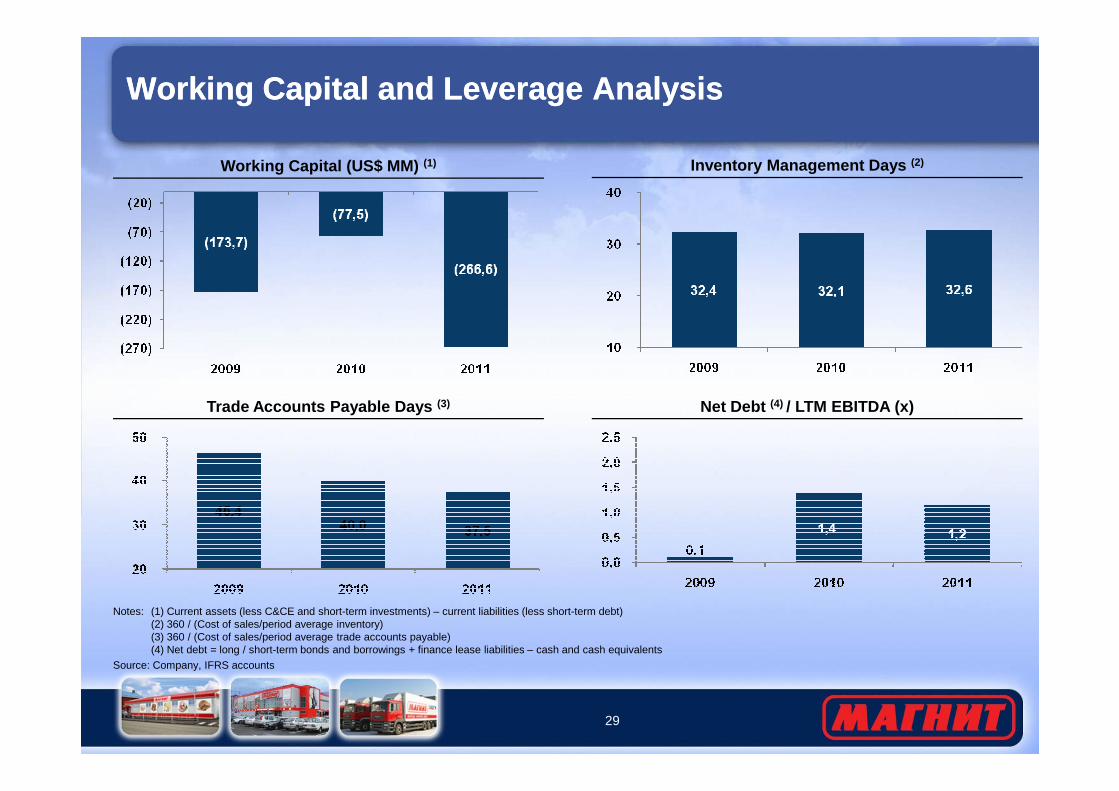
Working Capital and Leverage AnalysisWorking Capital and Leverage Analysis
Inventory Management Days (2)Working Capital (US$ MM) (1)
29
Trade Accounts Payable Days (3)
Notes: (1) Current assets (less C&CE and short-term investments) – current liabilities (less short-term debt)(2) 360 / (Cost of sales/period average inventory)(3) 360 / (Cost of sales/period average trade accounts payable)(4) Net debt = long / short-term bonds and borrowings + finance lease liabilities – cash and cash equivalents
Source: Company, IFRS accounts
Net Debt (4) / LTM EBITDA (x)
5. General Business Overview5. General Business Overview
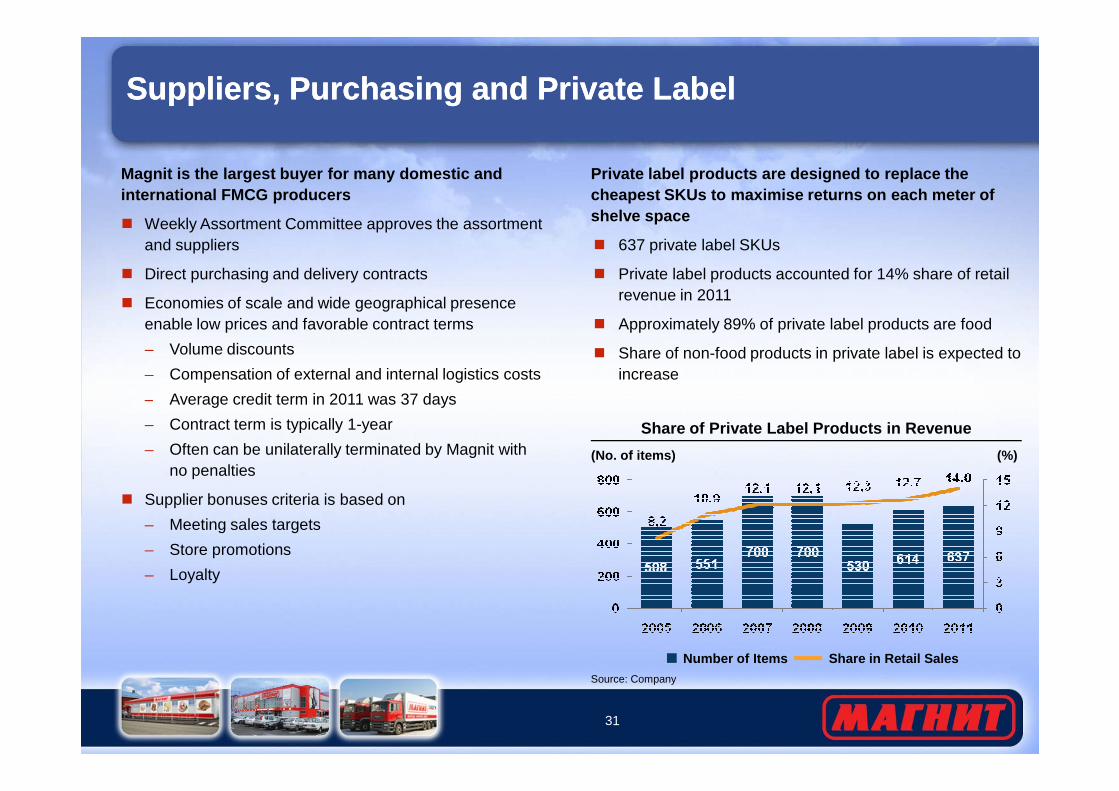
Suppliers, Purchasing and Private LabelSuppliers, Purchasing and Private Label
Magnit is the largest buyer for many domestic and international FMCG producers
� Weekly Assortment Committee approves the assortment and suppliers
� Direct purchasing and delivery contracts
� Economies of scale and wide geographical presence enable low prices and favorable contract terms
– Volume discounts
– Compensation of external and internal logistics costs
– Average credit term in 2011 was 37 days
Private label products are designed to replace the cheapest SKUs to maximise returns on each meter of shelve space
� 637 private label SKUs
� Private label products accounted for 14% share of retail revenue in 2011
� Approximately 89% of private label products are food
� Share of non-food products in private label is expected to increase
31
Share of Private Label Products in Revenue
(%)
Number of Items Share in Retail Sales
– Average credit term in 2011 was 37 days
– Contract term is typically 1-year
– Often can be unilaterally terminated by Magnit withno penalties
� Supplier bonuses criteria is based on
– Meeting sales targets
– Store promotions
– Loyalty
Source: Company
(No. of items)
Logistics SystemLogistics System
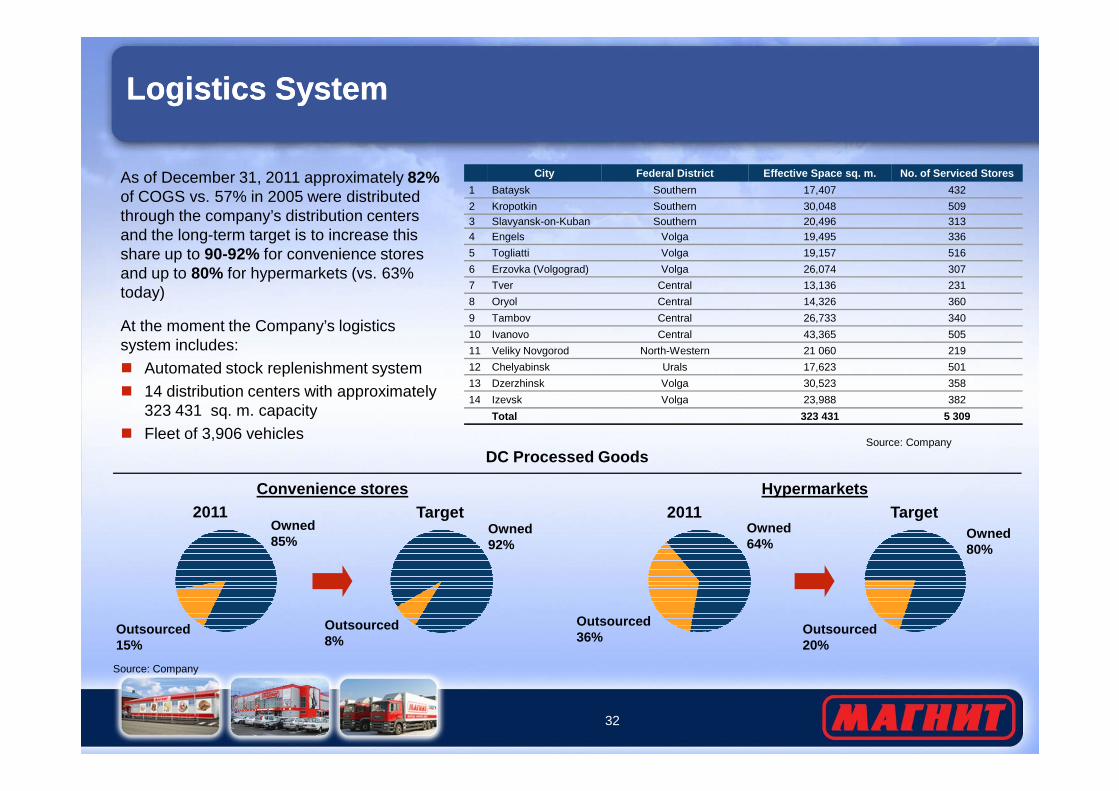
As of December 31, 2011 approximately 82%of COGS vs. 57% in 2005 were distributed through the company’s distribution centers and the long-term target is to increase this share up to 90-92% for convenience stores and up to 80% for hypermarkets (vs. 63% today)
At the moment the Company’s logistics system includes:
� Automated stock replenishment system
� 14 distribution centers with approximately
City Federal District Effective Space sq. m. No. of Se rviced Stores
1 Bataysk Southern 17,407 432
2 Kropotkin Southern 30,048 5093 Slavyansk-on-Kuban Southern 20,496 3134 Engels Volga 19,495 336
5 Togliatti Volga 19,157 516
6 Erzovka (Volgograd) Volga 26,074 307
7 Tver Central 13,136 231
8 Oryol Central 14,326 360
9 Tambov Central 26,733 340
10 Ivanovo Central 43,365 505
11 Veliky Novgorod North-Western 21 060 219
12 Chelyabinsk Urals 17,623 501
13 Dzerzhinsk Volga 30,523 358
14 Izevsk Volga 23,988 382
32
� 14 distribution centers with approximately 323 431 sq. m. capacity
� Fleet of 3,906 vehicles
14 Izevsk Volga 23,988 382
Total 323 431 5 309
DC Processed GoodsSource: Company
Target20112011
Outsourced15%
Owned85%
Outsourced8%
Owned64%
Outsourced36%
Owned80%
TargetConvenience stores Hypermarkets
Owned92%
Outsourced20%
Source: Company
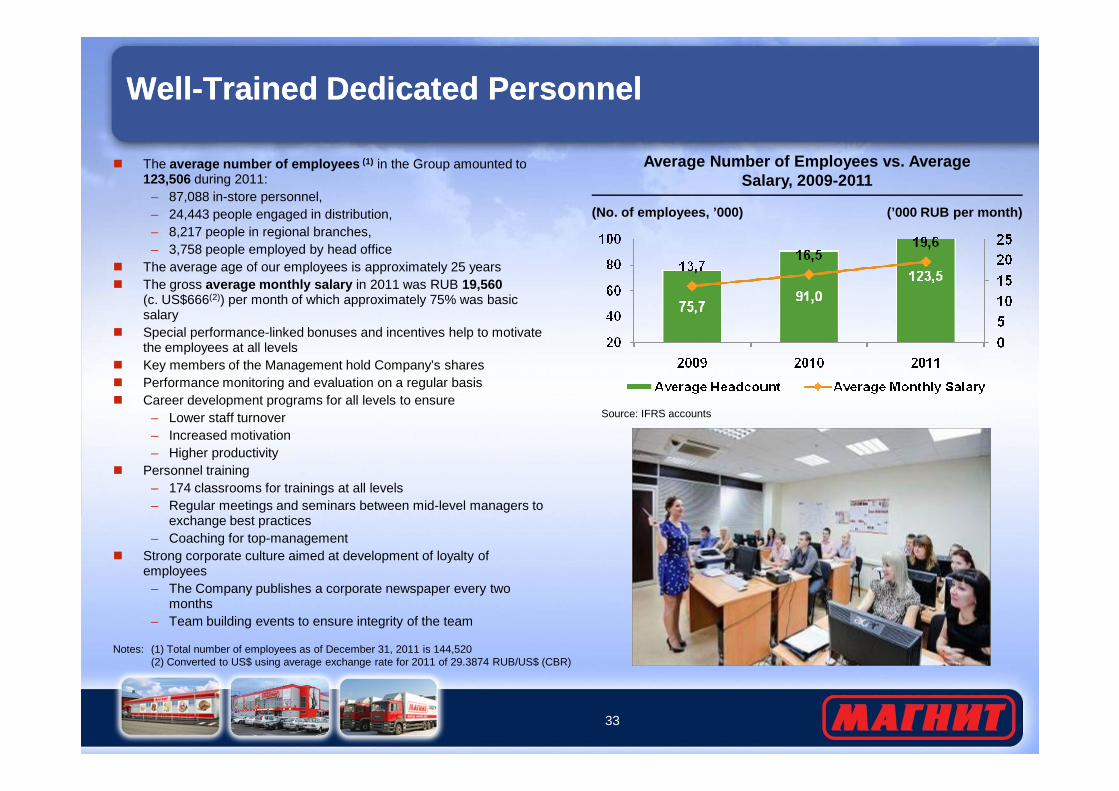
Well-Trained Dedicated PersonnelWell-Trained Dedicated Personnel
Average Number of Employees vs. Average Salary, 2009-2011
� The average number of employees (1) in the Group amounted to 123,506 during 2011:
– 87,088 in-store personnel,– 24,443 people engaged in distribution,– 8,217 people in regional branches,– 3,758 people employed by head office
� The average age of our employees is approximately 25 years� The gross average monthly salary in 2011 was RUB 19,560
(c. US$666(2)) per month of which approximately 75% was basic salary
� Special performance-linked bonuses and incentives help to motivate the employees at all levels
� Key members of the Management hold Company’s shares� Performance monitoring and evaluation on a regular basis� Career development programs for all levels to ensure
(No. of employees, ’000) (’000 RUB per month)
33
� Career development programs for all levels to ensure– Lower staff turnover– Increased motivation– Higher productivity
� Personnel training– 174 classrooms for trainings at all levels– Regular meetings and seminars between mid-level managers to
exchange best practices– Coaching for top-management
� Strong corporate culture aimed at development of loyalty of employees
– The Company publishes a corporate newspaper every two months
– Team building events to ensure integrity of the team
Source: IFRS accounts
Notes: (1) Total number of employees as of December 31, 2011 is 144,520(2) Converted to US$ using average exchange rate for 2011 of 29.3874 RUB/US$ (CBR)

6. Summary Conclusions6. Summary Conclusions
Summary ConclusionsSummary Conclusions
Leading Russian retailer: broadest geographic coverage with 5,309 stores (as of 31 December 2011) in more than 1,389 cities in seven out of eighth federal districts in Russia
Further organic growth of store operations: continued roll-out of established business model in existing markets and selective expansion into new geographic areas
Strong foothold in Russia’s cities and towns with p opulation under 500,000 people: first mover advantage (first retailer in many locations to establish a modern format); low competition from other chains outside of Russia’s large cities
35
in existing markets and selective expansion into new geographic areas
Expanding hypermarket operations: leveraging strong existing platform (operations, logistics, brand, scale) to develop a leading hypermarket chain in the European part of Russia
Additional measures to improve profitability: enhancing product mix, shifting to direct import contracts, increasing private label and increasing distribution through own logistics system to achieve margin improvements and cost savings
Financing of expansion program: implementation of the Company’s mid-term strategy will be executed through a mix of operating cashflow and debt (bank loans and bonds)
AppendixAppendix
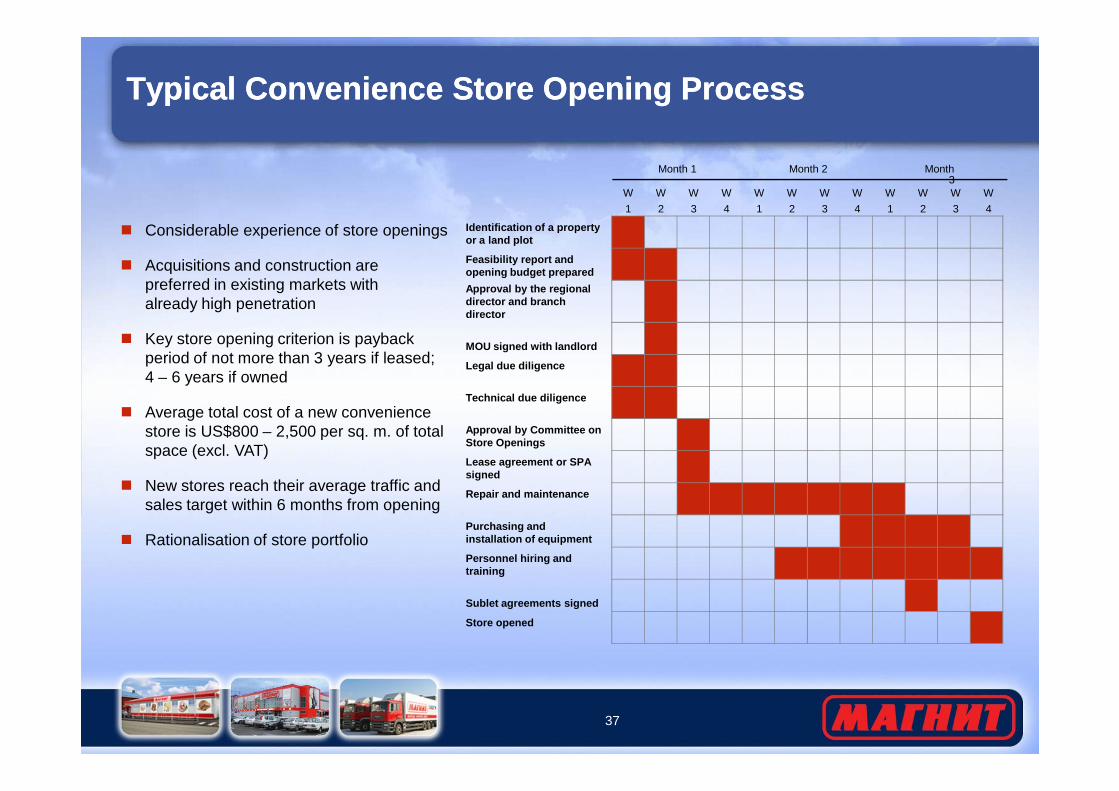
Typical Convenience Store Opening ProcessTypical Convenience Store Opening Process
� Considerable experience of store openings
� Acquisitions and construction are preferred in existing markets with already high penetration
� Key store opening criterion is payback period of not more than 3 years if leased; 4 – 6 years if owned
Identification of a property or a land plot
Feasibility report and opening budget prepared
Approval by the regional director and branch director
MOU signed with landlord
Legal due diligence
Technical due diligence
W
1
W
2
W
3
W
4
W
1
W
2
W
3
W
4
W
1
W
2
W
3
W
4
Month 1 Month 2 Month 3
37
� Average total cost of a new convenience store is US$800 – 2,500 per sq. m. of total space (excl. VAT)
� New stores reach their average traffic and sales target within 6 months from opening
� Rationalisation of store portfolio
Technical due diligence
Approval by Committee on Store Openings
Lease agreement or SPA signed
Repair and maintenance
Purchasing and installation of equipment
Personnel hiring and training
Sublet agreements signed
Store opened
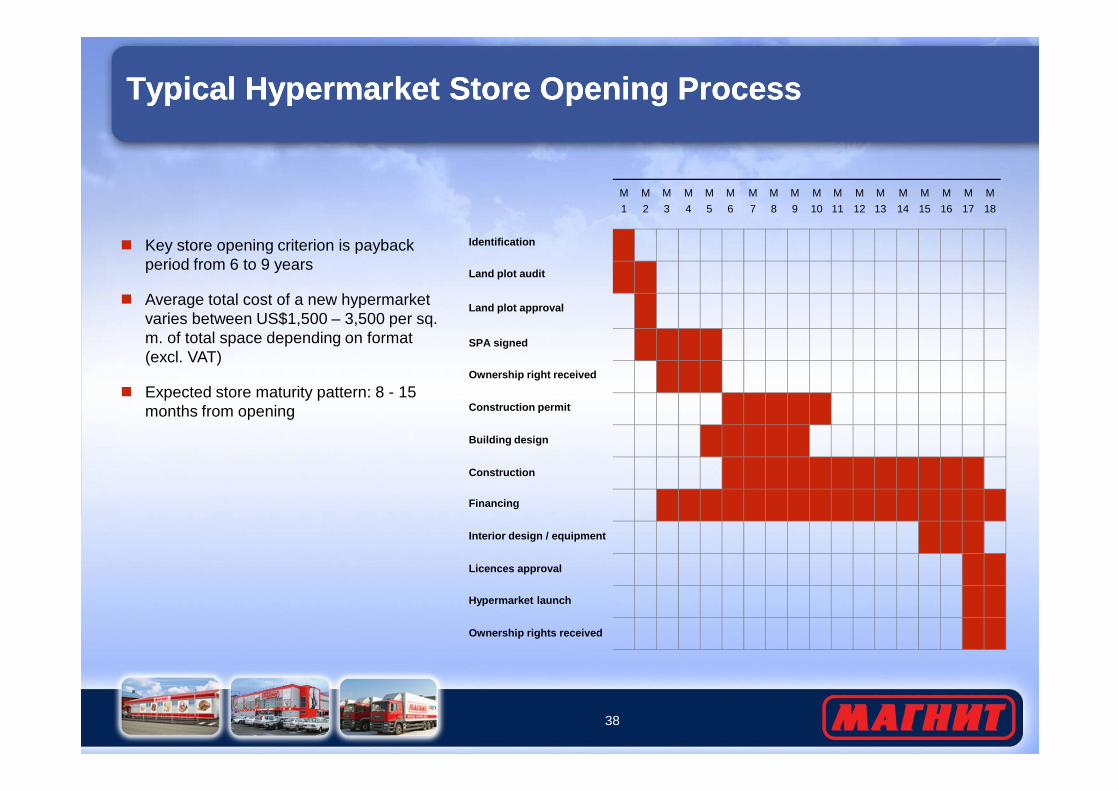
Typical Hypermarket Store Opening ProcessTypical Hypermarket Store Opening Process
M
1
M
2
M
3
M
4
M
5
M
6
M
7
M
8
M
9
M
10
M
11
M
12
M
13
M
14
M
15
M
16
M
17
M
18
Identification
Land plot audit
Land plot approval
SPA signed
Ownership right received
� Key store opening criterion is payback period from 6 to 9 years
� Average total cost of a new hypermarket varies between US$1,500 – 3,500 per sq. m. of total space depending on format (excl. VAT)
� Expected store maturity pattern: 8 - 15
38
Construction permit
Building design
Construction
Financing
Interior design / equipment
Licences approval
Hypermarket launch
Ownership rights received
� Expected store maturity pattern: 8 - 15 months from opening
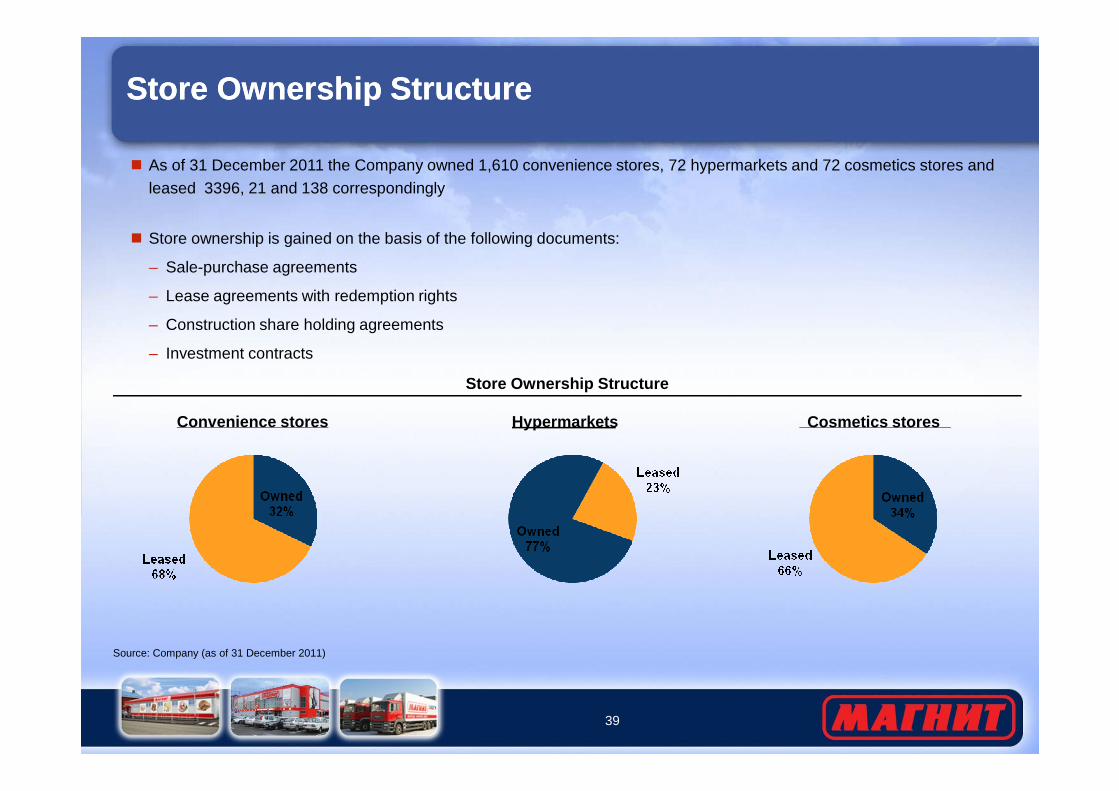
Store Ownership StructureStore Ownership Structure
Store Ownership Structure
� As of 31 December 2011 the Company owned 1,610 convenience stores, 72 hypermarkets and 72 cosmetics stores and leased 3396, 21 and 138 correspondingly
� Store ownership is gained on the basis of the following documents:
– Sale-purchase agreements
– Lease agreements with redemption rights
– Construction share holding agreements
– Investment contracts
39
Source: Company (as of 31 December 2011)
Convenience stores Hypermarkets Cosmetics stores
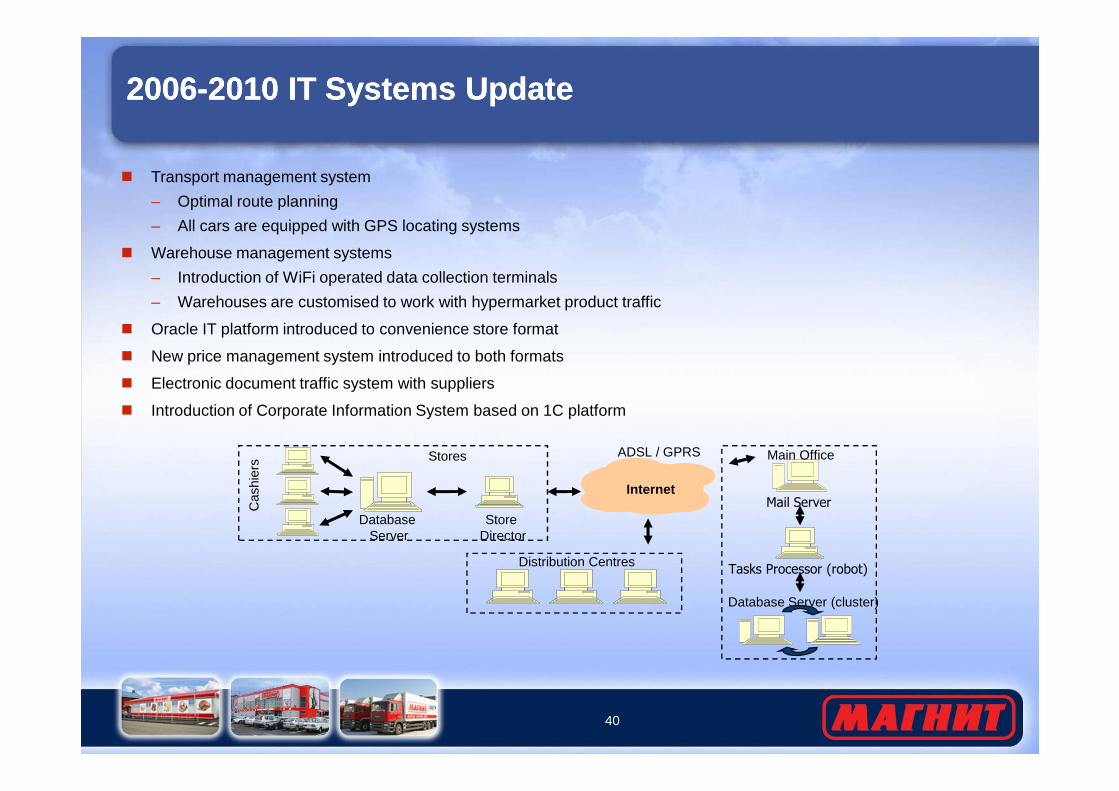
2006-2010 IT Systems Update2006-2010 IT Systems Update
� Transport management system
– Optimal route planning
– All cars are equipped with GPS locating systems
� Warehouse management systems
– Introduction of WiFi operated data collection terminals
– Warehouses are customised to work with hypermarket product traffic
� Oracle IT platform introduced to convenience store format
� New price management system introduced to both formats
� Electronic document traffic system with suppliers
40
� Introduction of Corporate Information System based on 1C platform
Cas
hier
s
Internet
Database Server
Store Director
Mail Server
ADSL / GPRS
Database Server (cluster)
Distribution CentresTasks Processor (robot)
Main OfficeStores