Embed Size (px)
Citation preview

2014 Commercial Real Estate Market Update

Featured Speaker
If you would like a copy of tonight’s presentation,
please visit www.colliers.com/Houston/TRENDS

www.colliers.com/kc.conway
K.C. Conway, MAI, CRE
Chief Economist | USA
Colliers International
TRENDS 2014 “Over the River and through the Woods …”
What’s 2014 Outlook at Grandma’s House in
Houston? Texas? U.S.?
February 4, 2014

The Entrepreneurs Vs. KRONIES Action Figures!
Parts & Labor, The Bancor & “G-Force” on “K” Street
5 http://www.youtube.com/watch?feature=player_embedded&v=ZDXuPQ9ML9E

“A” – Value of Argentine Peso – or Turkish
Lira at end of 2014 … but monitor currency! “B” – What is real value of a Bitcoin?
($10 to $1,200 trade range in 2013)
“C” – Why a major American city with the
world’s busiest airport can’t handle 2” of snow
“D” – Why Houston wasn’t ranked #1
among Top Markets in
2014 Emerging Trends?
7
The A, B, C, D Questions KC won’t answer: “ A man has got to know his limits” - Clint Eastwood

“A” – Port of Houston will remain most
Irreplaceable - and America’s GDP port!
“B” – The BLS will incorrectly estimate
job growth 12 times again in 2014!
“C” – Colliers will be an MVP relationship &
advisor to you again in 2014!
“D” – Debt Capital will never be this good.
Don’t delay or “sit on the fence” in 2014!
8
The A, B, C, D Definitive KC Forecasts for 2014: “If you don’t know somethin’, what good are ya?”

9
What did KC forecast for 2013? A 100% score after 80% in 2012 Jan ‘13 KC said: “Beware of Q1, but be prepared for a robust 2H2013.”
GDP:
Pulls back to 1% or less in 1H2013,
but Rebounds >2% in 2H2013
(No “Cash for Clunkers” or housing tax
credit artificial stimulants).
Employment:
Focus on Labor Participation rate
(63.6%), U-6 (14.4%), & expect
another year of <200k/mo. job
growth
U-3 could drop below 7% just on
workers losing Unempl. benefits.
Interest Rates:
Get ‘eer done in 2013!
2nd U.S. Debt downgrade >50%
FED balance sheet @ 20% US GDP
Monitor commodity prices.
Housing:
The recovery is real!
NAHB IMI > 200 markets.
US Census Housing Occupancy
(50 MSAs 90% to 96%)
MF:
Overbuilding Risk is exaggerated
Too much in just a few MSAs (DC)
TX is OK: 1 unit : 9.2 jobs in 2012
Office:
ICEE office MSAs still hot.
Recovery in housing will add to
suburban absorption.
½ the 71.5msf of new office
construction is Med Office
Industrial:
Ports will remain an imPORTant story!
Port Labor Strife not done – Feb 6, 2013.
Leasing activity remains robust
Dearth of new constr & assets for sale.

So let’s look at 2014 & start with GDP: GDP 2013 Trend: Q1: 1.1% / Q2: 2.5% / Q3: 4.1% / Q4 3.2% = 2.7% for 2013
GDP 2014 Forecast: Slows back <2% in 1H due to inventory build in 2H 2013
10
GDP EKG 1950-2013
1950 peak; 1958 low; 3.25% L-Term Trend
What drove GDP in 2H2013? Build in Inventories in Q3; Consumer Spending in
Q4 (Advance view) 2013 GDP: Q1: 1.1%; Q2: 2.5%; Q3: 4.1%; Q4: 3.2% (Adv Est)

Employment …
Monitor ADP, Challenger, NFIB, ISM Vs. BLS
11
UNEMPLOYMENT – Is it really declining?

BANKS & The FED …
Are we done with Bank Failures? What will be different?
12
BANK FAILURES – Will 2014 be different than 2013?
What is different in 2014?
FDIC gets a premium for deposits & failures not tied to housing.

BANKS & The FED …
Banks back to lending? Beware the Bank Stress Tests
13
35% vs. 21%
decline in CRE
value in Yr-End
2013 CCAR/Bank
Stress tests.
“March Madness”
ahead for banks
TX Banks
Comerica & BBVA
appear to be
slowing
CRE loan growth.
Watch Citi.

Banks & the FED: Volatility in 2014!
A new FOMC! QE taper; Currency Crises; GDP; Jobs???
14
The FED
meets 8
times/yr.
Structure of the FOMC The Federal Open Market
Committee (FOMC) consists of
twelve members--the seven
members of the Board of
Governors of the Federal Reserve
System; the president of the
Federal Reserve Bank of New
York; and four of the remaining
eleven Reserve Bank presidents,
who serve one-year terms on a
rotating basis
NE Vs. MW Yellen
is now
FED
Chair!
Dallas FED being a voting member of
FOMC in 2014 is a significant!

INTEREST RATES
Let’s hope this correlation holds up for 2013
15
Jan 1
1982
14.59% Jan 1
2013
3.01%
Expect
Volatility & a
10-Yr range of
2%-4%

STATE TAX RATES
NE, DC region & CA worst, but TX not among 10-Best?
16
Why isn’t TX
among 10-Best
&
How does FL
make it among
10-Best
with such high
auto ad
valorem, hotel
occupancy, etc.
taxes? Need to add SC
with high point
of sale on R.E.
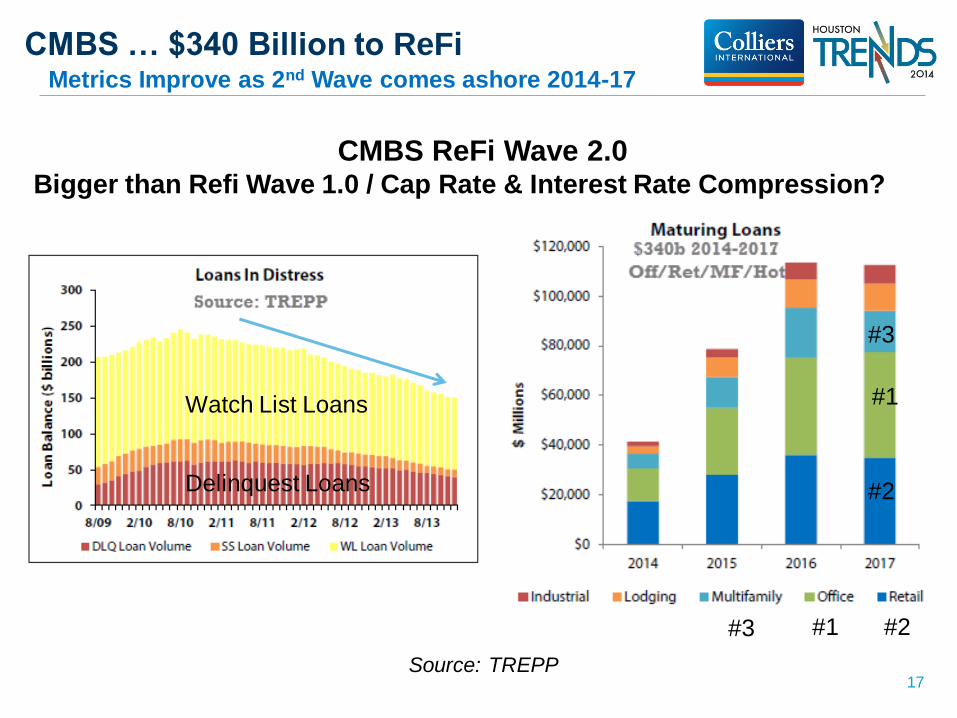
CMBS … $340 Billion to ReFi Metrics Improve as 2nd Wave comes ashore 2014-17
17
CMBS ReFi Wave 2.0 Bigger than Refi Wave 1.0 / Cap Rate & Interest Rate Compression?
#1 #3 #2
#1
#2
#3
Source: TREPP
Watch List Loans
Delinquest Loans

Housing …
Monitor ADP, Challenger, NFIB, ISM Vs. BLS &
NAHB HMI (Builder Sentiment Index
18
Housing – Best year since 2007, but can it continue?
(AP) — U.S. home construction ended 2013 with the best showing since the housing bubble
burst. Builders broke ground last month at a seasonally annual rate of 999,000, the fastest in
five years. For the year, builders started 923,000 homes and apartments, up 18.3 percent from
2012. It was the strongest since 2007, when 1.36 million homes were started.
The avg. rate on a 30-year mtg fell to 4.41% - down from a peak of 4.6% in August.
Each home built creates 3 jobs for a year and generates $90,000 in tax revenue, according
to data from the homebuilders association.
http://www.nahb.org/reference_list.aspx?sectionID=2223

Housing … Multifamily
NAHB HMI (Builder Sentiment Index)
19
Not
Overbdg
MF
Why?
>8:1 ratio

Housing … Multifamily
Houston can absorb the new supply! Sales are strong!
20

Manufacturing …
ISM Strong (5%); Warehouse Absorption Strong… Houston?
21
Manufacturing / Intermodal / IANA / Warehouse Absorption
Industrial Absorp. – Port, Air Cargo, Intermodal
Houston has lacked new supply to rank high!
RailTime: 2013 a record for Intermodal
ISM Vs. GDP
More granular – backlog orders, etc.)

FTZs – Foreign Trade Zones … Next annual report to Congress due out Aug 2014!
22 http://enforcement.trade.gov/ftzpage/index.html
MEXICO
wage rate a
big story?

Ports & Panama Canal…
West coast port strike threat June 2014!
23
www.colliers.com/us/port-2H

The 7 Class 1 Railroads… Mexico wage rate &
KCS a big-deal to TX & mfg. story!
24
The 7- Class I RRs (Note CN (red) & KCS (brown)
“All that happens on the ports, doesn’t
stay on the ports” – Rail, Intermodal!

Ports & Industrial R.E …
The 2014 influences heading into 1st Post PMX Decade.
25
P-Canal 50%
cost overrun
dispute
Labor Strife: Chile
now (fresh fruit and
copper); West-
coast June 2014
Who will be able to
refuel Duel-Fuel?
SE (Jax) & Gulf ports
have advantage
And one other …
NY faces new competition
from Mid-Atl & Great Lakes
ports, like Cleveland

26
Close with ONEI & AFIRE TX MSAs dominate top-5 / Houston ranked #5 at Yr-End 2013
r
YE 2014
Rank Metro Overall score
5-year
job gr.
1-year
job gr.
Unempl.
Rate
Weekly
earnings
5-year
earnings
growth
1-year HPA /
Home $ Appr
1 Austin 84.186 11.80% 3.80% 5.20% $929 14.50% 9.00%
2 Dallas-Fort Worth 84.161 6.00% 3.60% 6.00% $943 17.90% 6.80%
3 Provo, Utah 82.503 6.70% 4.30% 4.90% $803 47.00% 10.70%
4 San Jose 80.498 3.40% 3.30% 6.80% $1,456 16.60% 16.90%
5 Houston 79.632 9.00% 3.30% 6.10% $973 15.80% 6.00%
6 Oklahoma City 76.092 3.60% 2.70% 4.70% $786 22.30% 2.60%
7 Honolulu 75.224 1.00% 1.50% 3.80% $824 14.60% 6.80%
8 Denver 74.359 2.20% 2.70% 6.50% $1,008 14.90% 10.30%
9 Ogden, Utah 74.31 3.20% 4.00% 4.90% $720 13.70% 6.20%
10 Minneapolis-St. Paul 73.393 2.30% 2.30% 4.70% $942 13.50% 8.10%
11 Boston 70.943 2.90% 2.50% 6.20% $1,102 13.70% 3.40%
12 Grand Rapids, Mich. 68.914 6.80% 3.70% 6.40% $765 2.70% 6.20%
13 Tampa-St. Petersburg 67.106 2.20% 4.40% 7.00% $789 4.60% 8.40%
14 Salt Lake City 66.933 3.20% 3.50% 4.50% $915 6.60% 9.90%
15 Indianapolis 65.769 2.60% 1.50% 6.90% $888 16.70% 2.20%
16 Charleston, S.C. 65.051 2.40% 1.30% 6.90% $778 34.30% 6.10%
17 Nashville 64.359 8.50% 3.70% 6.80% $793 4.60% 4.10%
18 San Francisco-Oakland 64.012 0.90% 1.50% 6.50% $1,142 5.90% 17.10%
19 Orlando 63.245 0.80% 2.60% 6.60% $805 3.80% 10.60%
20 Seattle 63.22 0.10% 2.90% 6.10% $1,170 12.20% 9.90%
21 Pittsburgh 62.75 3.40% 2.00% 7.20% $851 24.30% 3.40%
22 Madison, Wis. 62.452 1.80% 1.50% 4.50% $1,002 22.20% 2.60%
23 Des Moines, Iowa 61.735 2.20% 1.90% 4.70% $926 13.30% 2.10%
24 Bakersfield, Calif. 59.037 5.70% 1.50% 10.90% $899 2.00% 15.20%
25 Washington 59.011 1.50% 1.10% 5.40% $1,177 13.10% 4.80%
52 San Antonio 49.581 4.00% 0.60% 6.00% $751 -8.50% 2.70%
72 El Paso, Texas 41.289 2.30% 1.00% 8.70% $568 12.40% 1.60%

AFIRE – Close on a hot note!
What’s Hot – Assoc. of Foreign Investors in R.E.
27
AFIRE – U.S. tops globally & Ind’l R.E. tops (first time in a decade)
Port cities
move up in
rankings!

Thank You
K.C. Conway, MAI, CRE
Chief Economist | USA
Colliers International
www.colliers.com/us/kcconway

29

Commercial Real Estate Market Update
February 4, 2014

HOUSTON’S BRAG BOOK 2013-2014 Headlines
• Houston, “The Best City In America” (BUSINESS INSIDER)
• The Highest Demand for Engineering Jobs in 2013 (MONSTER.COM)
• Best Cities for your Career in 2013 (PAYSCALE.COM)
• Houston Makes Top Five Lists For U.S., Global Real Estate Investment (AFIRE)
• Fastest Real GDP Growth Among Large MSA’S (THE BUREAU OF ECONOMIC ANALYSIS)
• Top Cities for Global Trade (GLOBAL TRADE)
• Largest Export Market in U.S. (U.S. DEPARTMENT OF COMMERCE, INTERNATIONAL TRADE ADMINISTRATION)

Industry Forecast of U.S. Tight-Oil Production

Organization for Economic Co-operation &
Development
OECD – 34 Developed Countries – Blue - 1.25 Billion People (18%)
Non – OECD - 5.85 Billion People
China – 1.34
India – 1.24
Africa - 1.0
Latin Am – 0.6
Russia – 0.14

Oil Consumption - 2010
19%
14%
19%
48%
U.S
EU
Other Developed
China, India,Undeveloped
U.S – 12 Barrels per Person per Year (300MM People)
China – 2 Barrels per Person (1,344MM People)
If people in China use 3 Barrels per person we need to cut our
consumption by 4 Barrels per person to stay even on demand.
Alternative Energy and more efficient consumption required

Projected Demand – Going UP
0
100
200
300
400
500
600
1990 2000 2010 2020 2030 2040
OECD
Non OECD
Quadrillion Btu
Non OECD –
56% Increase
Projected

Energy Sector Projected Employment
-
500,000
1,000,000
1,500,000
2,000,000
2,500,000
3,000,000
3,500,000
2013 2025
Source: IHS
• Competition for employees
will be fierce.
• Houston will be the largest
beneficiary of this boom.

HOUSTON OFFICE – 179.8M SF
HOUSTON OFFICE MARKET INDICATORS
YE 2012 YE 2013
CITYWIDE NET ABSORPTION (SF) 4.2M 2.9M
CITYWIDE AVERAGE VACANCY 14.5% 14.0%
CITYWIDE AVERAGE RENTAL RATE $24.25 $25.16
CLASS A RENTAL RATE
CBD $37.02 $38.16
SUBURBAN $28.20 $30.18
CLASS A VACANCY
CBD 9.8% 10.2%
SUBURBAN 11.4% 10.8%
At the close of Q4,
10.7M SF of new
office development
was under
construction, more
than any other U.S.
metro.


HOUSTON OFFICE – 179.8M SF
10.0%
11.0%
12.0%
13.0%
14.0%
15.0%
16.0%
$16.00
$18.00
$20.00
$22.00
$24.00
$26.00
$28.00
Houston Average Rent Houston Average Vacancy

HOUSTON OFFICE – 179.8M SF
Average Cap Rate (Yield) Average Price ($) Per SF
Sales by Total $ (mil)
0
1,000
2,000
3,000
4,000
5,000
6,000
Q4 '09 Q4 '10 Q4 '11 Q4 '12 Q4 '13
Rolling 12-mo. Total Quarterly Vol.
0
50
100
150
200
250
Q4 '09 Q4 '10 Q4 '11 Q4 '12 Q4 '13
Houston United States
4%
5%
6%
7%
8%
9%
10%
11%
12%
Q4 '09 Q4 '10 Q4 '11 Q4 '12 Q4 '13
Houston United States

HOUSTON INDUSTRIAL – 483.6M SF
HOUSTON INDUSTRIAL MARKET INDICATORS
YE 2012 YE 2013
CITYWIDE NET ABSORPTION (SF) 5.0M 7.0M
CITYWIDE AVERAGE VACANCY (%) 5.2% 5.2%
CITYWIDE AVERAGE RENTAL RATE ($) $5.77 $5.90
NEW SUPPLY DELIVERED (SF) 4.0M 8.0M
4Q UNDER CONSTRUCTION (SF) 2.5M 4.4M
8.0M SF of
new inventory
delivered in
2013, 4.6M SF
was spec
construction!

HOUSTON INDUSTRIAL – 483.6M SF
0.0%
1.0%
2.0%
3.0%
4.0%
5.0%
6.0%
7.0%
8.0%
$5.00
$5.20
$5.40
$5.60
$5.80
$6.00
$6.20
$6.40
Houston Average Rent Houston Average Vacancy

HOUSTON INDUSTRIAL – 483.6M SF
Sales by Total $ (mil)
$0
$200
$400
$600
$800
$1,000
$1,200
$1,400
$1,600
Q4 '09 Q4 '10 Q4 '11 Q4 '12 Q4 '13
Rolling 12-mo. Total Quarterly Vol.
Average Cap Rate (Yield) Average Price ($) Per SF
$0
$10
$20
$30
$40
$50
$60
$70
$80
Q4 '09 Q4 '10 Q4 '11 Q4 '12 Q4 '13
Houston United States
2%3%4%5%6%7%8%9%
10%11%12%
Q4 '09 Q4 '10 Q4 '11 Q4 '12 Q4 '13
Houston United States

HOUSTON RETAIL MARKET INDICATORS
YE 2012 YE 2013
CITYWIDE NET ABSORPTION (SF) 1.2M 3.0M
CITYWIDE AVERAGE VACANCY (%) 7.3% 6.6%
CITYWIDE AVERAGE RENTAL RATE ($) Statistically Irrelevant
NEW SUPPLY DELIVERED (SF) 1.1K 880K
4Q UNDER CONSTRUCTION (SF) 1.1M 947K
HOUSTON RETAIL – 264.7M SF
Houston’s Strong
Economy Helps
Push Retail
Vacancy Rate to
Historic Low

HOUSTON RETAIL – 264.7M SF

HOUSTON RETAIL – 264.7M SF
Sales by Total $ (mil)
0
200
400
600
800
1,000
1,200
1,400
1,600
1,800
Q4 '09 Q4 '10 Q4 '11 Q4 '12 Q4 '13
Rolling 12-mo. Total Quarterly Vol.
Average Cap Rate (Yield) Average Price ($) Per SF
0
50
100
150
200
Q4 '09 Q4 '10 Q4 '11 Q4 '12 Q4 '13
Houston United States
4%
5%
6%
7%
8%
9%
10%
11%
12%
Q4 '09 Q4 '10 Q4 '11 Q4 '12 Q4 '13
Houston United States

HOUSTON MULTI-FAMILY – 574.5K Units
HOUSTON MULTI-FAMILY MARKET INDICATORS
YE 2012 YE 2013
UNITS ABSORBED 14,664 16,516
CITYWIDE AVERAGE VACANCY (%) 10.6% 9.5%
CITYWIDE AVERAGE RENTAL RATE ($) $806 $857
UNITS DELIVERED 6,818 14,455
4Q UNDER CONSTRUCTION 2,831 20,479
The average
monthly rent amount
increased 6.0% in
2013 and is
expected to
increase 6.0% in
2014.

HOUSTON MULTI-FAMILY - 574.5K Units

HOUSTON MULTI-FAMILY – 574.5K Units
Average Cap Rate (Yield) Average Price ($) Per Unit
Sales by Total $ (mil)
0
500
1,000
1,500
2,000
2,500
3,000
3,500
4,000
4,500
5,000
Q4 '09 Q4 '10 Q4 '11 Q4 '12 Q4 '13
Rolling 12-mo. Total Quarterly Vol.
0
20,000
40,000
60,000
80,000
100,000
120,000
Q4 '09 Q4 '10 Q4 '11 Q4 '12 Q4 '13
Houston United States
4%
5%
6%
7%
8%
9%
10%
11%
12%
Q4 '09 Q4 '10 Q4 '11 Q4 '12 Q4 '13
Houston United States

HOUSTON HOTEL MARKET INDICATORS
YE 2012 YE 2013
TOTAL UNITS 74,630 75,837
CITYWIDE AVERAGE VACANCY (%) 34.6% 30.2%
CITYWIDE AVERAGE DAILY RATE ($) $94 $101
UNITS DELIVERED 427 553
HOUSTON HOTEL – 75.8K Units

HOUSTON HOTEL – 75.8K Units

4%
5%
6%
7%
8%
9%
10%
11%
12%
Q4 '09 Q4 '10 Q4 '11 Q4 '12 Q4 '13
Houston United States
HOUSTON HOTEL – 75.8K Units
Average Price ($) Per Unit
$0
$50,000
$100,000
$150,000
$200,000
$250,000
Q4 '10 Q4 '10 Q4 '11 Q4 '12 Q4 '13
Houston United States
Average Cap Rate (Yield)
Sales by Total $ (mil)
0
100
200
300
400
500
600
700
800
900
1,000
Q4 '10 Q4 '10 Q4 '11 Q4 '12 Q4 '13
Rolling 12-mo. Total Quarterly Vol.

2014 CONSTRUCTION COMMENTS
• Consultants continue to aggressively pursue hiring with firms
reporting “best year ever”, again.
• General Contractors are hustling to keep up with demand.
Finding experienced personnel has magnified.
• We are still seeing the subcontractor community struggling to
keep up with bidding and construction workload.
• Construction costs have shown moderate increases, in spite of
notices of material volatility.
• Manufacturers are still not keeping significant inventory on
hand. Material lead times continue to drive schedules.

Thank You Hope you have a great 2014