Embed Size (px)
Citation preview

Greater Cleveland Suburbs
1Q, 2016 YTD HOME SALES REPORT
SPRING 2016
EDITION
N

Greater Cleveland Suburbs
1Q, 2016 YTD HOME SALES REPORT FOR SELLERS, OWNERS, & HOME BUYERS
SPRING 2016
EDITION
NBy Lisa Humenik, Realtor - RE/MAX Crossroads
Facebook.com/AmazingNortheastOhioHomes
Amazing
NortheastOhioMarketReport.com

Crossroads Properties
Lisa Humenik
About the Author:
LISA HUMENIK, Realtor®, RE/MAX Crossroads
Lisa Humenik is a real estate professional (REALTOR) at RE/MAX Crossroads
Properties helping clients buy and/or sell their home and find the perfect new
place or investment to meet their needs. Her clients include residential home
sellers, investors, and new and move-up buyers. Home sellers enjoy state-of-the-art
marketing services to assist them in the sale of their home including internet,
video, social media, print, and mobile marketing to expose their home to the
most buyers. Lisa’s Facebook fan page, AmazingNortheastOhioHomes, has over
1,200 fans.
Lisa has been practicing real estate for over ten years and sells over 50 homes per
year. She also holds a BBA in Marketing and Quantitative Business Analysis from
Cleveland State University. If you have any questions regarding this report, or are
interested in selling your home, Lisa can be reached at (440)476-4959 (or via email
at [email protected]).
RE/MAX Crossroads

CONTENTS
Lisa Humenik, RE/MAX Crossroads * (440)476-4959* AmazingNortheastOhioHomes.com
1. NATIONAL HOUSING MARKET SUMMARY
2. NORTHEAST OHIO MARKET TRENDS & DATA
Home Prices
Homes Sold
Homes for Sale & New Listings
Market Inventory
REO & Short Sale Trends
Market Data for Top Selling Suburbs
3. MORTGAGE RATE TRENDS
4. SELLING A HOME IN 2016
5. REASONS TO BUY A HOME IN 2016
6. HOW TO INCREASE YOUR SALES PRICE
7. TOP HOME MARKETING STRATEGIES FOR 2016
APPENDIX
Cuyahoga County Market Summary
This report covers Single Family home sales in the Greater Cleveland area real
estate market (Cuyahoga County). Data for Medina and Lorain Counties are
shown in the Appendix. Specific data is available for any local suburb on
request.
Lisa Humenik, RE/MAX Crossroads * (440)476-4959* AmazingNortheastOhioHomes.com
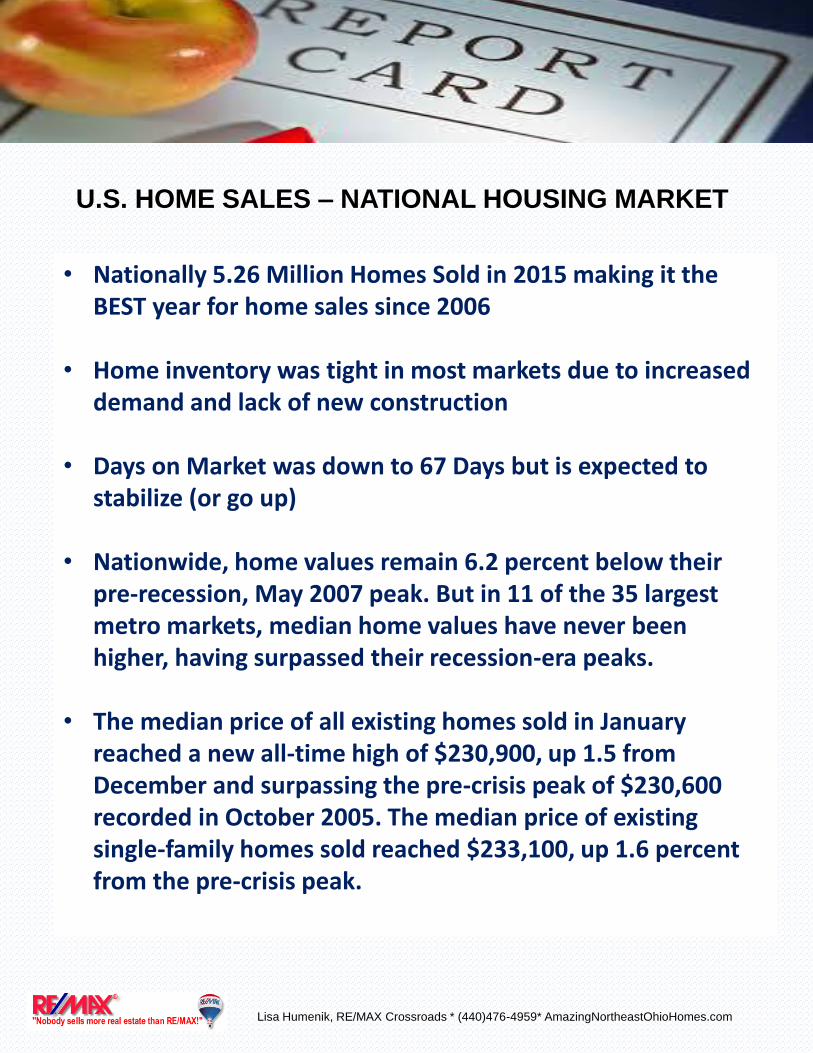
U.S. HOME SALES – NATIONAL HOUSING MARKET
• Nationally 5.26 Million Homes Sold in 2015 making it the BEST year for home sales since 2006
• Home inventory was tight in most markets due to increased demand and lack of new construction
• Days on Market was down to 67 Days but is expected to stabilize (or go up)
• Nationwide, home values remain 6.2 percent below their pre-recession, May 2007 peak. But in 11 of the 35 largest metro markets, median home values have never been higher, having surpassed their recession-era peaks.
• The median price of all existing homes sold in January reached a new all-time high of $230,900, up 1.5 from December and surpassing the pre-crisis peak of $230,600 recorded in October 2005. The median price of existing single-family homes sold reached $233,100, up 1.6 percent from the pre-crisis peak.
Lisa Humenik, RE/MAX Crossroads * (440)476-4959* AmazingNortheastOhioHomes.com
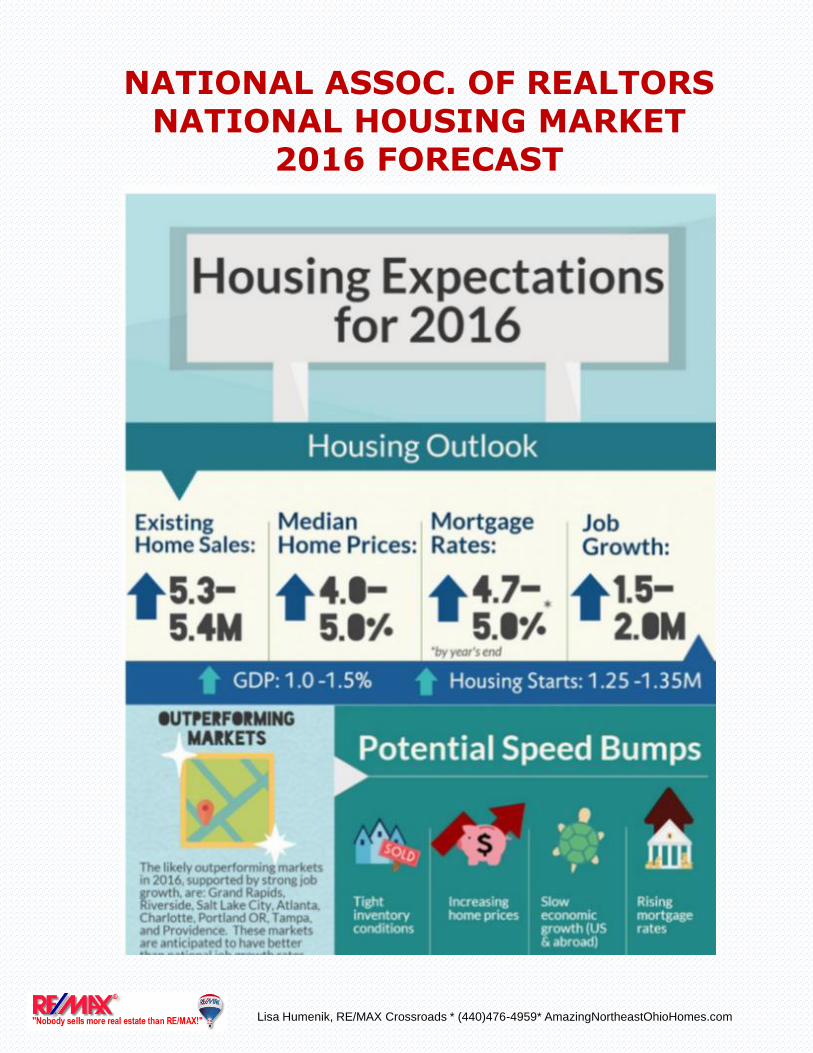
NATIONAL ASSOC. OF REALTORSNATIONAL HOUSING MARKET
2016 FORECAST


2016 REAL ESTATE HOUSING TRENDS TO WATCH
Lisa Humenik, RE/MAX Crossroads * (440)476-4959* AmazingNortheastOhioHomes.com
In 2015 it was the strongest year for the housing market since it all but collapsed in 2007. Most
national real estate experts predict that these trends will continue through 2016. With
unemployment steadily declining and consumer confidence still up, people are ready to trade
up for a bigger home and first time home buyers settle into their very first home.
Here are several important trends:
1. It’s becoming more affordable to Buy than Rent - Rent prices have been soaring
across the U.S., and that trend is expected to continue. Vacancy rates are at low levels, as
would-be buyers over the last few years have opted to rent long-term instead of buy. Landlords
and property owners can push the rent up—often to prices that are higher than a mortgage
would cost.
2. Quality Home Inventory is on the rise – There is an increasing number of quality
homes for sale. There are fewer distressed properties on the market, and at the same time
single-family home median sales are expected to continue to climb. This year, buyers will have
a large inventory of quality homes to choose from.
3. The Millennials are coming! - Millennials are officially the largest generation in the U.S.
labor force, and many experts predict that this will be the year that a good portion of them
invest in real estate. In fact, Jonathan Smoke, chief economist for Realtor.com, predicts that
Millennials will buy one out of three homes in 2016, up slightly from last year. Demand for for-
sale housing will grow and will continue to be dominated by older millennials, aged 25 to 34.
This demographic has the potential to claim a third of home sales in 2016 and represent 2
million home purchases.
4. Mortgage rates are likely to increase- In December, the Federal Reserve raised
interest rates, and that is expected to boost mortgage rates. That, of course, will increase
monthly mortgage payments and affect debt-to-income ratio, which will make it harder for
some people, specifically first-time buyers, to afford homes.
5. Normal Price Appreciation -More than 100 economic and housing experts in the latest
Zillow Home Price Expectations Survey pinned home value growth at about 3.5 percent in 2016.

NORTHEAST OHIO REAL HOME SALES TRENDS
Lisa Humenik, RE/MAX Crossroads * (440)476-4959* AmazingNortheastOhioHomes.com
During 2015, the number of home sales increased by 10% throughout the Cuyahoga County suburbs with the past quarter prices averaging 8% higher than the same period last year. In 2015, the Southwest suburbs with the strongest price gains were Berea (+23%), Parma (+11%), and Strongsville (+8.5%).
The Zillow 2016 forecast for the Cleveland Metro area is a 2.8% increase in home values and continued sales growth. In several suburbs there is a Seller’s market which is increasing prices and drastically decreasing market time to sell.
The number of days it takes to sell a home has decreased 6% in the Southwest suburbs (above) to 98 days (from 104 in 2014). In the past five years, days on market peaked at 144 days in 2011, so we are seeing homes sell significantly FASTER! With low interest rates and rising prices, it is a great time to sell. So, if you list your home, be ready to get moving!
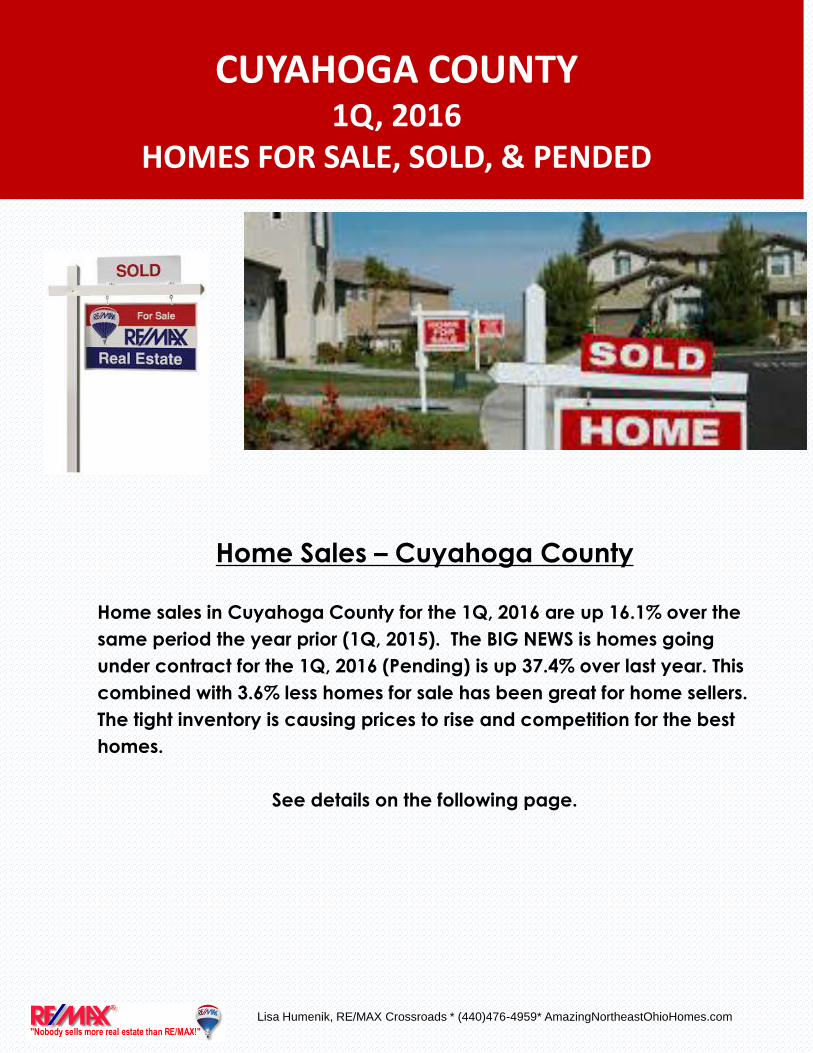
Home Sales – Cuyahoga County
Home sales in Cuyahoga County for the 1Q, 2016 are up 16.1% over the
same period the year prior (1Q, 2015). The BIG NEWS is homes going
under contract for the 1Q, 2016 (Pending) is up 37.4% over last year. This
combined with 3.6% less homes for sale has been great for home sellers.
The tight inventory is causing prices to rise and competition for the best
homes.
See details on the following page.
Lisa Humenik, RE/MAX Crossroads * (440)476-4959* AmazingNortheastOhioHomes.com
CUYAHOGA COUNTY1Q, 2016
HOMES FOR SALE, SOLD, & PENDED

Facts and TrendsTM - Published April 2016*
Location: CUYAHOGA COUNTY
Property Types: Single Family Homes - All Properties - All Properties
Price Range: $0 - No Limit SQFT Range: 0 - No Limit
Bedrooms: 0 - No Limit Full Baths: 0 - No Limit
Half Baths: 0 - No Limit Year Built: 0 - No Limit
Lisa HumenikCell Phone: (440)476-4959
Email: [email protected]
http://lisahumenik.com
2007002829
Number of Homes For Sale vs. Sold vs. Pended (Jan. 2015 - Mar. 2016) Prepared for you by: Lisa Humenik, RE/MAXCrossroads
Curnt vs. Prev Month Curnt vs. Same Month 1 Yr Ago Curnt vs. Same Qtr 1 Yr Ago TODAY STATS
Mar. 16 Feb. 16 % Change Mar. 16 Mar. 15 % ChangeJan. 16 to
Mar. 16Jan. 15 to
Mar. 15 % Change4/1/2016 -4/26/2016
3/1/2016 -3/26/2016 % Change
For Sale 4158 4171 -0.3% 4158 4359 -4.6% 12625 13096 -3.6% 4367 4307 1.4%
Sold 979 834 17.4% 979 907 7.9% 2553 2199 16.1% 782 797 -1.9%
Pended 1849 1149 60.9% 1849 1244 48.6% 3916 2851 37.4% 1701 1313 29.6%
March 2016 is a Neutral market**
Home For Sale in March 2016 is 4158 units. It is down 0.3% compared to the last month and down 4.6% compared to the last year.Home Closed in March 2016 is 979 units. It is up 17.4% compared to the last month and up 7.9% compared to the last year.Home Placed under Contract in March 2016 is 1849 units. It is up 60.9% compared to the last month and up 48.6% compared to the last year.
**Buyer's market: more than 6 months of inventory based on closed sales. Seller's market: less than 3 months of inventory based on closed sales. Neutral market: 3 - 6 months ofinventory based on closed sales.
All reports are published April 2016, based on data available at the end of March 2016, except for the today stats. All reports presented are based on data supplied by NEOHREX. NEOHREX does not guarantee or is not in anyway responsible for its accuracy.Data maintained by NEOHREX may not reflect all real estate activities in the market. Information deemed reliable but not guaranteed.
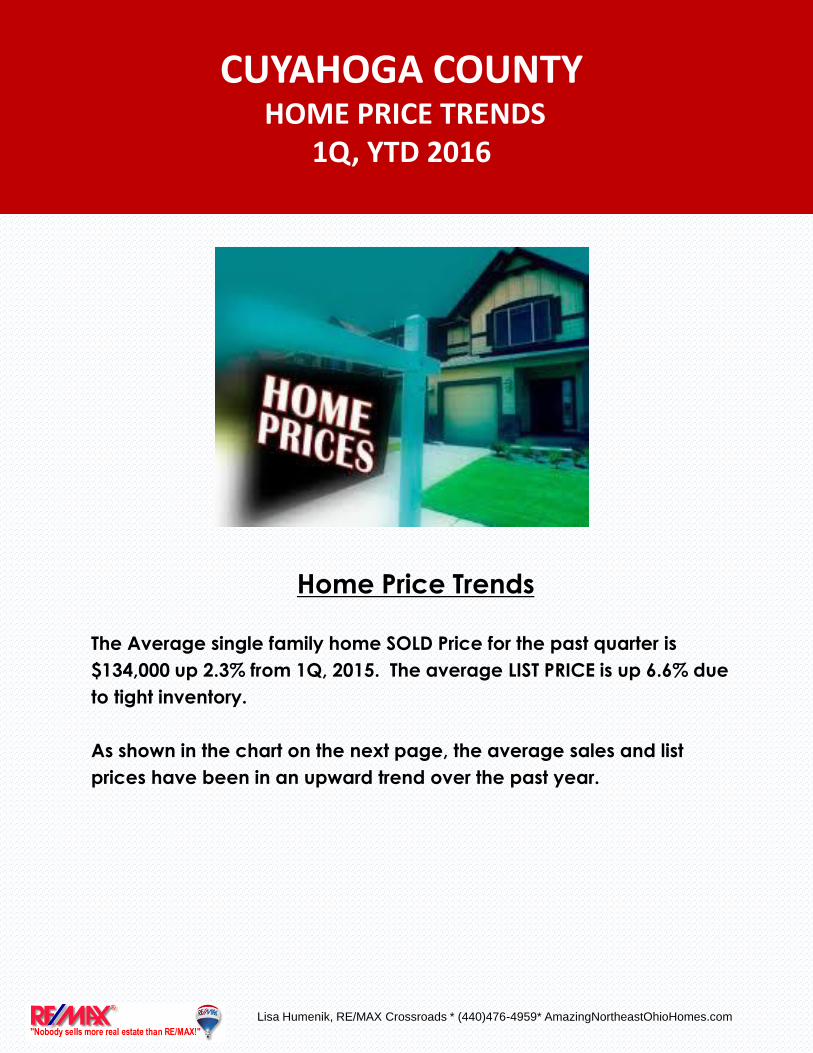
Home Price Trends
The Average single family home SOLD Price for the past quarter is
$134,000 up 2.3% from 1Q, 2015. The average LIST PRICE is up 6.6% due
to tight inventory.
As shown in the chart on the next page, the average sales and list
prices have been in an upward trend over the past year.
CUYAHOGA COUNTYHOME PRICE TRENDS
1Q, YTD 2016
Lisa Humenik, RE/MAX Crossroads * (440)476-4959* AmazingNortheastOhioHomes.com

Facts and TrendsTM - Published April 2016*
Location: CUYAHOGA COUNTY
Property Types: Single Family Homes - All Properties - All Properties
Price Range: $0 - No Limit SQFT Range: 0 - No Limit
Bedrooms: 0 - No Limit Full Baths: 0 - No Limit
Half Baths: 0 - No Limit Year Built: 0 - No Limit
Lisa HumenikCell Phone: (440)476-4959
Email: [email protected]
http://lisahumenik.com
2007002829
Average Price of For Sale and Sold (Jan. 2015 - Mar. 2016) Prepared for you by: Lisa Humenik, RE/MAXCrossroads
Curnt vs. Prev Month Curnt vs. Same Month 1 Yr Ago Curnt vs. Same Qtr 1 Yr Ago TODAY STATS
Mar. 16 Feb. 16 % Change Mar. 16 Mar. 15 % ChangeJan. 16 to
Mar. 16Jan. 15 to
Mar. 15 % Change4/1/2016 -4/26/2016
3/1/2016 -3/26/2016 % Change
Avg. ActivePrice 222 214 3.7% 222 203 9.4% 211 198 6.6% 225 221 1.8%
Avg. SoldPrice 135 124 8.9% 135 147 -8.2% 134 131 2.3% 148 131 13%
March 2016 Average For Sale Price is Appreciating**
Average For Sale Price (in thousand) in March 2016 is $222. It is up 3.7% compared to the last month and up 9.4% compared to the last year.
March 2016 Average Sold Price is Neutral**
Average Sold Price (in thousand) in March 2016 is $135. It is up 8.9% compared to the last month and down 8.2% compared to the last year.
**Based on 6 month trend - Appreciating/Depreciating/Neutral.
All reports are published April 2016, based on data available at the end of March 2016, except for the today stats. All reports presented are based on data supplied by NEOHREX. NEOHREX does not guarantee or is not in anyway responsible for its accuracy.Data maintained by NEOHREX may not reflect all real estate activities in the market. Information deemed reliable but not guaranteed.

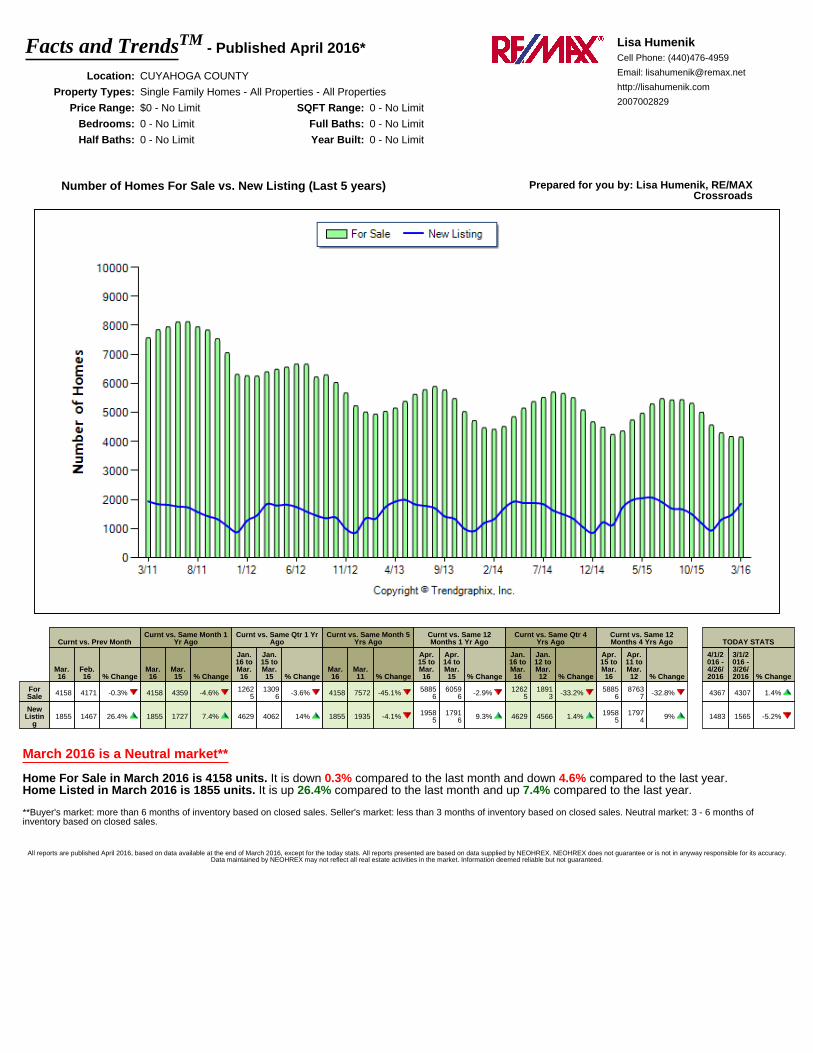
HOMES FOR SALE & NEW LISTINGS - TRENDS
The number of Homes for Sale has been declining over the past five years creating a
BIG supply problem and creating SELLER’S markets in many suburbs due to tight
inventory levels. The market inventory peaked in Summer 2011 with over 8,900
homes or sale – today’s inventory is down 45% from that time.
Today’s home inventory is at well below normal levels (sometime swaying to a
seller’s market in some suburbs). New listings for 1Q, 2016 are starting to trend up
at 14% higher from the same period last year. Listing inventory is expected to
increase this year due to favorable market conditions.
Lisa Humenik, RE/MAX Crossroads * (440)476-4959* AmazingNortheastOhioHomes.com
CUYAHOGA COUNTYHOMES FOR SALE & NEW LISTINGS
PAST 5 YEARS
Facts and TrendsTM - Published April 2016*
Location: CUYAHOGA COUNTY
Property Types: Single Family Homes - All Properties - All Properties
Price Range: $0 - No Limit SQFT Range: 0 - No Limit
Bedrooms: 0 - No Limit Full Baths: 0 - No Limit
Half Baths: 0 - No Limit Year Built: 0 - No Limit
Lisa HumenikCell Phone: (440)476-4959
Email: [email protected]
http://lisahumenik.com
2007002829
Number of Homes For Sale vs. New Listing (Last 5 years) Prepared for you by: Lisa Humenik, RE/MAXCrossroads
Curnt vs. Prev MonthCurnt vs. Same Month 1
Yr AgoCurnt vs. Same Qtr 1 Yr
AgoCurnt vs. Same Month 5
Yrs AgoCurnt vs. Same 12Months 1 Yr Ago
Curnt vs. Same Qtr 4Yrs Ago
Curnt vs. Same 12Months 4 Yrs Ago TODAY STATS
Mar.16
Feb.16 % Change
Mar.16
Mar.15 % Change
Jan.16 toMar.16
Jan.15 toMar.15 % Change
Mar.16
Mar.11 % Change
Apr.15 toMar.16
Apr.14 toMar.15 % Change
Jan.16 toMar.16
Jan.12 toMar.12 % Change
Apr.15 toMar.16
Apr.11 toMar.12 % Change
4/1/2016 -4/26/2016
3/1/2016 -3/26/2016 % Change
ForSale 4158 4171 -0.3% 4158 4359 -4.6% 1262
51309
6 -3.6% 4158 7572 -45.1% 58856
60596 -2.9% 1262
51891
3 -33.2% 58856
87637 -32.8% 4367 4307 1.4%
NewListin
g1855 1467 26.4% 1855 1727 7.4% 4629 4062 14% 1855 1935 -4.1% 1958
51791
6 9.3% 4629 4566 1.4% 19585
17974 9% 1483 1565 -5.2%
March 2016 is a Neutral market**
Home For Sale in March 2016 is 4158 units. It is down 0.3% compared to the last month and down 4.6% compared to the last year.Home Listed in March 2016 is 1855 units. It is up 26.4% compared to the last month and up 7.4% compared to the last year.
**Buyer's market: more than 6 months of inventory based on closed sales. Seller's market: less than 3 months of inventory based on closed sales. Neutral market: 3 - 6 months ofinventory based on closed sales.
All reports are published April 2016, based on data available at the end of March 2016, except for the today stats. All reports presented are based on data supplied by NEOHREX. NEOHREX does not guarantee or is not in anyway responsible for its accuracy.Data maintained by NEOHREX may not reflect all real estate activities in the market. Information deemed reliable but not guaranteed.
Current Market Inventory at 5 Months Supply /
Homes for Sale 5 year lows
Months on Inventory is defined as how many months it would to sell all the
current homes available for sale. Market inventory peaked in early 2011 but is
now back to normal levels. The current market inventory is at 4.2 months which
is a Balanced to Seller’s Market. However, some suburbs are still Buyer’s Markets
and some Seller’s markets.
Due to the lack of supply, we are seeing very tight inventory in several suburbs
(see Suburb Comparison Chart). In March 2016, 23.5% of homes on the market
were sold and 44.5% went under contract.
All real estate is LOCAL - Months of Inventory for any suburb is available upon request as the numbers may differ considerably.
Lisa Humenik, RE/MAX Crossroads * (440)476-4959* AmazingNortheastOhioHomes.com
CUYAHOGA COUNTYMARKET INVENTORY
#Months Supply of Homes

Facts and TrendsTM - Published April 2016*
Location: CUYAHOGA COUNTY
Property Types: Single Family Homes - All Properties - All Properties
Price Range: $0 - No Limit SQFT Range: 0 - No Limit
Bedrooms: 0 - No Limit Full Baths: 0 - No Limit
Half Baths: 0 - No Limit Year Built: 0 - No Limit
Lisa HumenikCell Phone: (440)476-4959
Email: [email protected]
http://lisahumenik.com
2007002829
Months of Inventory Based on Closed Sales (Last 5 years) Prepared for you by: Lisa Humenik, RE/MAXCrossroads
Curnt vs. Prev MonthCurnt vs. Same Month 1
Yr AgoCurnt vs. Same Qtr 1 Yr
AgoCurnt vs. Same Month 5
Yrs AgoCurnt vs. Same 12Months 1 Yr Ago
Curnt vs. Same Qtr 4Yrs Ago
Curnt vs. Same 12Months 4 Yrs Ago TODAY STATS
Mar.16
Feb.16 % Change
Mar.16
Mar.15 % Change
Jan.16 toMar.16
Jan.15 toMar.15 % Change
Mar.16
Mar.11 % Change
Apr.15 toMar.16
Apr.14 toMar.15 % Change
Jan.16 toMar.16
Jan.12 toMar.12 % Change
Apr.15 toMar.16
Apr.11 toMar.12 % Change
4/1/2016 -4/26/2016
3/1/2016 -3/26/2016 % Change
Months of
Inventory
(Closed
Sales)
4.2 5 -16% 4.2 4.8 -12.5% 4.9 6 -18.5% 4.2 11.3 -62.9% 4.6 5.3 -13.2% 4.9 10.4 -53% 4.6 10 -54.1% 5.6 5.4 3.7%
March 2016 is a Neutral market**
Months of Inventory based on Closed Sales in March 2016 is 4.2. It is down 16% compared to the last month and down 12.5% compared tothe last year.
**Buyer's market: more than 6 months of inventory based on closed sales. Seller's market: less than 3 months of inventory based on closed sales. Neutral market: 3 - 6 months ofinventory based on closed sales.
All reports are published April 2016, based on data available at the end of March 2016, except for the today stats. All reports presented are based on data supplied by NEOHREX. NEOHREX does not guarantee or is not in anyway responsible for its accuracy.Data maintained by NEOHREX may not reflect all real estate activities in the market. Information deemed reliable but not guaranteed.

WHAT IS YOUR HOME WORTH NOW?
Visit:
NortheastOhioHomeValuation.com
Sign-up for a FREE Home Value Estimate and Neighborhood Market Analysis
or
Call (440)476-4959.
Home values have been rising in many (but not all) Northeast Ohio suburbs, leaving some homeowners unsure of the current market value of their home and those in their neighborhood. Below is a new Quick Home Valuation Tool that cross-references your home to comparable sales in your neighborhood to estimate a price your home would sell for if it were to go on the MLS today. This information is used to give you a fair estimate of market value.
Lisa Humenik, RE/MAX Crossroads * (440)476-4959* AmazingNortheastOhioHomes.com
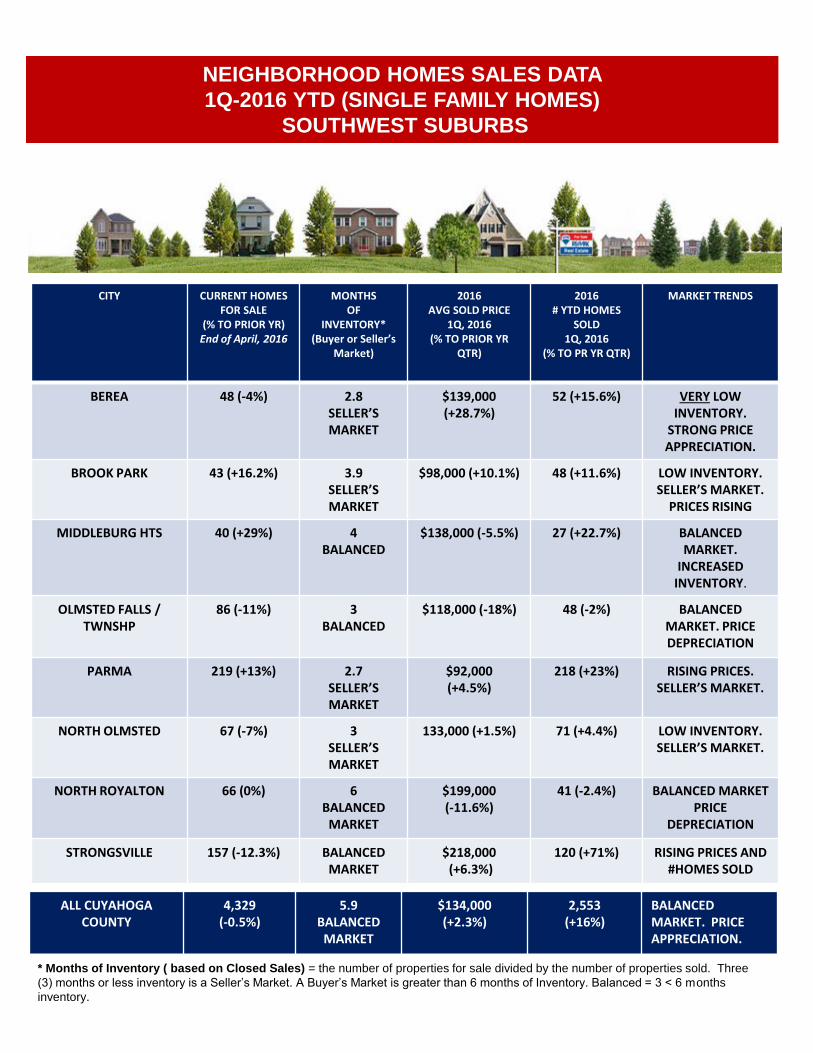
NEIGHBORHOOD HOMES SALES DATA
1Q-2016 YTD (SINGLE FAMILY HOMES)
SOUTHWEST SUBURBS
CITY CURRENT HOMES FOR SALE
(% TO PRIOR YR)End of April, 2016
MONTHS OF
INVENTORY*(Buyer or Seller’s
Market)
2016 AVG SOLD PRICE
1Q, 2016(% TO PRIOR YR
QTR)
2016 # YTD HOMES
SOLD 1Q, 2016
(% TO PR YR QTR)
MARKET TRENDS
BEREA 48 (-4%) 2.8SELLER’S MARKET
$139,000 (+28.7%)
52 (+15.6%) VERY LOW INVENTORY.
STRONG PRICE APPRECIATION.
BROOK PARK 43 (+16.2%) 3.9SELLER’S MARKET
$98,000 (+10.1%) 48 (+11.6%) LOW INVENTORY. SELLER’S MARKET.
PRICES RISING
MIDDLEBURG HTS 40 (+29%) 4BALANCED
$138,000 (-5.5%) 27 (+22.7%) BALANCEDMARKET.
INCREASED INVENTORY.
OLMSTED FALLS / TWNSHP
86 (-11%) 3BALANCED
$118,000 (-18%) 48 (-2%) BALANCED MARKET. PRICE DEPRECIATION
PARMA 219 (+13%) 2.7SELLER’S MARKET
$92,000 (+4.5%)
218 (+23%) RISING PRICES. SELLER’S MARKET.
NORTH OLMSTED 67 (-7%) 3SELLER’SMARKET
133,000 (+1.5%) 71 (+4.4%) LOW INVENTORY. SELLER’S MARKET.
NORTH ROYALTON 66 (0%) 6BALANCED
MARKET
$199,000(-11.6%)
41 (-2.4%) BALANCED MARKETPRICE
DEPRECIATION
STRONGSVILLE 157 (-12.3%) BALANCEDMARKET
$218,000(+6.3%)
120 (+71%) RISING PRICES AND #HOMES SOLD
ALL CUYAHOGA COUNTY
4,329 (-0.5%)
5.9BALANCED
MARKET
$134,000(+2.3%)
2,553 (+16%)
BALANCEDMARKET. PRICE APPRECIATION.
* Months of Inventory ( based on Closed Sales) = the number of properties for sale divided by the number of properties sold. Three
(3) months or less inventory is a Seller’s Market. A Buyer’s Market is greater than 6 months of Inventory. Balanced = 3 < 6 months
inventory.

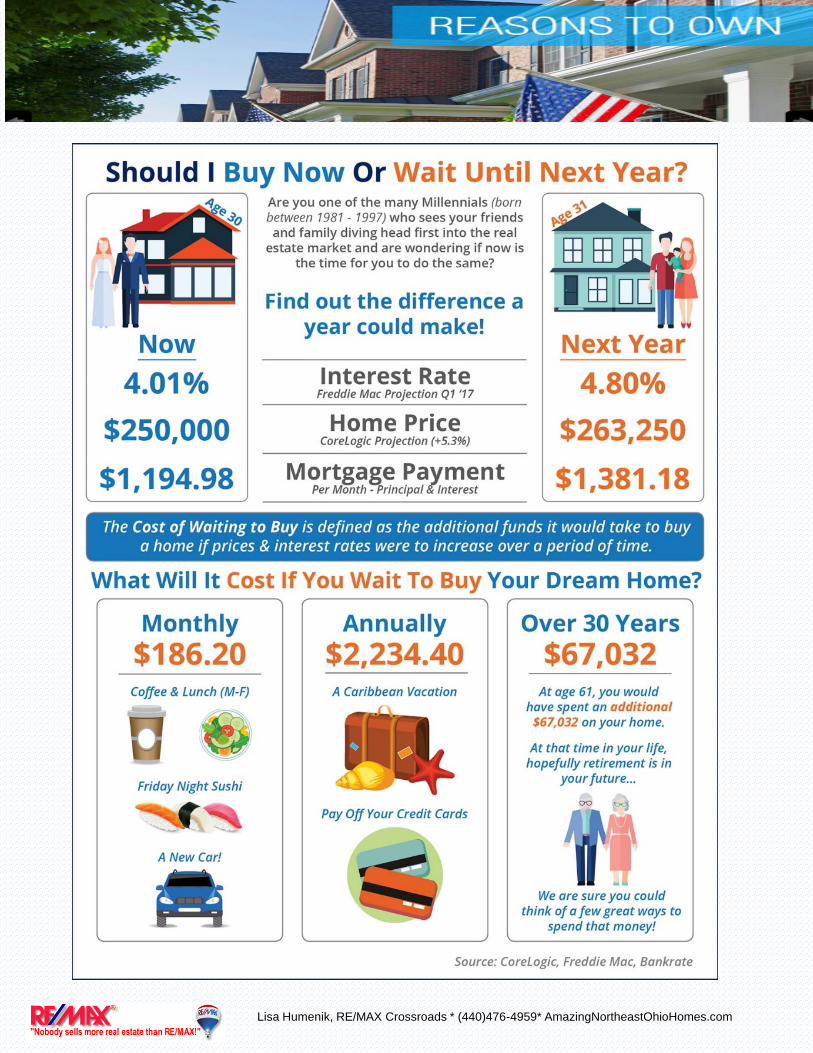
WHERE ARE MORTGAGE INTEREST RATES HEADED?
Interest rates are projected to increase steadily over the course of 2016. The experts predict that home prices will appreciate over the course of 2016. If both predictions become reality, families could wind up paying considerably more for their home by waiting. Mortgage rates are expected to gradually increase to slightly below 5% by the end of the year but remain at historically low levels. This year is a great year to make a move because of rising resale values and affordability to purchase.
Lisa Humenik, RE/MAX Crossroads * (440)476-4959* AmazingNortheastOhioHomes.com

MORTGAGE RATES OVER TIME
Today’s average mortgage rate is 4.04% and the average House Payment is $959. Today’s
mortgage rates are a bargain as compared to what the have averaged in past years.
Lisa Humenik, RE/MAX Crossroads * (440)476-4959* AmazingNortheastOhioHomes.com

Crossroads Properties
WHERE ARE HOME PRICESHEADING IN THE NEXT FIVE
YEARS?
Lisa Humenik, RE/MAX Crossroads * (440)476-4959* AmazingNortheastOhioHomes.com

REASONS NOW IS A GOOD TIME FOR SELLERSAs the temperature rises, buyers are coming out ready to purchase their dream home. The spring is a
great time to list your home for sale. Here are five reasons supporting that.
1. Demand is StrongFoot traffic refers to the number of people out actually physically looking at homes right now. The latest
foot traffic numbers show that there are more prospective purchasers currently looking at homes than at
any other time in the last 12 months which includes last spring’s buyers’ market. These buyers are ready,
willing and able to purchase… and are in the market right now! Take advantage of the buyer activity
currently in the market.
2. Less Competition Housing supply just dropped to 5 months, which is under the 6 months’ supply that is needed for a
normal housing market. This means, in many areas, there are not enough homes for sale to satisfy the
number of buyers in that market. This is good news for home prices. However, additional inventory is
about to come to market.
There is a pent-up desire for many homeowners to move as they were unable to sell over the last few
years because of a negative equity situation. Homeowners are now seeing a return to positive equity as
real estate values have increased over the last two years. Many of these homes will be coming to the
market in the near future. The choices buyers have will continue to increase.
3. The Process Will Be QuickerBanks are requiring more and more paperwork before approving a mortgage. As the market heats up,
banks will be inundated with loan inquiries causing closing timelines to lengthen. Selling now will make
the process quicker & simpler.
4. There Will Never Be a Better Time to Move-UpIf you are moving up to a larger, more expensive home, consider doing it now. Prices are projected to
appreciate by over 19.3% from now to 2019. If you are moving to a higher priced home, it will wind-up
costing you more in raw dollars (both in down payment and mortgage payment) if you wait. You can also
lock-in your 30 year housing expense with an interest rate near 4% right now. Rates are projected to
increase by about three quarters of a percent by the end of 2015.
5. It’s Time to Move On with Your Life Goals!Look at the reason you decided to sell in the first place and determine whether it is worth the RISK of
waiting as prices and rates are predicted to increase.
Lisa Humenik, RE/MAX Crossroads * (440)476-4959* AmazingNortheastOhioHomes.com

Lisa Humenik, RE/MAX Crossroads * (440)476-4959* AmazingNortheastOhioHomes.com
Lisa Humenik, RE/MAX Crossroads * (440)476-4959* AmazingNortheastOhioHomes.com

RENTS ARE AT ALL TIME HIGHS
Rents are High! - In many markets, rents are rising to unsustainable levels, reports the
National Association of Realtors (NAR). "In the past five years, a typical rent rose 15% while the
income of renters grew by only 11%.“. Today buying is 38% cheaper than renting nationwide, and
buying is cheaper than renting in all of the 100 largest metros. In the Cleveland & Akron metro
areas it is 58% cheaper to buy verses rent.
A great resource to compare what is a better choice for financially for a current renter is to visit
Trulia’s online “Rent vs. Buy” Calculator at:
http://www.trulia.com/rent_vs_buy/
Source: http://www.trulia.com/trends/category/rent-vs-buy-index/
Today buying a
home is 38%
cheaper than
renting
nationwide, and
buying is
cheaper than
renting in all of
the 100 largest
metros. In the
Cleveland &
Akron metro
areas it is 58%
cheaper to buy
verses rent.
Lisa Humenik, RE/MAX Crossroads * (440)476-4959* AmazingNortheastOhioHomes.com

KEEPINGCURRENTMATTERS.COM 19

SELLING YOUR HOME?
HERE’S HOW TO INCREASE YOUR HOME SALES PRICE
Lisa Humenik, RE/MAX Crossroads * (440)476-4959* AmazingNortheastOhioHomes.com
Just by making some minor changes you can drastically improve the selling price of your home.
According to industry data and research from Consumer Reports, home sellers may be able to boost
the value of their home by an additional 12 percent with just a few smart pre-listing repairs and
improvements. The selling price impact is according to a new survey of 300 residential real estate
professionals by the Consumer Reports National Research Center. This information is valuable when
selling your home if you want to put a few extra dollars in your pocket. On a median, single-family
home priced at $205,000, that could be a potential gain of $24,600. On a more expensive home,
the profits will go many times higher.
This month is the start of the hot home selling season, so here is a summary of the highest return
improvements based on the data from the top industry experts and my experience working with
home sellers:
1. Clean up the Clutter – Cost range: $0
(DIY) to $2,500 (pro) – Potential return of 3 to
5%. The best advice here is, Start Packing!
Declutter and depersonalize. One of the best
ways to stage your home for someone else to
imagine living there is to get rid of your
personal stuff. Declutter books, pictures,
knickknacks, and anything else that is
exclusively you. Start removing excess
furniture and items from the walls and
furniture. Put away the extra decorations and
family pictures. Kitchen counters should only
have a few items out for all showings. Know
the “Rule of Three” – Knick knacks- such as
candles, books, lamps, etc – tend to look the
best when placed in a group of three.

HOW TO INCREASE YOUR HOME SALES PRICE
Lisa Humenik, RE/MAX Crossroads * (440)476-4959* AmazingNortheastOhioHomes.com
2. Focus on the Kitchen! - Cost range: $300 to $5,000 –
Potential Return 3 to 7%. Take it from the pros, the kitchen,
more than any other room, sells the home. Over 53 percent of
Realtors will tell you that the kitchen is among the most
important rooms of the home to have looking great before
selling and showing your home. If necessary, make upgrades to
the kitchen. This will depend largely on your budget and the
age and style of the home. New hardware can make a huge
difference for a reasonably small cost. Even small kitchen
improvements will go a long way when selling our home. Limit
counter top items to three – remove extra small appliances (i.e.
toasters, blenders, cookbooks, etc..). Consider removing extra
furnishings – free standing islands, kitchen trolleys and dining
hutches can close in a space. If you cannot remove these
pieces, ruthlessly edit the items displayed on or in them.
3. Create a Beautiful Bathroom Retreat – Cost
range: $300-1,000 – Potential return 2 to 3%. The 2nd most
important rooms for selling your home for the best price is
the bathrooms. First and foremost, make sure everything
is sparkling clean! Remove personal products (tuck away):
Get rid of your ‘stuff’. When selling, clear every surface
of all your day to day care products. Personal items
distracts buyers. Limit counter top decor to a hand towel
and pretty soap dispenser. Make it sparkle: Scrub the tiles
and grout, dust the lights, shine fixtures, and clean
everything. Second, spend a few dollars to get fresh
towels, rugs, and decorations that accent the bathroom
color scheme. New towel racks and shower curtains
should also be purchased if needed. Have your bathroom
look and smell like a spa retreat that any home buyer
would love to enjoy.

HOW TO INCREASE YOUR HOME SALES PRICE
Lisa Humenik, RE/MAX Crossroads * (440)476-4959* AmazingNortheastOhioHomes.com
4. Paint – Paint rooms (where needed) – Cost
range: $100 (DIY) to $1,000 (or more) by a Pro –
return 1 to 3% (or more). From my experience,
I would call paint “Money in a Can”! For very
minimal investment, you a huge return in
boosting your selling price and speed to an
offer. Paint walls in neutral tones. Real estate
experts will tell you to use certain paint colors
to inspire buyers to put in an offer, and often
suggest that sellers repaint their home in these
hues to create a blank canvas for optimal
staging. Four “go-to” Benjamin Moore colors
that work well include: Shaker Beige, Jackson
Tan, Linen White, and Mellow Yellow. (Most
paint stores can do color matches if you don’t
have a Benjamin Moore store near you.)
5. Exterior Fixes & Curb Appeal –Cost range: $150 to $7,500 – Potential
return: 2 to 5%. Now that spring has
sprung, it is a great time to get outside
and spruce up the yard. Put some mulch in
the front and clean up the winter yard
debris. If your home needs a power wash
or some paint touch-ups, now is the time.
As the weather gets warmer, put out some
flower pots and make the entry to your
home look welcoming. Many people
thinking of touring your home will do a
quick drive-by first, often deciding on the
spot if it is even worth a look inside.

HOW TO INCREASE YOUR HOME SALES PRICE
Lisa Humenik, RE/MAX Crossroads * (440)476-4959* AmazingNortheastOhioHomes.com
6. Make your Home “Sparkle” – Cost
range: $0-3,000 – Potential return – “Priceless”.
Clean everything and make it shine! Now’s the
time for a major cleaning from scrubbing floors,
cleaning the carpeting, closets, and more. Add
some aromatherapy to make your home look
and smell fabulous!
Spending a little extra time and a few
extra dollars is a very worthwhile endeavor
to get the best price for your home. Your
home will never look better than the day
your sell it! These extra efforts combined
with a professional marketing strategy
designed to bring in the most qualified
buyers for your home will make your home
selling process more enjoyable and
profitable than you thought it might be.

According to data from the National Association of Realtors, 89 percent of buyers use
online tools in their home searches. Rather than waiting for agents to send them listings,
they go online and tell the agents which homes they’d like to see. Here are the top
factors in a successful home online marketing strategy:
1. Professional Photography – “A Picture is Worth A Thousand Words”. Your first
home showing is online, so your home has to win the beauty contest. Great
photographs are probably the single most important piece of any online listing.
Wide-angle Lens Photography of your home is important to make the right first
impression.. It is imperative that your home shows better than others!
THINKING OF SELLING YOUR HOME?
TOP HOME MARKETING STRATEGIES NEEDED IN 2016
Standard Wide Angle
Lisa Humenik, RE/MAX Crossroads * (440)476-4959* AmazingNortheastOhioHomes.com

2. Social Media Marketing - To expand the reach of your home marketing, your
agent should take to social media sites like Facebook, Twitter, LinkedIn, and
Instagram. Paid social media promotion is a important element of a successful
marketing plan. Facebook is approaching Google as having the highest internet
traffic.
Sample promotions include:
- Facebook Fan Page and Realtor Group promotion
Facebook “Promoted Posts” of your home’s listing and Video to targeted home
buyers
- “Just Listed” Anouncement on agent’s Blog, Fan Page, and LinkedIn
- Posts to community SunNews webpages
- Twitter tweet of new listing
- Instagram photos shared on the web
Social proof and sharing by local homeowners and buyers creates a “BUZZ” around
your new listing and home video and can be a magnet to potential buyers.
TOP HOME MARKETING STRATEGIES NEEDED IN 2016
Lisa Humenik, RE/MAX Crossroads * (440)476-4959* AmazingNortheastOhioHomes.com

TOP HOME MARKETING STRATEGIES NEEDED IN 2016
3. Online Marketing – Vast online presence (especially as a promoted listing)
on the top sites. Most buyers use Zillow, Trulia, Realtor.com, Remax.com, or other
major portals to find the homes they want to see.
Sponsored promotion of your home and SEO on Google make sure more home
buyers see your home is for sale.
.
Lisa Humenik, RE/MAX Crossroads * (440)476-4959* AmazingNortheastOhioHomes.com

4. Video Marketing - A video of your home that is taken as a buyer would see your
home when walking thru is the latest tool in real estate home marketing. Buyers are
attracted to video and are much more likely to view the video as opposed to scroll
through screens of pictures of your home. Also, when a buyer calls to see your
home after seeing the video, they are already “pre-sold” and are more likely to be a
qualified buyer for your home. The best videos include narration, music and great
photography highlighting your home’s best features. Video really allows
homebuyers to create that emotional connection.
TOP HOME MARKETING STRATEGIES NEEDED IN 2016
Lisa Humenik, RE/MAX Crossroads * (440)476-4959* AmazingNortheastOhioHomes.com

TOP HOME MARKETING STRATEGIES NEEDED IN 2016
5. Mobile/Smartphone Presence - Younger buyers especially want to look
at listings on their smartphones, and apps that make it easier for them to
do. All the major portals have apps, as do some real estate brokerages.
Your home’s visual presentation on mobile is more important than ever.
Sellers need to make sure their listing looks great on a smartphone. Photos
should be taken with a high-resolution camera, because that’s what looks
best on mobile. Zillow reported that in January, nearly 600 million homes
were viewed on Zillow’s mobile app. That’s 223 homes per second.
6. Your Home’s Own Unique Website – A dedicated website for our
home will allow your video, pictures, description, and tons of other info to
be showcased in one place. Your home should have its own web address
(URL) which buyers can use to search for your home directly on the
internet, i.e. http://123YourAddress.com. Check out a example at
2883ForestLake.com.
These advanced marketing and home presentation strategies will bring
more buyers in the door and, as a result, a higher sales price. It is
imperative that these are incorporated into a professional home marketing
plan.
Lisa Humenik, RE/MAX Crossroads * (440)476-4959* AmazingNortheastOhioHomes.com

THINKING OF SELLING YOUR HOME?
If you are considering selling your home in 2016, check out my Smart Home Seller
Plan. The Smart Home Seller Plan is designed to offer clients the most state-of-the art marketing of their home to bring in the highest and best market offers in faster than average market time. In addition, light staging and professional photography will give the professional finishes needed to get top dollar.
The Northeast Ohio real estate market has improved quite a bit in the last year, but all real estate is local right down to your city and neighborhood. A professional pricing assessment of your home, light staging or improvements (if needed), and a highly targeted marketing plan will deliver the results you did not think possible. Plus, a 100% Happiness Guarantee. Contact Lisa Humenik, Realtor at RE/MAX Crossroads for a FREE Consultation today at (440) 476-4959 or Visit:
SmartHomeSellerPlan.com
Lisa Humenik, RE/MAX Crossroads * (440)476-4959* AmazingNortheastOhioHomes.com
Lisa Humenik
RE/MAX Crossroads
AmazingNortheastohioHomes.com
(440)476-4959
Facebook.com/AmazingNortheastOhioHomes