Embed Size (px)
Citation preview
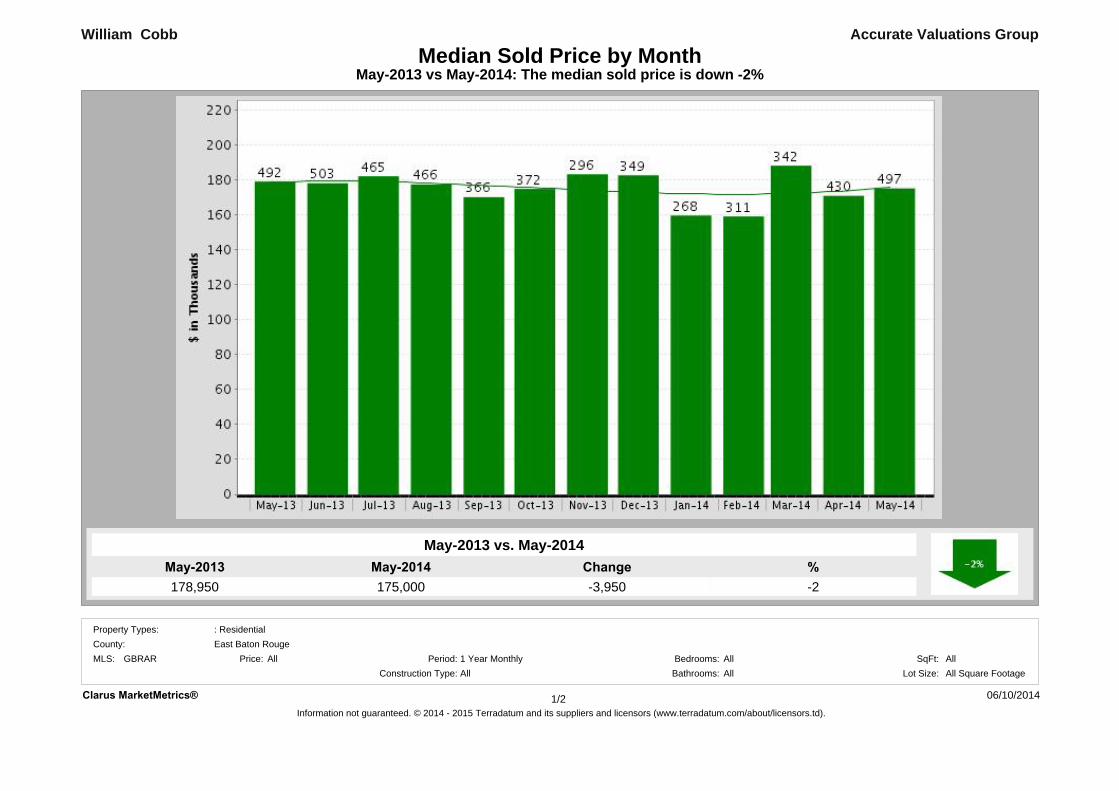
May-2014175,000
May-2013178,950
%-2
Change-3,950
May-2013 vs May-2014: The median sold price is down -2%Median Sold Price by Month
Accurate Valuations Group
May-2013 vs. May-2014
William Cobb
Clarus MarketMetrics® 06/10/2014Information not guaranteed. © 2014 - 2015 Terradatum and its suppliers and licensors (www.terradatum.com/about/licensors.td).
1/2
MLS: GBRAR Bedrooms:AllAll
Construction Type:All1 Year Monthly SqFt:
Bathrooms: Lot Size:All All Square FootagePeriod:All
County:Property Types: : Residential
East Baton RougePrice:
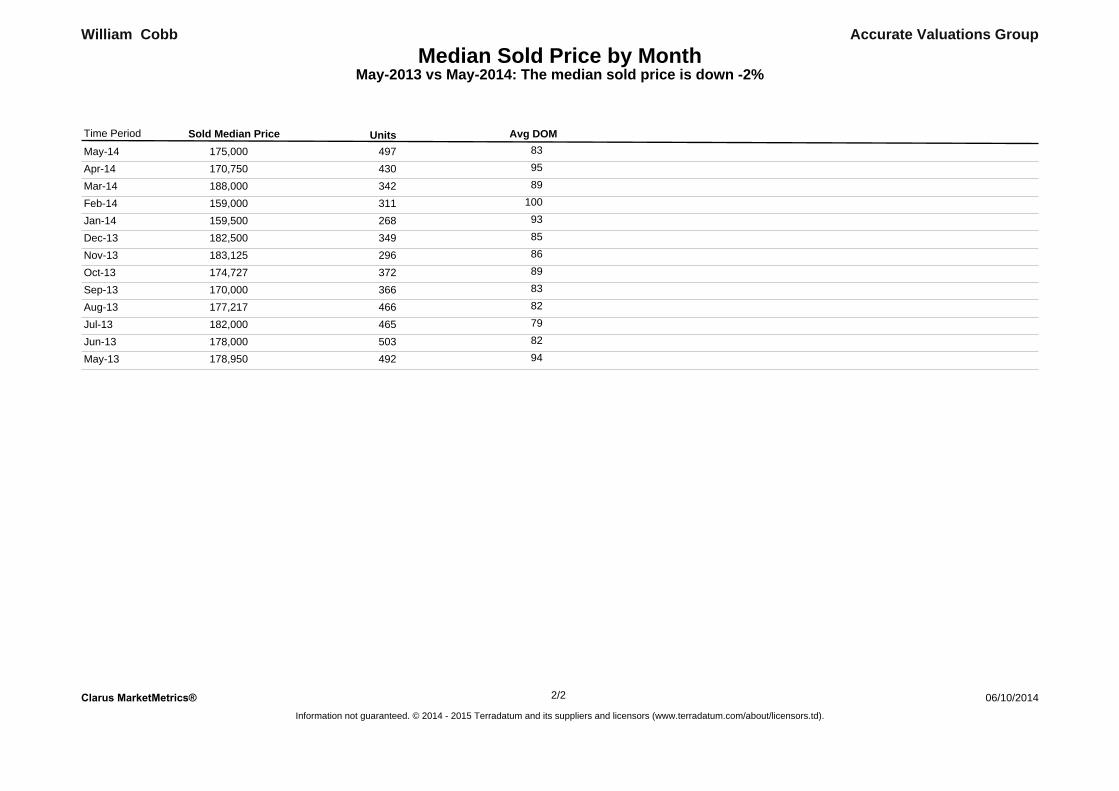
Median Sold Price by MonthMay-2013 vs May-2014: The median sold price is down -2%
Accurate Valuations GroupWilliam Cobb
Sold Median Price Units Avg DOMTime Period
May-14 175,000 497 83
Apr-14 170,750 430 95
Mar-14 188,000 342 89
Feb-14 159,000 311 100
Jan-14 159,500 268 93
Dec-13 182,500 349 85
Nov-13 183,125 296 86
Oct-13 174,727 372 89
Sep-13 170,000 366 83
Aug-13 177,217 466 82
Jul-13 182,000 465 79
Jun-13 178,000 503 82
May-13 178,950 492 94
Clarus MarketMetrics® 06/10/2014Information not guaranteed. © 2014 - 2015 Terradatum and its suppliers and licensors (www.terradatum.com/about/licensors.td).
22/

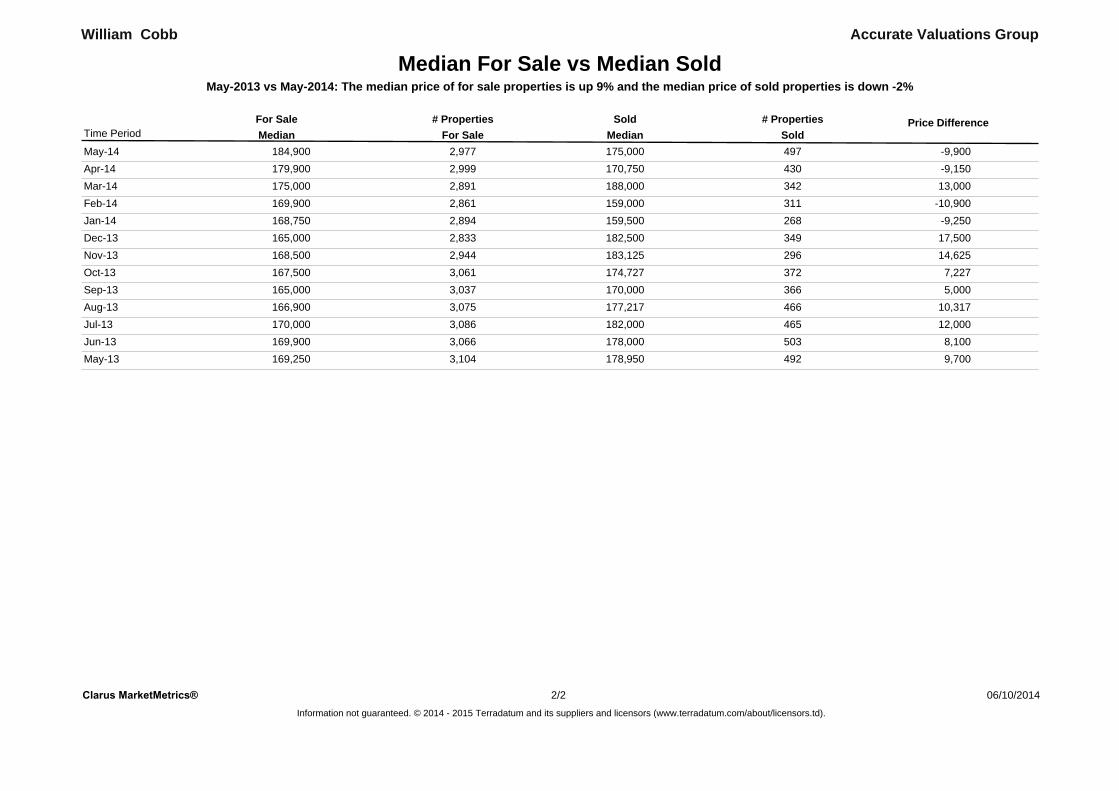
May-2013 vs May-2014: The median price of for sale properties is up 9% and the median price of sold properties is down -2%
Accurate Valuations Group
May-2013 vs. May-2014
169,250 9
William Cobb
184,900May-2014
Median For Sale vs Median Sold
ChangeMay-2013 %15,650
May-2013 May-2014 %178,950 -2
May-2013 vs. May-2014
175,000Change-3,950
Clarus MarketMetrics® 06/10/2014Information not guaranteed. © 2014 - 2015 Terradatum and its suppliers and licensors (www.terradatum.com/about/licensors.td).
1/2
MLS: GBRAR Bedrooms:AllAll
Construction Type:All1 Year Monthly SqFt:
Bathrooms: Lot Size:All All Square FootagePeriod:All
County:Property Types: : Residential
East Baton RougePrice:
Median For Sale vs Median SoldMay-2013 vs May-2014: The median price of for sale properties is up 9% and the median price of sold properties is down -2%
Accurate Valuations GroupWilliam Cobb
For SaleMedian SoldMedianFor Sale # Properties # PropertiesSold Price Difference
Time Period
May-14 2,977 497184,900 175,000 -9,900Apr-14 2,999 430179,900 170,750 -9,150Mar-14 2,891 342175,000 188,000 13,000Feb-14 2,861 311169,900 159,000 -10,900Jan-14 2,894 268168,750 159,500 -9,250Dec-13 2,833 349165,000 182,500 17,500Nov-13 2,944 296168,500 183,125 14,625Oct-13 3,061 372167,500 174,727 7,227Sep-13 3,037 366165,000 170,000 5,000Aug-13 3,075 466166,900 177,217 10,317Jul-13 3,086 465170,000 182,000 12,000Jun-13 3,066 503169,900 178,000 8,100May-13 3,104 492169,250 178,950 9,700
Clarus MarketMetrics®Information not guaranteed. © 2014 - 2015 Terradatum and its suppliers and licensors (www.terradatum.com/about/licensors.td).
06/10/201422/
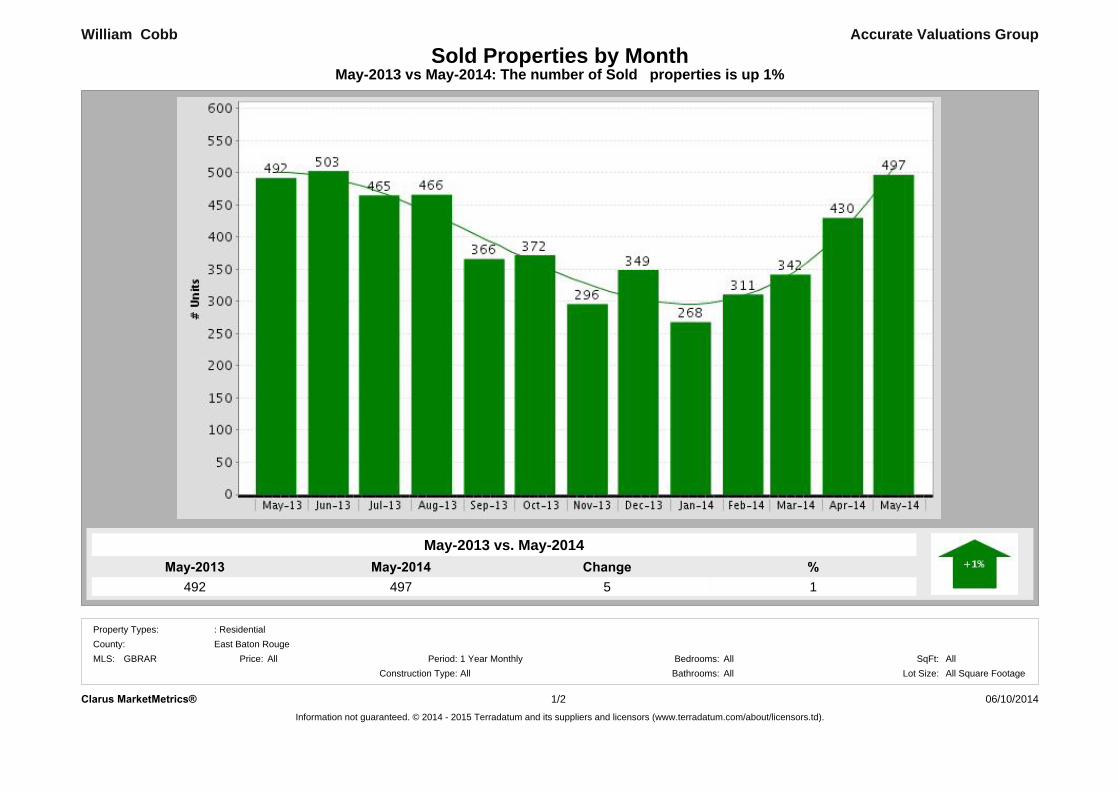
May-2014497
May-2013492
%1
Change5
May-2013 vs May-2014: The number of Sold properties is up 1%Sold Properties by Month
Accurate Valuations Group
May-2013 vs. May-2014
William Cobb
Clarus MarketMetrics® 06/10/2014Information not guaranteed. © 2014 - 2015 Terradatum and its suppliers and licensors (www.terradatum.com/about/licensors.td).
1/2
MLS: GBRAR Bedrooms:AllAll
Construction Type:All1 Year Monthly SqFt:
Bathrooms: Lot Size:All All Square FootagePeriod:All
County:Property Types: : Residential
East Baton RougePrice:

Sold Properties by MonthMay-2013 vs May-2014: The number of Sold properties is up 1%
Accurate Valuations GroupWilliam Cobb
Time Period Units Median Price Avg DOM
May-14 175,000497 83Apr-14 170,750430 95Mar-14 188,000342 89Feb-14 159,000311 100Jan-14 159,500268 93Dec-13 182,500349 85Nov-13 183,125296 86Oct-13 174,727372 89Sep-13 170,000366 83Aug-13 177,217466 82Jul-13 182,000465 79Jun-13 178,000503 82May-13 178,950492 94
Clarus MarketMetrics® 06/10/2014Information not guaranteed. © 2014 - 2015 Terradatum and its suppliers and licensors (www.terradatum.com/about/licensors.td).
22/
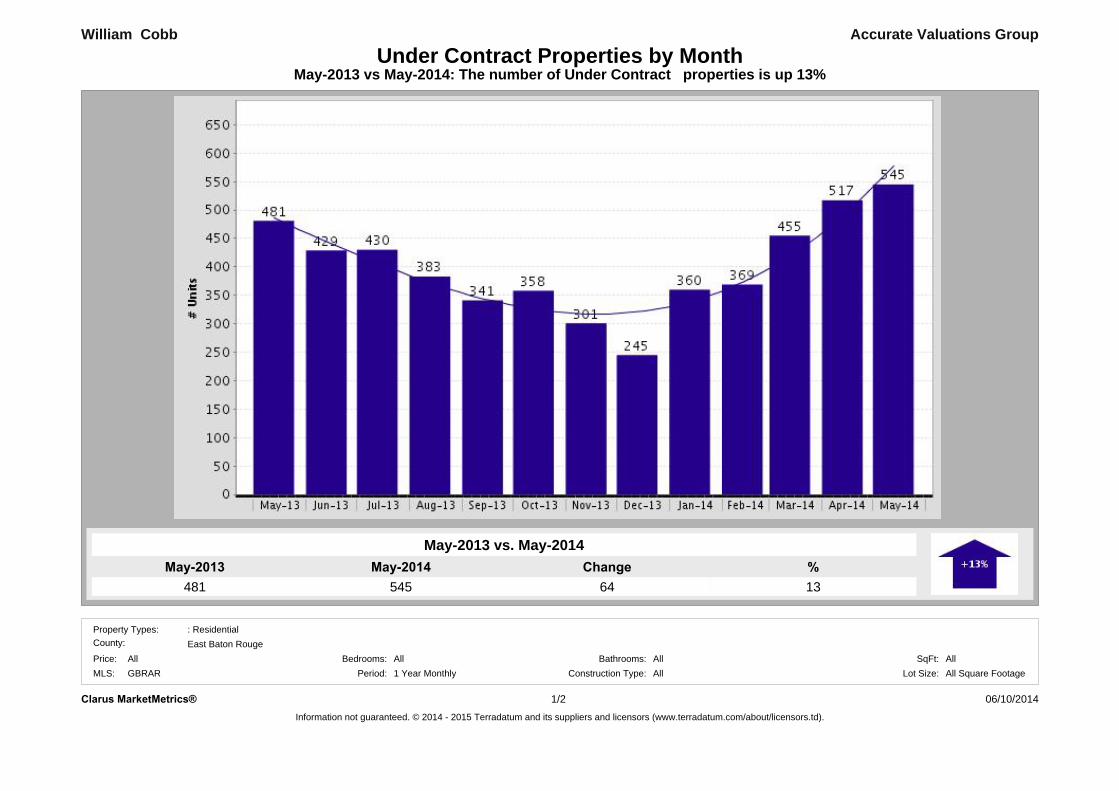
May-2014545
May-2013481
%13
Change64
May-2013 vs May-2014: The number of Under Contract properties is up 13%Under Contract Properties by Month
Accurate Valuations Group
May-2013 vs. May-2014
William Cobb
Clarus MarketMetrics® 06/10/2014Information not guaranteed. © 2014 - 2015 Terradatum and its suppliers and licensors (www.terradatum.com/about/licensors.td).
1/2
AllBathrooms: SqFt:All
: Residential
All Square FootageConstruction Type: Lot Size:GBRAR
East Baton Rouge
Period: 1 Year MonthlyPrice:MLS:
All AllAll
Property Types:
Bedrooms:
County:
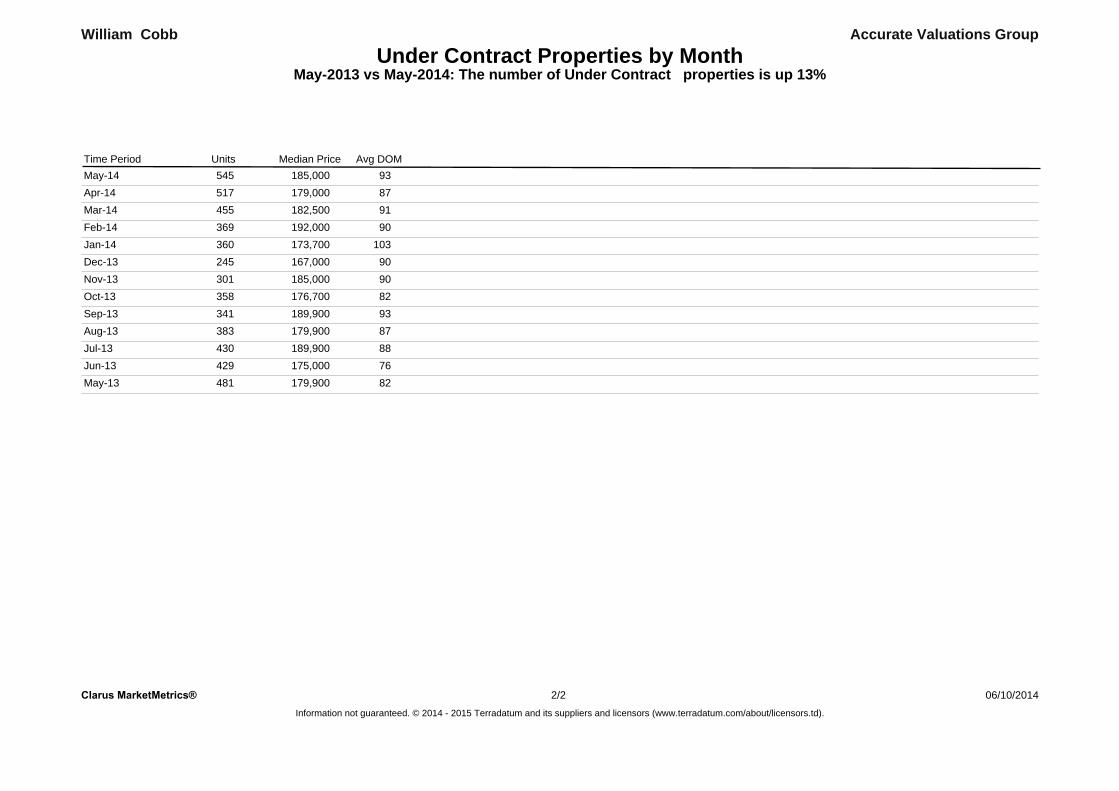
Under Contract Properties by MonthMay-2013 vs May-2014: The number of Under Contract properties is up 13%
Accurate Valuations GroupWilliam Cobb
Units Avg DOMMedian PriceTime PeriodMay-14 185,000545 93Apr-14 179,000517 87Mar-14 182,500455 91Feb-14 192,000369 90Jan-14 173,700360 103Dec-13 167,000245 90Nov-13 185,000301 90Oct-13 176,700358 82Sep-13 189,900341 93Aug-13 179,900383 87Jul-13 189,900430 88Jun-13 175,000429 76May-13 179,900481 82
Clarus MarketMetrics® 06/10/2014Information not guaranteed. © 2014 - 2015 Terradatum and its suppliers and licensors (www.terradatum.com/about/licensors.td).
22/
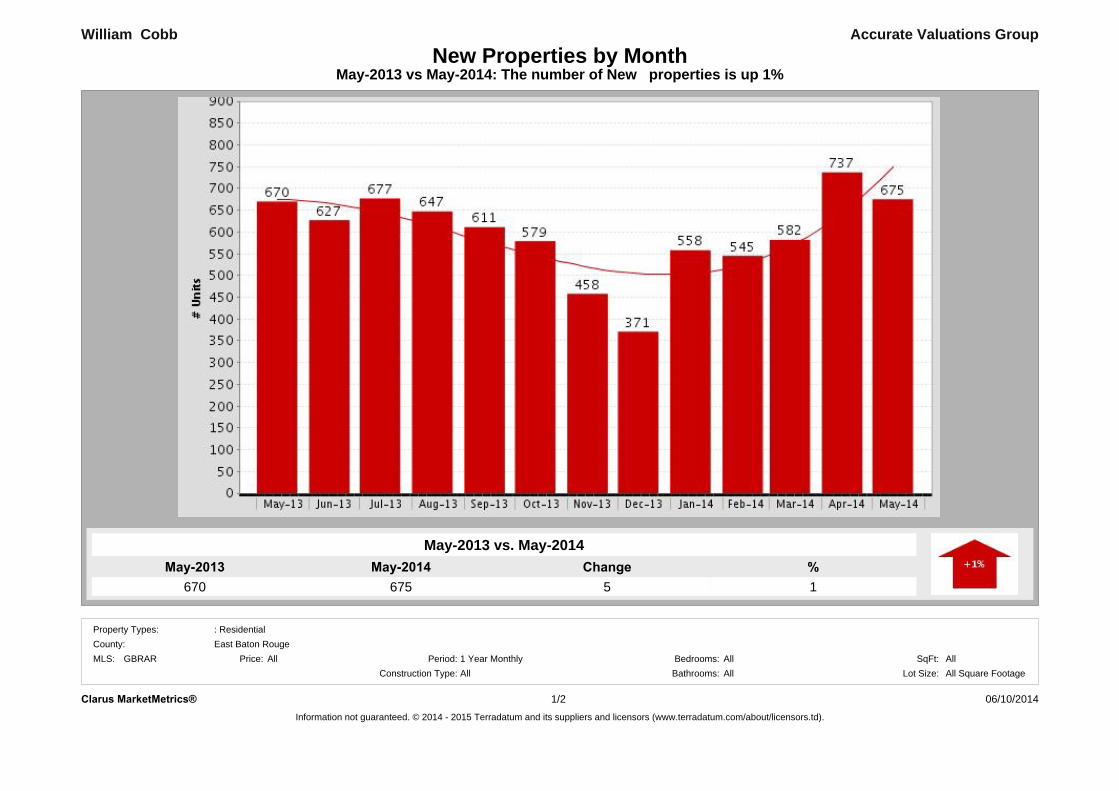
May-2014675
May-2013670
%1
Change5
May-2013 vs May-2014: The number of New properties is up 1%New Properties by Month
Accurate Valuations Group
May-2013 vs. May-2014
William Cobb
Clarus MarketMetrics® 06/10/2014Information not guaranteed. © 2014 - 2015 Terradatum and its suppliers and licensors (www.terradatum.com/about/licensors.td).
1/2
MLS: GBRAR Bedrooms:AllAll
Construction Type:All1 Year Monthly SqFt:
Bathrooms: Lot Size:All All Square FootagePeriod:All
County:Property Types: : Residential
East Baton RougePrice:

New Properties by MonthMay-2013 vs May-2014: The number of New properties is up 1%
Accurate Valuations GroupWilliam Cobb
Units Median PriceTime PeriodMay-14 199,000675Apr-14 186,500737Mar-14 193,450582Feb-14 179,000545Jan-14 179,950558Dec-13 171,900371Nov-13 169,900458Oct-13 186,000579Sep-13 159,900611Aug-13 173,000647Jul-13 175,000677Jun-13 179,900627May-13 180,000670
Clarus MarketMetrics® 06/10/2014Information not guaranteed. © 2014 - 2015 Terradatum and its suppliers and licensors (www.terradatum.com/about/licensors.td).
22/

May-20142,977
May-20133,104
%-4
Change-127
May-2013 vs May-2014: The number of For Sale properties is down -4%For Sale Properties by Month
Accurate Valuations Group
May-2013 vs. May-2014
William Cobb
Clarus MarketMetrics® 06/10/2014Information not guaranteed. © 2014 - 2015 Terradatum and its suppliers and licensors (www.terradatum.com/about/licensors.td).
1/2
MLS: GBRAR Bedrooms:AllAll
Construction Type:All1 Year Monthly SqFt:
Bathrooms: Lot Size:All All Square FootagePeriod:All
County:Property Types: : Residential
East Baton RougePrice:

For Sale Properties by MonthMay-2013 vs May-2014: The number of For Sale properties is down -4%
Accurate Valuations GroupWilliam Cobb
Units Avg DOMMedian PriceTime Period
May-14 184,9002,977 143Apr-14 179,9002,999 145Mar-14 175,0002,891 153Feb-14 169,9002,861 154Jan-14 168,7502,894 157Dec-13 165,0002,833 163Nov-13 168,5002,944 151Oct-13 167,5003,061 143Sep-13 165,0003,037 142Aug-13 166,9003,075 147Jul-13 170,0003,086 150Jun-13 169,9003,066 151May-13 169,2503,104 150
Clarus MarketMetrics® 06/10/2014Information not guaranteed. © 2014 - 2015 Terradatum and its suppliers and licensors (www.terradatum.com/about/licensors.td).
22/
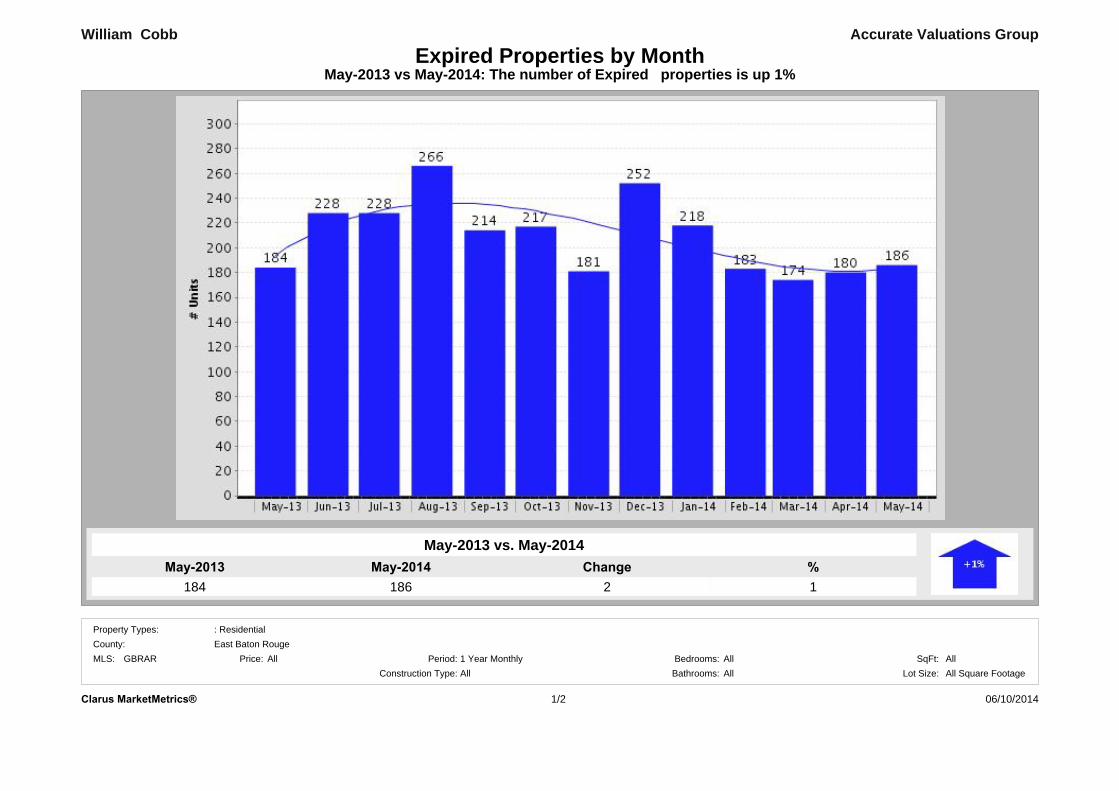
May-2014186
May-2013184
%1
Change2
May-2013 vs May-2014: The number of Expired properties is up 1%Expired Properties by Month
Accurate Valuations Group
May-2013 vs. May-2014
William Cobb
06/10/2014Clarus MarketMetrics® 1/2
MLS: GBRAR Bedrooms:AllAll
Construction Type:All1 Year Monthly SqFt:
Bathrooms: Lot Size:All All Square FootagePeriod:All
County:Property Types: : Residential
East Baton RougePrice:

Expired Properties by MonthMay-2013 vs May-2014: The number of Expired properties is up 1%
Accurate Valuations GroupWilliam Cobb
Avg DOMUnits Median PriceMay-14 151,900186 187Apr-14 169,900180 197Mar-14 155,450174 199Feb-14 154,000183 205Jan-14 159,900218 186Dec-13 168,750252 232Nov-13 184,900181 180Oct-13 154,900217 183Sep-13 151,350214 183Aug-13 156,250266 232Jul-13 193,450228 213Jun-13 159,900228 191May-13 157,750184 194
Clarus MarketMetrics® 06/10/2014Information not guaranteed. © 2014 - 2015 Terradatum and its suppliers and licensors (www.terradatum.com/about/licensors.td).
22/

May-2013 vs May-2014: The number of for sale properties is down -4% and the number of sold properties is up 1%
Accurate Valuations Group
May-2013 vs. May-2014
3,104 -4
William Cobb
2,977May-2014
Supply & Demand by Month
ChangeMay-2013 %-127
May-2013 May-2014 %492 1
May-2013 vs. May-2014
497Change
5
Clarus MarketMetrics® 06/10/2014Information not guaranteed. © 2014 - 2015 Terradatum and its suppliers and licensors (www.terradatum.com/about/licensors.td).
1/2
MLS: GBRAR Bedrooms:AllAll
Construction Type:All1 Year Monthly SqFt:
Bathrooms: Lot Size:All All Square FootagePeriod:All
County:Property Types: : Residential
East Baton RougePrice:
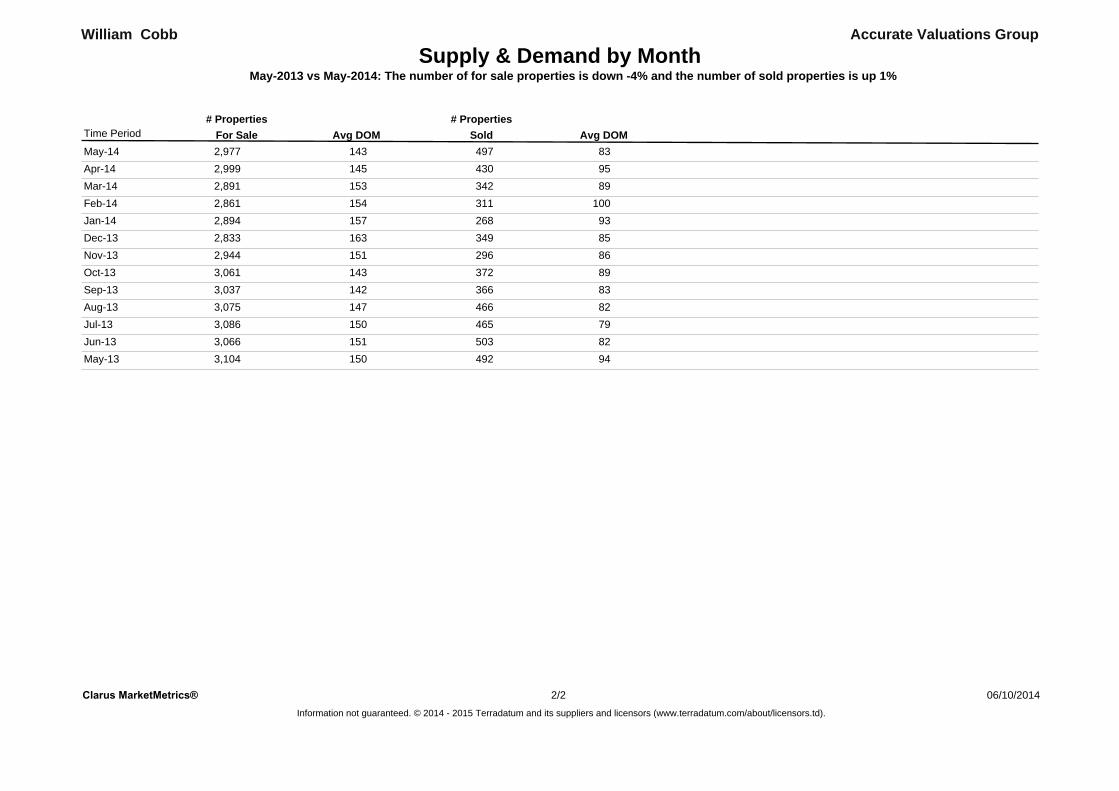
Supply & Demand by MonthMay-2013 vs May-2014: The number of for sale properties is down -4% and the number of sold properties is up 1%
William Cobb Accurate Valuations Group
For Sale Sold# Properties
Avg DOM Avg DOM# Properties
Time Period
May-14 143 832,977 497Apr-14 145 952,999 430Mar-14 153 892,891 342Feb-14 154 1002,861 311Jan-14 157 932,894 268Dec-13 163 852,833 349Nov-13 151 862,944 296Oct-13 143 893,061 372Sep-13 142 833,037 366Aug-13 147 823,075 466Jul-13 150 793,086 465Jun-13 151 823,066 503May-13 150 943,104 492
Clarus MarketMetrics® 06/10/2014Information not guaranteed. © 2014 - 2015 Terradatum and its suppliers and licensors (www.terradatum.com/about/licensors.td).
22/
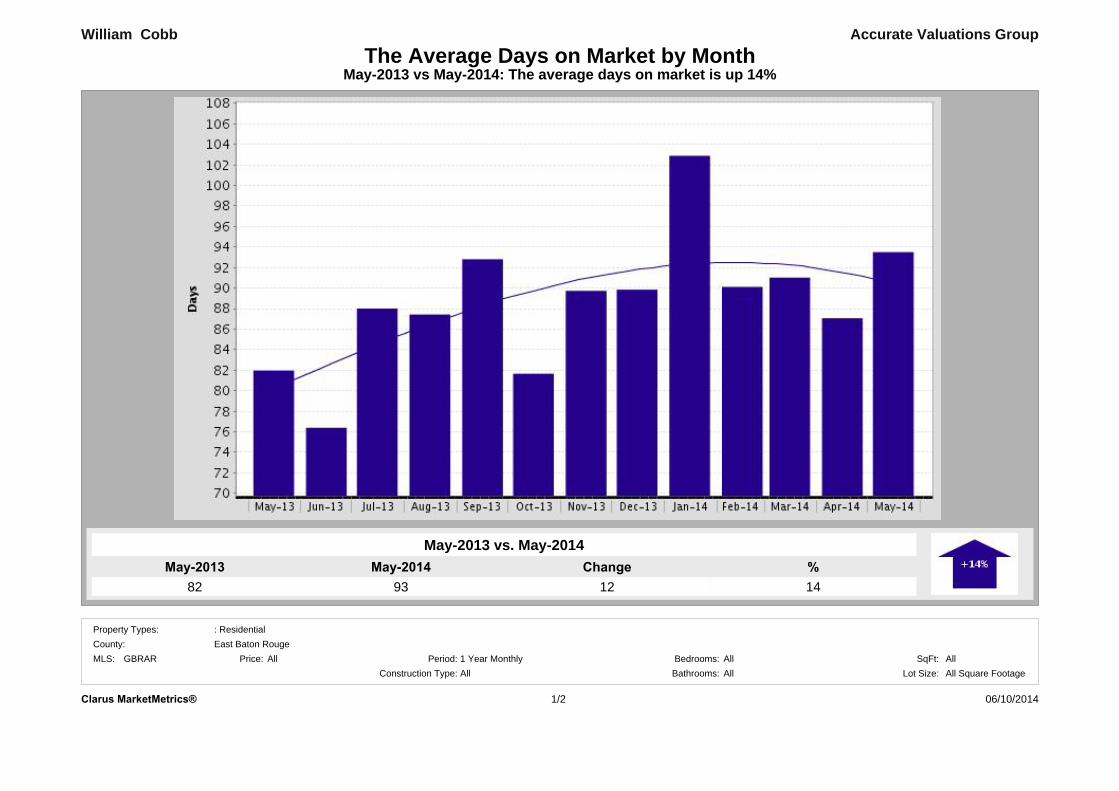
May-201493
May-201382
%14
Change12
May-2013 vs May-2014: The average days on market is up 14%The Average Days on Market by Month
Accurate Valuations Group
May-2013 vs. May-2014
William Cobb
East Baton RougeAll 1 Year Monthly
County:Period:Price:
Property Types: : Residential
06/10/20141/2Clarus MarketMetrics®
All Square FootageBedrooms: All AllSqFt:
All Lot Size:Bathrooms:AllConstruction Type:MLS: GBRAR
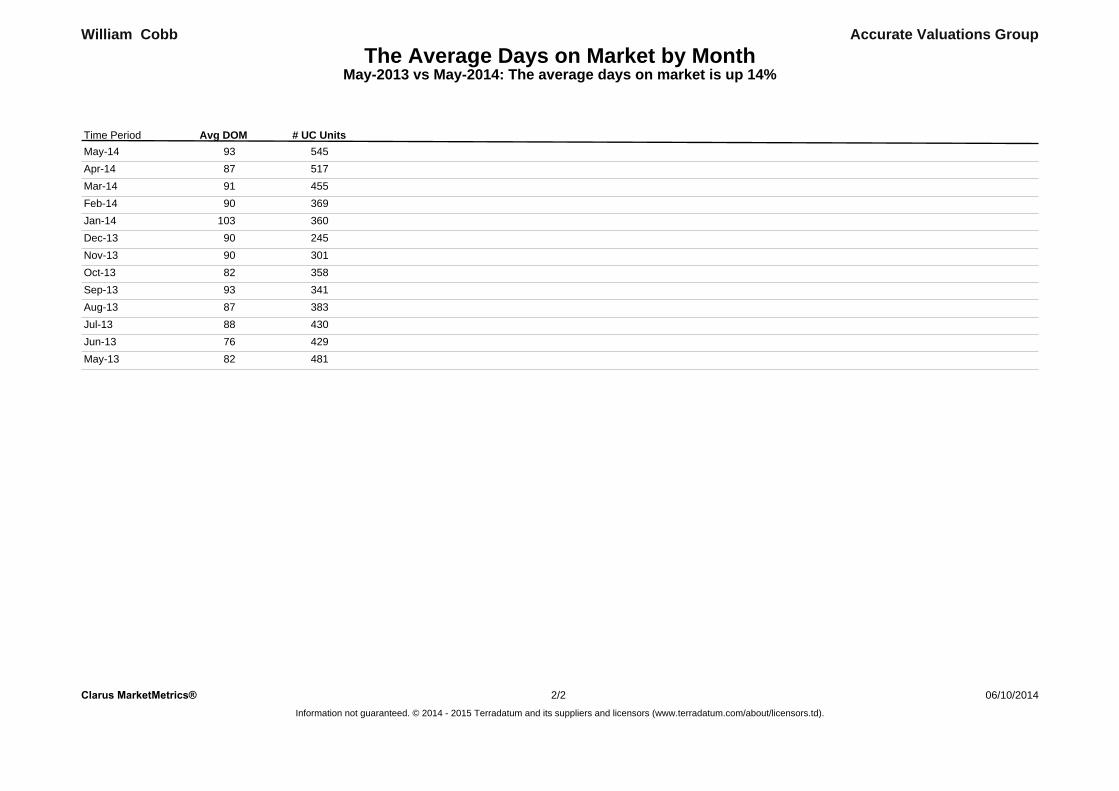
The Average Days on Market by MonthMay-2013 vs May-2014: The average days on market is up 14%
Accurate Valuations GroupWilliam Cobb
# UC UnitsAvg DOMTime PeriodMay-14 54593Apr-14 51787Mar-14 45591Feb-14 36990Jan-14 360103Dec-13 24590Nov-13 30190Oct-13 35882Sep-13 34193Aug-13 38387Jul-13 43088Jun-13 42976May-13 48182
Clarus MarketMetrics® 2/2 06/10/2014Information not guaranteed. © 2014 - 2015 Terradatum and its suppliers and licensors (www.terradatum.com/about/licensors.td).
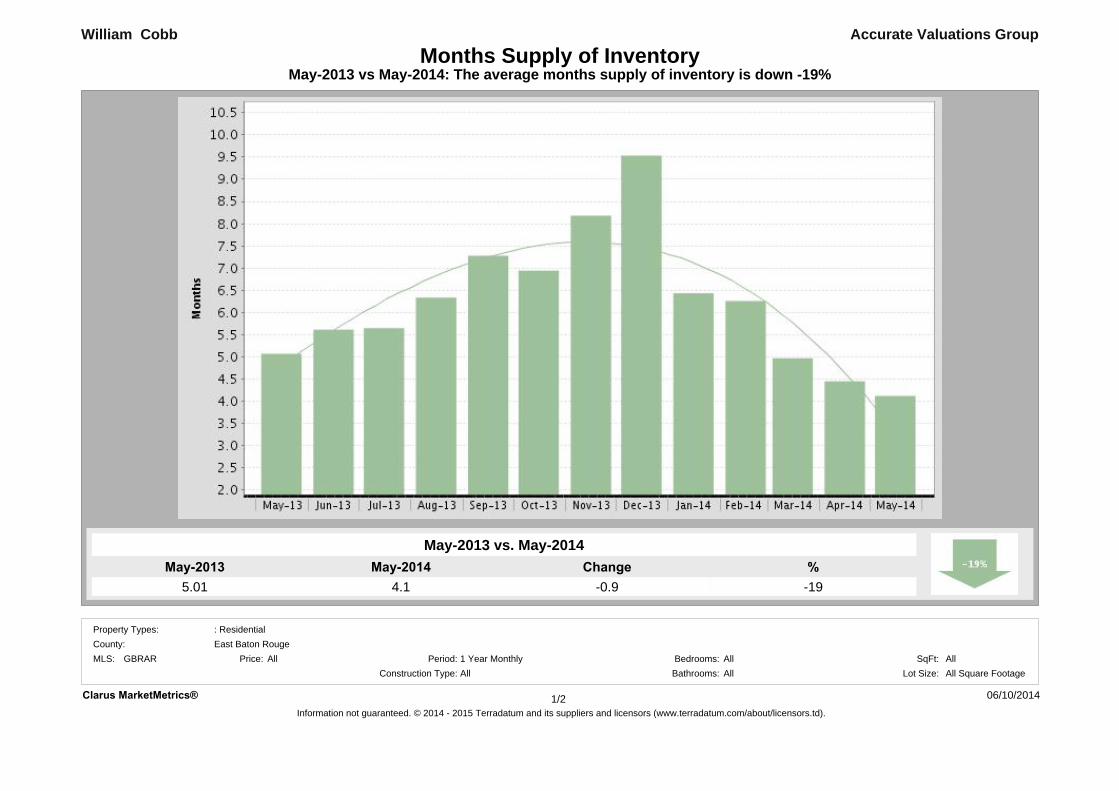
May-2013 vs May-2014: The average months supply of inventory is down -19%
Accurate Valuations Group
May-2013 vs. May-2014
5.01 -19
William Cobb
4.1May-2014
Months Supply of Inventory
ChangeMay-2013 %-0.9
Clarus MarketMetrics® 06/10/2014Information not guaranteed. © 2014 - 2015 Terradatum and its suppliers and licensors (www.terradatum.com/about/licensors.td).
1/2
MLS: GBRAR Bedrooms:AllAll
Construction Type:All1 Year Monthly SqFt:
Bathrooms: Lot Size:All All Square FootagePeriod:All
County:Property Types: : Residential
East Baton RougePrice:

Months Supply of InventoryMay-2013 vs May-2014: The average months supply of inventory is down -19%
William Cobb Accurate Valuations Group
During MonthLast Day of Month MSI# Units For Sale # UC Units
UC Avg DOMTime Period
May-14 545 932,246 4.1Apr-14 517 872,302 4.5Mar-14 455 912,262 5.0Feb-14 369 902,309 6.3Jan-14 360 1032,316 6.4Dec-13 245 902,336 9.5Nov-13 301 902,462 8.2Oct-13 358 822,486 6.9Sep-13 341 932,482 7.3Aug-13 383 872,426 6.3Jul-13 430 882,428 5.6Jun-13 429 762,409 5.6May-13 481 822,439 5.1
Clarus MarketMetrics® 06/10/2014Information not guaranteed. © 2014 - 2015 Terradatum and its suppliers and licensors (www.terradatum.com/about/licensors.td).
22/