Embed Size (px)
Citation preview

COMMERCIAL REAL ESTATE: 2015 INVESTMENT OUTLOOK
LAWRENCE YUN, PhD
Chief Economist, Sr. VP
National Association of REALTORS®
DONALD E. HUFFNER
Managing Director, Head of Americas
AIG Global Real Estate
RICHARD M. GATTO
Executive Vice President
The Alter Group
ANDREW H. TROTTER, III
Chief Investment Officer
Centennial Holding Company
COMMERCIAL ECONOMIC ISSUES & TRENDS FORUM


Commercial Real Estate Trends and Outlook
Lawrence Yun, Ph.D.Chief Economist
NATIONAL ASSOCIATION OF REALTORS®
Presentation at:NAR Annual Commercial Real Estate Forum
New Orleans, LA
November 7, 2014

Commercial Investment Sales of Large Properties(Properties valued at $2.5 million and over)
2003 2004 2005 2006 2007 2008 2009 2010 2011 2012 2013 2014 2015 2016
130
212
362423
571
174
67
147
233299
355400 420 430
Commercial Sales in $Billions

Federal Reserve Commercial Property Price Index
2000 - Q1
2000 - Q4
2001 - Q3
2002 - Q2
2003 - Q1
2003 - Q4
2004 - Q3
2005 - Q2
2006 - Q1
2006 - Q4
2007 - Q3
2008 - Q2
2009 - Q1
2009 - Q4
2010 - Q3
2011 - Q2
2012 - Q1
2012 - Q4
2013 - Q3
0
50
100
150
200
250
300

GDP Reboundin 2014 Q2 and Q3
2007 - Q1
2007 - Q3
2008 - Q1
2008 - Q3
2009 - Q1
2009 - Q3
2010 - Q1
2010 - Q3
2011 - Q1
2011 - Q3
2012 - Q1
2012 - Q3
2013 - Q1
2013 - Q3
2014 - Q1
2014 - Q3
-10
-8
-6
-4
-2
0
2
4
6
GDP Annualized Growth Rate

GDP Still not Robust … Below 3% for 9 straight years
19501953
19561959
19621965
19681971
19741977
19801983
19861989
19921995
19982001
20042007
20102013
-4
-2
0
2
4
6
8
10
GDP Annual Growth Rate

Household Net Worth at All-Time High
2000 - Q1
2000 - Q4
2001 - Q3
2002 - Q2
2003 - Q1
2003 - Q4
2004 - Q3
2005 - Q2
2006 - Q1
2006 - Q4
2007 - Q3
2008 - Q2
2009 - Q1
2009 - Q4
2010 - Q3
2011 - Q2
2012 - Q1
2012 - Q4
2013 - Q3
40000
45000
50000
55000
60000
65000
70000
75000
80000
85000$ billion

Monetary Policy by Federal Reserve (zero rate policy for 6 years!)
2005 2006 2007 2008 2009 2010 2011 2012 2013 20140
1
2
3
4
5
6
Fed Funds %

Federal Reserve Balance Sheet from Quantitative Easing
2005 - Jan 2006 - Apr 2007 - Jul 2008 - Oct 2010 - Jan 2011 - Apr 2012 - Jul0
500000
1000000
1500000
2000000
2500000
3000000
3500000
4000000
Total Asset Purchase
$ million

10-year Treasury Yield
2000 - Jan 2002 - Jan 2004 - Jan 2006 - Jan 2008 - Jan 2010 - Jan 2012 - Jan 2014 - Jan0
1
2
3
4
5
6
7

Non-worrisome CPI Inflation – YetCOLA of 1.7% in 2015
2000 - Jan 2002 - Jan 2004 - Jan 2006 - Jan 2008 - Jan 2010 - Jan 2012 - Jan 2014 - Jan
-3
-2
-1
0
1
2
3
4
5
6

Rising Renters’ and Homeowners’ Rent Growth
(Above 3%)
2003 - Jan 2004 - Jul 2006 - Jan 2007 - Jul 2009 - Jan 2010 - Jul 2012 - Jan 2013 - Jul-1
0
1
2
3
4
5
Owners' Equivalent Rent Renters' Rent
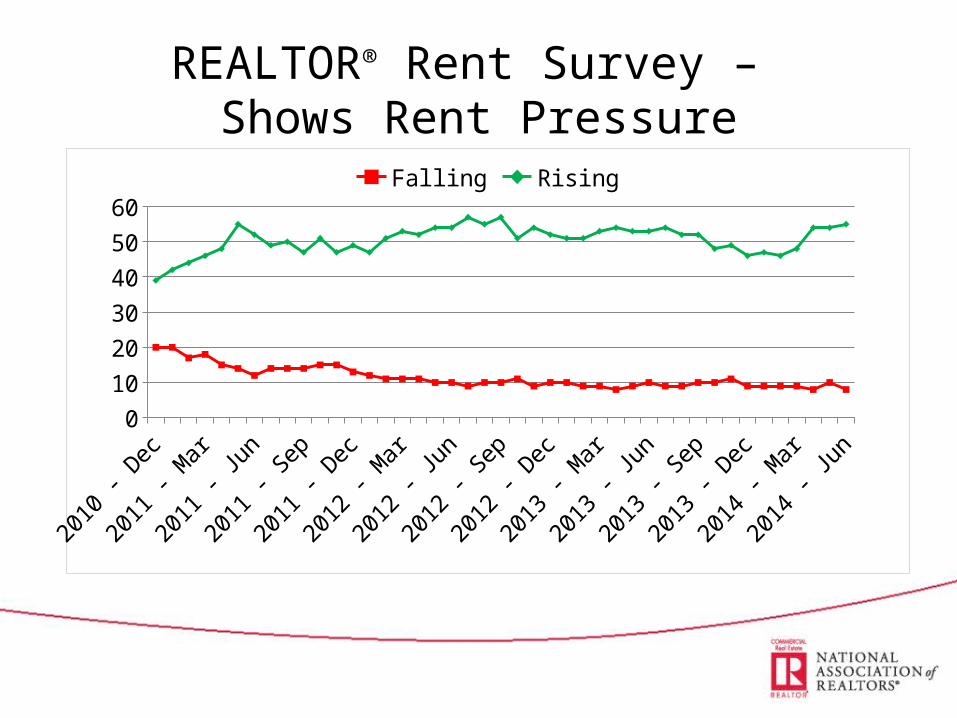
REALTOR® Rent Survey – Shows Rent Pressure
2010 - Dec
2011 - Feb
2011 - Apr
2011 - Jun
2011 - Aug
2011 - Oct
2011 - Dec
2012 - Feb
2012 - Apr
2012 - Jun
2012 - Aug
2012 - Oct
2012 - Dec
2013 - Feb
2013 - Apr
2013 - Jun
2013 - Aug
2013 - Oct
2013 - Dec
2014 - Feb
2014 - Apr
2014 - Jun
0
10
20
30
40
50
60
Falling Rising

Oil Price
2000 - Jan 2002 - Jan 2004 - Jan 2006 - Jan 2008 - Jan 2010 - Jan 2012 - Jan 2014 - Jan0
20
40
60
80
100
120
140
160

U.S. Dollar Strength vs Euro
2000 - Jan 2002 - Jan 2004 - Jan 2006 - Jan 2008 - Jan 2010 - Jan 2012 - Jan 2014 - Jan0.8
0.9
1
1.1
1.2
1.3
1.4
1.5
1.6
1.7
$US per One Euro

U.S. Dollar Weakness vs Chinese Yuan
2000 - Jan 2002 - Jan 2004 - Jan 2006 - Jan 2008 - Jan 2010 - Jan 2012 - Jan 2014 - Jan6
6.5
7
7.5
8
8.5
Yuan per $1

Monetary Policy
• Quantitative Easing … Finished
• Fed Funds Rate … hike in 2015 Q1/Q2
• Earlier Move to Tighten because of Inflation Pressure
• Long-term Steady State Rate (2016 onwards) .. 10 year Treasury at 5.0%
• Mortgage Rates reaching 6% by 2016

Jobs(8 million lost … 10 million gained)
2000 - Jan 2002 - Apr 2004 - Jul 2006 - Oct 2009 - Jan 2011 - Apr 2013 - May124000
126000
128000
130000
132000
134000
136000
138000
140000
142000In thousands

Weekly New Unemployment Insurance Claims
2000 - Jan 2002 - Jan 2004 - Jan 2006 - Jan 2008 - Jan 2010 - Jan 2012 - Jan 2014 - Jan250
300
350
400
450
500
550
600In thousands

Job Market Comparisons by StateFast Growing States 1-year Growth Rate
North Dakota 4.5
Nevada 3.7
Texas 3.4
Florida 2.9
Utah 2.9
Colorado 2.8
Oregon 2.7
Delaware 2.6
West Virginia 2.5
California 2.2
Slow Moving States 1-year Growth Rate
Michigan 0.7
Alabama 0.6
Wyoming 0.6
South Dakota 0.3
Virginia 0.3
New Jersey 0.1
Illinois 0.0
Alaska 0.0
New Mexico -0.1
Vermont -0.2

REALTOR® Markets & Deal Size(Not $2.5 million Properties)
< $250,000
$250,000 - $500,000
$500,000 - $1,000,000
$1,000,000 - $2,000,000
$2,000,000 - $5,000,000
$5,000,000 - $10,000,000
> $10,000,000
21%
22%
26%
17%
12%
1%
2%
2013 CRE Lending Survey: Value of most recent sales transaction
Source: NAR

8%
17%
25%
7%6%
4%
18%
1% 11%
3%Current sources of financing for commercial dealsNational banks (“Big four”)
Regional banks
Local banks
Credit unions
Life insurance companies
REITs
Private investors
Public companies
Small Business Administration
Other, please specify
Source: NAR
Small Banks Important to REALTORS®

NAR Member Commercial Activity Survey2nd Quarter, 2014
• Sales volume rose 7% YoY
• Sales prices increased 3% YoY
• Cap rates averaged 8.3%
Main market challenges:
• Inventory shortage
• Pricing gap between buyers and sellers
• Local economies

REALTORS® Help Small Businesses
< $250,000
$250,000 - $499,999
$500,000 - $999,999
$1,000,000 - $1,999,999
$2,000,000 - $4,999,999
$5,000,000 - $10,000,000
$10,000,000 <
16%
25%
25%
17%
10%
4%
3%
Average Value of Sale Transaction
2011 2012 2013 20140%
10%
20%
30%
40%
50%
60%
70%
80%
Did you close a sale in the past 12 months?
Yes No N/A

Credit Difficulty
2011 2012 2013 20140%
10%
20%
30%
40%
50%
60%
70%
80%
Sales transaction fail during the past 12 months due to lack of financing
Yes No N/A
17%
63%
20%
If answered "Yes," the reason was:
Financing availabilityLoan underwrit-ing / lender re-quirementsAppraisal / valuation

A Typical Commercial REALTOR®
BUSINESS REVENUE AND FIRM AFFILIATION
• The median gross annual income of commercial members was $96,200 in 2013, an increase from $90,200 in 2012. The median gross annual income of commercial members has increased for the past four years.
• Eighty percent of commercial members work at least 40 hours a week.
• Sixty-two percent of commercial members of NAR derived 50 percent or more of their income from all commercial real estate in 2013.
• Fifty-seven percent of members work for a local commercial real estate firm.
BUSINESS ACTIVITIES OF NAR COMMERCIAL MEMBERS
• Commercial members completed a median of eight transactions in 2013.
• The median sales transaction volume in 2013 for members who had a transaction was $2,554,700 – an increase from $2,507,700 in 2012.
• The median gross leasing volume was $431,600 in 2013– a decrease from the $476,400 in 2012.

CCIM Member Survey on Cap Rates

2005.Q3
2006.Q1
2006.Q3
2007.Q1
2007.Q3
2008.Q1
2008.Q3
2009.Q1
2009.Q3
2010.Q1
2010.Q3
2011.Q1
2011.Q3
2012.Q1
2012.Q3
2013.Q1
2013.Q3
2014.Q1
0.0
20.0
40.0
60.0
80.0
100.0
120.0
140.0 SIOR Index
Industrial Office
Sources: SIOR, NAR
SIOR Member Survey on Activity

Economic Forecast2013 2014
Likely2015
Forecast2016
ForecastGDP Growth 2.2% 2.2% 2.7% 2.9%
Job Growth +2.3 million +2.5 million +2.5 million +2.6 million
CPI Inflation 1.5% 1.6% 2.7% 3.3%
Consumer Confidence
73 87 95 98
10-year Treasury
2.5% 2.6% 3.2% 4.3%

OFFICE 2014 2015 2016Vacancy Rate 16.2% 15.8% 15.6%Net Absorption ('000 sq. ft.) 36,192 50,678 57,782Completions ('000 sq. ft.) 26,450 41,799 44,862Rent Growth 2.6% 3.2% 3.6%
INDUSTRIAL 2014 2015 2016Vacancy Rate 8.9% 8.5% 8.1%Net Absorption ('000 sq. ft.) 107,580 104,948 105,044Completions ('000 sq. ft.) 83,424 68,755 61,720Inventory ('000,000 sq. ft.) 8,468 8,537 8,598Rent Growth 2.4% 2.8% 2.9%
RETAIL 2014 2015 2016Vacancy Rate 9.8% 9.7% 9.4%Net Absorption ('000 sq. ft.) 11,214 19,314 24,313Completions ('000 sq. ft.) 7,275 12,196 16,342Rent Growth 2.0% 2.4% 3.0%
MULTI-FAMILY 2014 2015 2016Vacancy Rate 4.0% 4.0% 4.2%Net Absorption (Units) 223,421 170,065 140,128Completions (Units) 191,481 146,461 122,381Rent Growth 4.0% 3.9% 3.5%
Sources: National Association of REALTORS® / Reis, Inc.
Commercial Real Estate Forecast

Washington Policy Watch onCommercial Real Estate
• Facilitate Covered Bonds to help credit flow
• Raise cap on holding of commercial RE loans by credit unions
• Preserve Like-Kind Exchanges
• Preserve Terrorism Insurance
• Preserve capital gains status on carried interest
• Depreciation Rules should match economic life
• Oppose lease-accounting changes


Richard M. GattoExecutive Vice President
The Alter Group

Donald E. HuffnerManaging Director, Head of the
AmericasAIG Global Real Estate

Andrew H. Trotter, IIIChief Investment Officer
Centennial Holding Company

COMMERCIAL REAL ESTATE: 2015 INVESTMENT OUTLOOK
LAWRENCE YUN, PhD
Chief Economist, Sr. VP
National Association of REALTORS®
DONALD E. HUFFNER
Managing Director, Head of Americas
AIG Global Real Estate
RICHARD M. GATTO
Executive Vice President
The Alter Group
ANDREW H. TROTTER, III
Chief Investment Officer
Centennial Holding Company
COMMERCIAL ECONOMIC ISSUES & TRENDS FORUM