Embed Size (px)
Citation preview

Table of
Contents
Key Statistics for August
Sales 2015 Residential Sales Stats Year-to-Year Total Sales by Map Area Median 2015 Median Sales Stats Year-to-Year Median Sales by Map Area Listings 2015 Active Listings by Map Area 2015 Total Active Listings vs. Total Sales Year-to-Year Active Listings by Map Area Inventory 2015 Months of Inventory by Map Area Year-to-Year Months of Inventory
Recap & Outlook for September
About Hady Chahine Contact Information

Key Statistics for August
Back to Table of Contents
= trending positive = trending positive
= trending negative = trending negative
Month-to-Month Comparison July 2015 Aug 2015 Delta (qty) Delta (%) Increase Decrease
Total Sales 99 75 -24 -24.2%
Median Sales Price 876,000 795,000 (81,000) -9.2%
Median Days to Sell 33 35 2 6.1%
Listings 147 137 -10 -6.8%
Sales/Listing Ratio 67.3% 54.7% -12.6% -18.7%
Months of Inventory 1.0 2.0 1.0 100.0%
Monthly Comparison Year-to-Year Aug 2014 Aug 2015 Delta Delta Increase Decrease
Total Sales 74 75 1 1.4%
Median Sales Price 809,000 795,000 (14,000) -1.7%
Median Days to Sell 35 35 0 0.0%
Listings 192 137 -55 -28.6%
Months of Inventory 2.3 2.0 -0.3 -13.0%

Back to Table of Contents
Total Sales Month-to-Month by Map Area Jun Jul Aug
N Redondo Beach/Villas North 18 26 15
S Redondo Beach W of PCH 11 12 15
N Redondo Beach/Villas South 19 16 18
S Redondo Beach S of Torrance Blvd 12 9 7
S Redondo Beach N of Torrance Blvd 11 16 11
N Redondo Beach/Golden Hills 13 14 7
N Redondo Beach/El Nido 6 6 2
Total Sales 90 99 75
0
10
20
30
40
50
60
70
80
90
100
Jun Jul Aug
2015 Total Sales Month-to-Month by Map Area
N Redondo Beach/Villas North
S Redondo Beach W of PCH
N Redondo Beach/Villas South
S Redondo Beach S of Torrance Blvd
S Redondo Beach N of Torrance Blvd
N Redondo Beach/Golden Hills
N Redondo Beach/El Nido
Total Sales

Back to Table of Contents
Total Sales Year-to-Year by Map Area 2013 2014 2015
N Redondo Beach/Villas North 17 17 15
S Redondo Beach W of PCH 14 14 15
N Redondo Beach/Villas South 20 13 18
S Redondo Beach S of Torrance Blvd 10 13 7
S Redondo Beach N of Torrance Blvd 13 9 11
N Redondo Beach/Golden Hills 10 7 7
N Redondo Beach/El Nido 5 1 2
Total Sales 89 74 75
0
10
20
30
40
50
60
70
80
90
2013 2014 2015
Total Sales Year-to-Year by Map Area: August
N Redondo Beach/Villas North
S Redondo Beach W of PCH
N Redondo Beach/Villas South
S Redondo Beach S of Torrance Blvd
S Redondo Beach N of Torrance Blvd
N Redondo Beach/Golden Hills
N Redondo Beach/El Nido
Total Sales
Back to Table of Contents
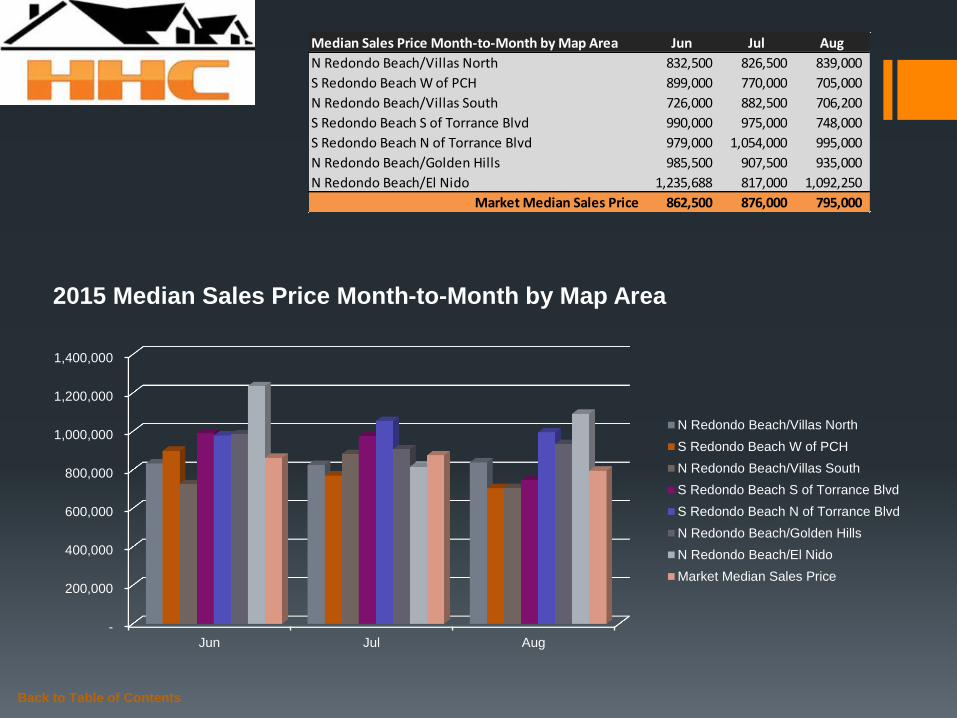
Median Sales Price Month-to-Month by Map Area Jun Jul Aug
N Redondo Beach/Villas North 832,500 826,500 839,000
S Redondo Beach W of PCH 899,000 770,000 705,000
N Redondo Beach/Villas South 726,000 882,500 706,200
S Redondo Beach S of Torrance Blvd 990,000 975,000 748,000
S Redondo Beach N of Torrance Blvd 979,000 1,054,000 995,000
N Redondo Beach/Golden Hills 985,500 907,500 935,000
N Redondo Beach/El Nido 1,235,688 817,000 1,092,250
Market Median Sales Price 862,500 876,000 795,000
-
200,000
400,000
600,000
800,000
1,000,000
1,200,000
1,400,000
Jun Jul Aug
2015 Median Sales Price Month-to-Month by Map Area
N Redondo Beach/Villas North
S Redondo Beach W of PCH
N Redondo Beach/Villas South
S Redondo Beach S of Torrance Blvd
S Redondo Beach N of Torrance Blvd
N Redondo Beach/Golden Hills
N Redondo Beach/El Nido
Market Median Sales Price

Back to Table of Contents
Median Sales Price Year-to-Year by Map Area 2013 2014 2015
N Redondo Beach/Villas North 817,500 709,000 839,000
S Redondo Beach W of PCH 785,000 893,500 705,000
N Redondo Beach/Villas South 730,000 808,000 706,200
S Redondo Beach S of Torrance Blvd 825,800 700,000 748,000
S Redondo Beach N of Torrance Blvd 960,000 910,000 995,000
N Redondo Beach/Golden Hills 810,000 856,000 935,000
N Redondo Beach/El Nido 555,000 440,000 1,092,250
Market Median Sales Price 783,500 809,000 795,000
-
200,000
400,000
600,000
800,000
1,000,000
1,200,000
2013 2014 2015
Median Sales Price Year-to-Year by Map Area: August
N Redondo Beach/Villas North
S Redondo Beach W of PCH
N Redondo Beach/Villas South
S Redondo Beach S of Torrance Blvd
S Redondo Beach N of Torrance Blvd
N Redondo Beach/Golden Hills
N Redondo Beach/El Nido
Market Median Sales Price

Back to Table of Contents
Active Listings vs. Total Sales by Map Area Jan Feb Mar Apr May Jun Jul Aug Sep Oct Nov Dec
N Redondo Beach/Villas North 18 24 25 24 38 32 31 28
S Redondo Beach W of PCH 13 16 17 23 21 21 25 19
N Redondo Beach/Villas South 31 28 26 31 29 33 30 28
S Redondo Beach S of Torrance Blvd 15 14 21 21 21 20 25 23
S Redondo Beach N of Torrance Blvd 12 14 13 30 29 17 19 23
N Redondo Beach/Golden Hills 2 5 7 16 18 13 12 10
N Redondo Beach/El Nido 6 11 10 11 8 5 5 6
Total Active Listings 97 112 119 156 164 141 147 137
-
5
10
15
20
25
30
35
40
Jan Feb Mar Apr May Jun Jul Aug Sep Oct Nov Dec
2015 Active Listings by Map Area
N Redondo Beach/Villas North
S Redondo Beach W of PCH
N Redondo Beach/Villas South
S Redondo Beach S of Torrance Blvd
S Redondo Beach N of Torrance Blvd
N Redondo Beach/Golden Hills
N Redondo Beach/El Nido

Back to Table of Contents
Active Listings vs. Total Sales by Map Area Jan Feb Mar Apr May Jun Jul Aug Sep Oct Nov Dec
N Redondo Beach/Villas North 18 24 25 24 38 32 31 28
S Redondo Beach W of PCH 13 16 17 23 21 21 25 19
N Redondo Beach/Villas South 31 28 26 31 29 33 30 28
S Redondo Beach S of Torrance Blvd 15 14 21 21 21 20 25 23
S Redondo Beach N of Torrance Blvd 12 14 13 30 29 17 19 23
N Redondo Beach/Golden Hills 2 5 7 16 18 13 12 10
N Redondo Beach/El Nido 6 11 10 11 8 5 5 6
Total Active Listings 97 112 119 156 164 141 147 137
Total Sales 46 41 81 79 89 90 99 75
Sales/Listings Ratio 47.4% 36.6% 68.1% 50.6% 54.3% 63.8% 67.3% 54.7%
-
20
40
60
80
100
120
140
160
180
Jan Feb Mar Apr May Jun Jul Aug Sep Oct Nov Dec
2015 Total Active Listings vs. Total Sales
Total Active Listings
Total Sales

Back to Table of Contents
Active Listings Year-to-Year by Map Area 2013 2014 2015
N Redondo Beach/Villas North 36 40 28
S Redondo Beach W of PCH 48 38 19
N Redondo Beach/Villas South 29 35 28
S Redondo Beach S of Torrance Blvd 21 30 23
S Redondo Beach N of Torrance Blvd 40 27 23
N Redondo Beach/Golden Hills 6 9 10
N Redondo Beach/El Nido 9 13 6
Total Active Listings 189 192 137
0
20
40
60
80
100
120
140
160
180
200
2013 2014 2015
Active Listings Year-to-Year by Map Area: August
N Redondo Beach/Villas North
S Redondo Beach W of PCH
N Redondo Beach/Villas South
S Redondo Beach S of Torrance Blvd
S Redondo Beach N of Torrance Blvd
N Redondo Beach/Golden Hills
N Redondo Beach/El Nido
Total Active Listings

Back to Table of Contents
Months of Inventory by Map Area Jan Feb Mar Apr May Jun Jul Aug Sep Oct Nov Dec
N Redondo Beach/Villas North 1.4 4.8 1.4 1.6 1.9 2.0 1.0 2.0
S Redondo Beach W of PCH 2.2 4.0 1.7 1.8 1.5 2.0 2.0 1.0
N Redondo Beach/Villas South 5.2 1.8 1.1 1.9 1.5 2.0 2.0 2.0
S Redondo Beach S of Torrance Blvd 1.9 2.0 2.3 2.3 1.3 2.0 3.0 3.0
S Redondo Beach N of Torrance Blvd 2.0 2.8 1.4 2.7 4.1 2.0 1.0 2.0
N Redondo Beach/Golden Hills 0.3 1.7 1.2 2.3 2.6 1.0 1.0 1.0
N Redondo Beach/El Nido 6.0 11.0 2.0 1.4 1.6 1.0 1.0 3.0
-
2.0
4.0
6.0
8.0
10.0
12.0
Jan Feb Mar Apr May Jun Jul Aug Sep Oct Nov Dec
2015 Months of Inventory by Map Area
N Redondo Beach/Villas North
S Redondo Beach W of PCH
N Redondo Beach/Villas South
S Redondo Beach S of Torrance Blvd
S Redondo Beach N of Torrance Blvd
N Redondo Beach/Golden Hills
N Redondo Beach/El Nido

Back to Table of Contents
Months of Inventory Year-to-Year Jan Feb Mar Apr May Jun Jul Aug Sep Oct Nov Dec
2013 2.6 3.0 1.9 2.3 2.0 1.8 1.9 2.0 2.0 2.2 2.8 1.6
2014 2.6 3.2 1.9 2.0 2.5 2.1 2.0 2.3 2.2 1.8 2.1 1.2
2015 2.1 2.7 1.5 2.0 1.8 2.0 1.0 2.0
-
0.5
1.0
1.5
2.0
2.5
3.0
3.5
Jan Feb Mar Apr May Jun Jul Aug Sep Oct Nov Dec
2015 Months of Inventory Year-to-Year
2013
2014
2015

Recap & Outlook for September
What happened to Redondo Beach real estate activity in August??? The MLS reports negative single and digit numbers posted for several major data points. Given the year-over-year stats are somewhat similar perhaps we give this highly-coveted cozy beach community a reprieve and credit this behavior to an end-of-summer trending pattern, yes? Hmmm? In the news… According to C.A.R., “Statewide sales were above the 400,000 mark for the fifth straight month” and “sales of condos and townhomes were up nearly 10 percent from last year.” (http://www.car.org/newsstand/newsreleases/2015releases/august2015sales?view=Standard) To discuss how I can be of service to you, please give me a call today. – I look forward to hearing from you soon!
Back to Table of Contents
Month-to-Month Comparison July 2015 Aug 2015 Delta (qty) Delta (%) Increase Decrease
Total Sales 99 75 -24 -24.2%
Median Sales Price 876,000 795,000 (81,000) -9.2%
Median Days to Sell 33 35 2 6.1%
Listings 147 137 -10 -6.8%
Sales/Listing Ratio 67.3% 54.7% -12.6% -18.7%
Months of Inventory 1.0 2.0 1.0 100.0%
Monthly Comparison Year-to-Year Aug 2014 Aug 2015 Delta Delta Increase Decrease
Total Sales 74 75 1 1.4%
Median Sales Price 809,000 795,000 (14,000) -1.7%
Median Days to Sell 35 35 0 0.0%
Listings 192 137 -55 -28.6%
Months of Inventory 2.3 2.0 -0.3 -13.0%

Serving South Bay Home Buyers and Sellers Since 2001
RE/MAX Top 4 Team in California – 2012
RE/MAX 100% Club - 2011
Shorewood Realtors Top 5% in Overall Sales 2001-2006, 2008-2010
Back to Table of Contents
About
Hady Chahine…

The information being provided by CARETS (CLAW, CRISNet MLS, DAMLS, CRMLS, i-Tech MLS, and/or VCRDS) is for the visitor’s personal, non-commercial use and may not be used for
any purpose other than to identify prospective properties visitor may be interested in purchasing. Any information relating to a property referenced on this web site comes from the Internet
Data Exchange (IDX) program of CARETS. This web site may reference real estate listing(s) held by a brokerage firm other than the broker and/or agent who owns this web site. The accuracy
of all information, regardless of source, including but not limited to square footages and lot sizes, is deemed reliable but not guaranteed and should be personally verified through personal
inspection by and/or with the appropriate professionals.
Back to Table of Contents
Listings MLS BLOG Website