Embed Size (px)
Citation preview

ODDS OF SELLINGABSORPTION RATE PRICING/DEMOGRAPHICS OF BUYERS FOR LISTINGS
“There are only a certain number of houses that will sell in any market in any given period of time. Let’s see if your house will be one of
them.”

ODDS OF SELLING: ABSORPTION RATE PRICING
If 12 homes sold in the last 12 months in a given market that means that the market will absorb 1 house per month on average. If there are 10 homes currently on the market there is a 10 month supply. A 6 month supply is a balanced market, less is a sellers market and more is a buyers market.
How to Calculate Absorption Rate:
Find your search area, criteria, price range, target market segment, time for analysis The longer the time the better the overall average
Shorter times give the latest trends
Detailed searches give more accurate results
How many closed transactions occurred in last 12/6/3 months? You find this in the MLS
Houses not sides of transactions

ODD OF SELLING: ABSORPTION RATE PRICING
Divide the total closed by the time period.
# homes closed in the last 12 months
# / 12 = # homes closing on average every month
# homes closed in the last 6 months
# / 6 = # per month on the last 6 months
Determine how many houses for sale at this time?
Divide the number of houses for sale by the average closed per month equals the number of months supply of houses
Our entire MLS SOLD: 6 months 3,820 homes sold = 637 per month
Our TOTAL MLS ACTIVE: 4,132/637 = 6.48 months inventory Zone 400
674 sold = 112 per month
703 (total active in 400)/112 = 6.3 months inventory
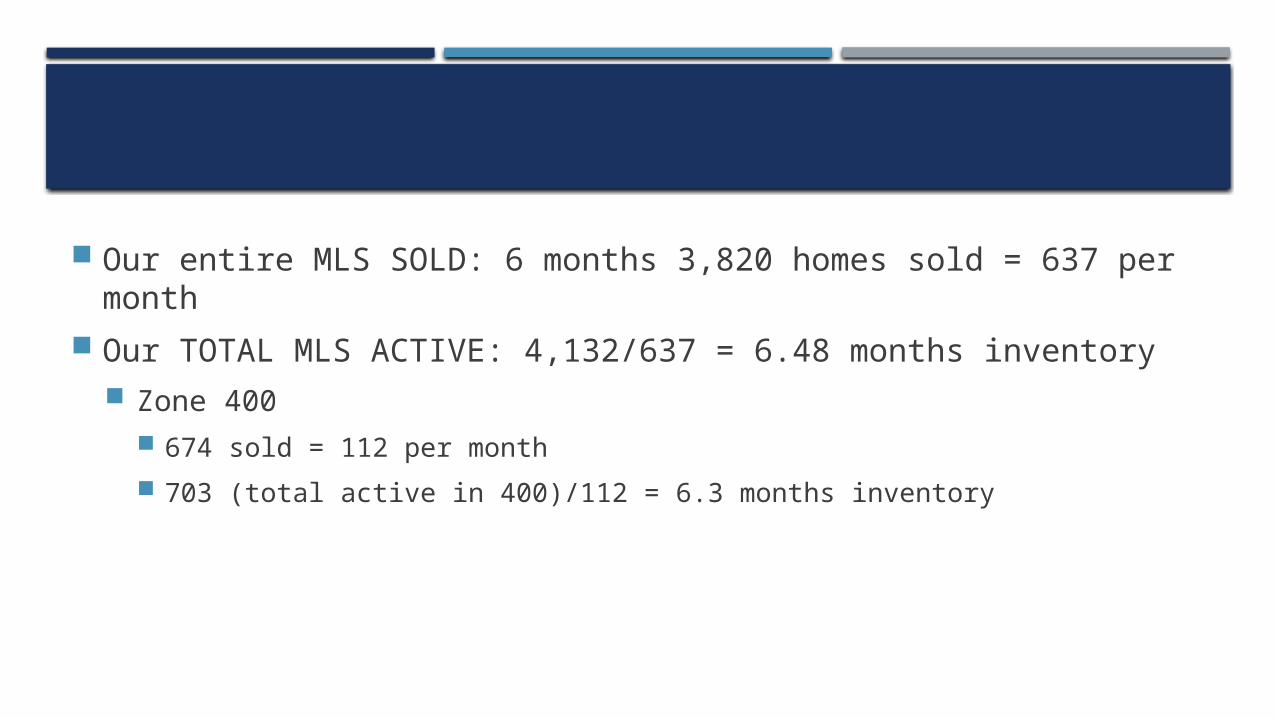
ABSORPTION RATE MARKET TREND
Criteria for search:_________________________________________________________________
Closed Transactions in Past: 12 Months 6 Months 3 Months
Enter # of Closed Transactions ___________ ___________ ___________
Average Homes Sold Per Month ___________ ____________ ___________
Currently Active in MLS ___________ ___________ ___________
Month’s Supply of Houses ___________ ___________ ___________
As long as NO OTHER HOUSES ENTER THE MARKET!!

HOW TO CALCULATE THE ODDS OF YOUR HOUSE SELLING
To calculate the Odds of Your House Selling you must research your MLS to find the following:
Determine your search area, price range, target market segment, and time for analysis Six months is a perfect search time. Longer search times
give incorrect data because houses drop off the market and return with a different agent and MLS number
How many closed sales occurred in the last 6 months?

HOW TO CALCULATE THE ODDS OF YOUR HOUSE SELLING
Determine the total number of homes that entered the market for sale in the last 6 months including the current actives. This would include homes that were listed in the last 6
months and have expired, withdrawn, and closed Include the current listings no matter when they were listed.
Divide the number closed by the number of listings that were placed on the market.

ODDS OF YOUR HOUSE SELLING: EXAMPLE
1. Search MLS for all sold homes in the school district between $250,000 -$275,000 in the last 6 months.
2. 11 were closed in the last 6 months
3. 23 entered the MLS and were sold, expired, withdrawn or still on the market, taking out the pendings
4. 11 divided by 23 (11 sold plus 12 entered in MLS that didn’t sell, or still on market) = 48% of the homes that entered the market sold!
5. 52% chance of NOT selling. POWERFUL DATA!


ABSORPTION RATE POSITIONING
Seller: _________________________________________________________________
Address: _______________________________________________________________
Property Description: ____________________________________________________
Profile Buyer for this property: _____________________________________________
Step #1: Define the “Playing Field” through “Profile Buyer’s Eyes” – Using RPR/CBx
–Area, neighborhood, zip code, price range, lakefront, schools, etc.

RPR: REAL ESTATE PROPERTY RESOURCE
Fed data from MLS
FREE
Access at www.narrpr.com : Fundamentals of RPR
Let’s take a look: Buyer demographics, evaluating RVM (Realtor Valuation Model)
http://www.narrpr.com/neighborhoods/ks/andover/67002/52001800-summary.aspx
Create a report: https://www.youtube.com/watch?v=c5BTq0QCPyo
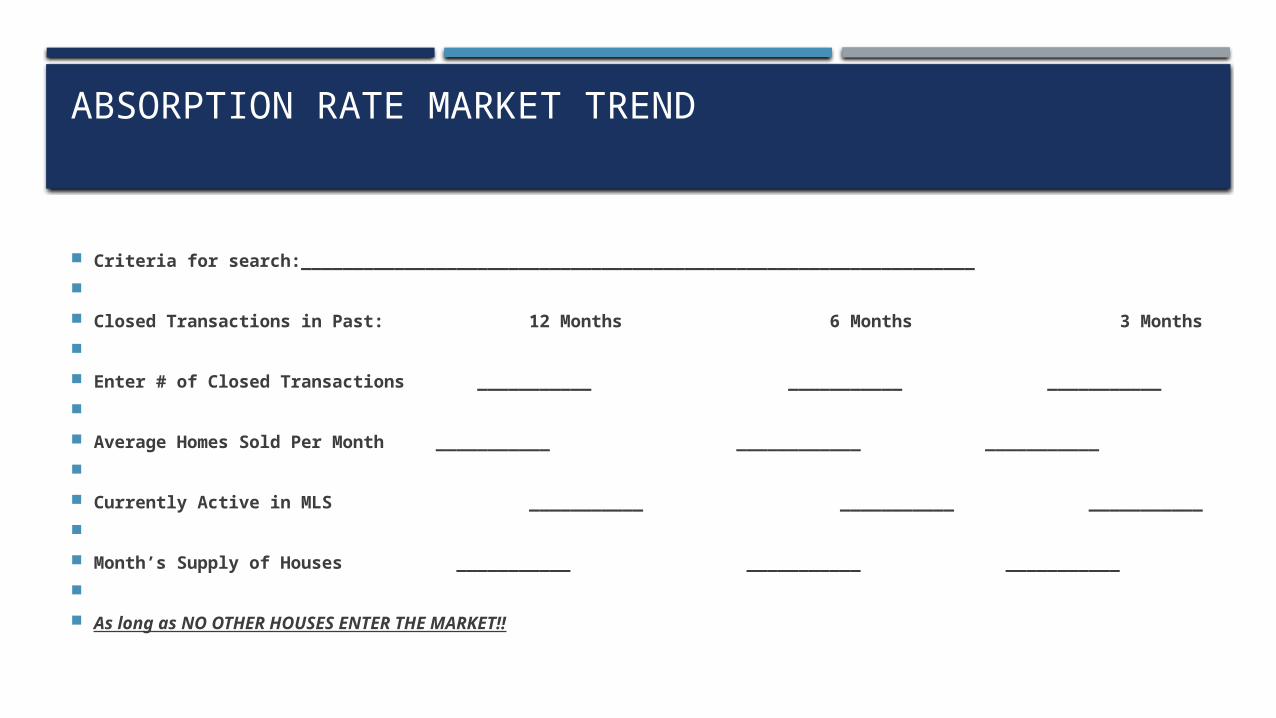
ABSORPTION RATE POSITIONING
Step #2: Sold properties in the past 12 months: _______
Step #3: Sales rate (absorption rate) per month: _______
Step #4: Number of properties currently for sale: _______ (+ your house!) = ________
Step #5: At current sales rate, time required to sell all of current properties: ____months

ABSORPTION RATE POSITIONING
Step #6: Odds of Selling within 30 Days through “Profile Buyer’s Eyes”
____ (Monthly sales rate #3) ÷ ____ (properties for sale # 4) = _____% Odds of Selling in 30 Days
Step #7: Positioning your property vs. the competition through “Profile Buyer’s Eyes”:
Condition: ___________________________________ Rating: (1-10)_________
Location: ____________________________________Rating: (1-10)_________
Size (Home site and house): _____________________Rating: (1-10)_________
Features/Amenities: ___________________________Rating: (1-10)_________
Price: _______________________________________Rating: (1-10)_________

ABSORPTION RATE POSITIONING
Step #8: Market positioning through “Profile Buyer’s Eyes”
100% Odds of Selling within 30 Days = Position your house in the Top ______
100% Odds of Selling within 60 Days = Position your house in the Top ______
100% Odds of Selling within 90 Days = Position your house in the Top ______
As long as no other houses change their price and no new houses enter the market!

THE POND

POWER QUESTIONS
By what date do you need to move?
By what date do you want to have your house under a sales contract?
Do you know how long it will take to go from Contract to Closing?
Based on the Absorption Rate, how long could it take to sell your house?
Based on the Absorption Rate, where do you think we should position your house?
Do you think that positioning will get you where you want to go on time?
What position in the market will it take to get you where you want to go on time?
If your house doesn’t sell in the time frame you have described to me, what is you plan B?

CSS DATA

GO TO MARKET STATISTICS/ENTER CRITERIA

SEARCH BY MLS ZONE OR ZIP CODE
Click on “Current Trend” or “Market Showing Report”

PARAGON CMA
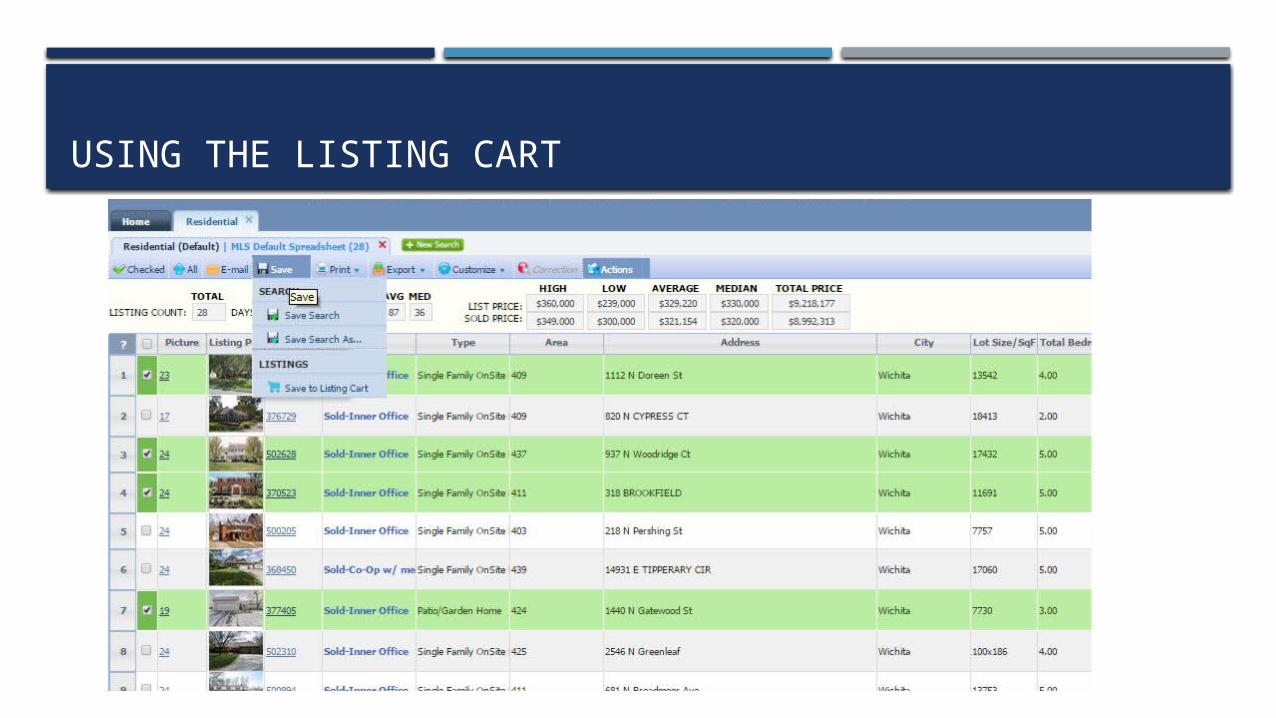
USING THE LISTING CART

SELECT LISTING CART/CREATE NEW ONE

FOLLOW THE WIZARD
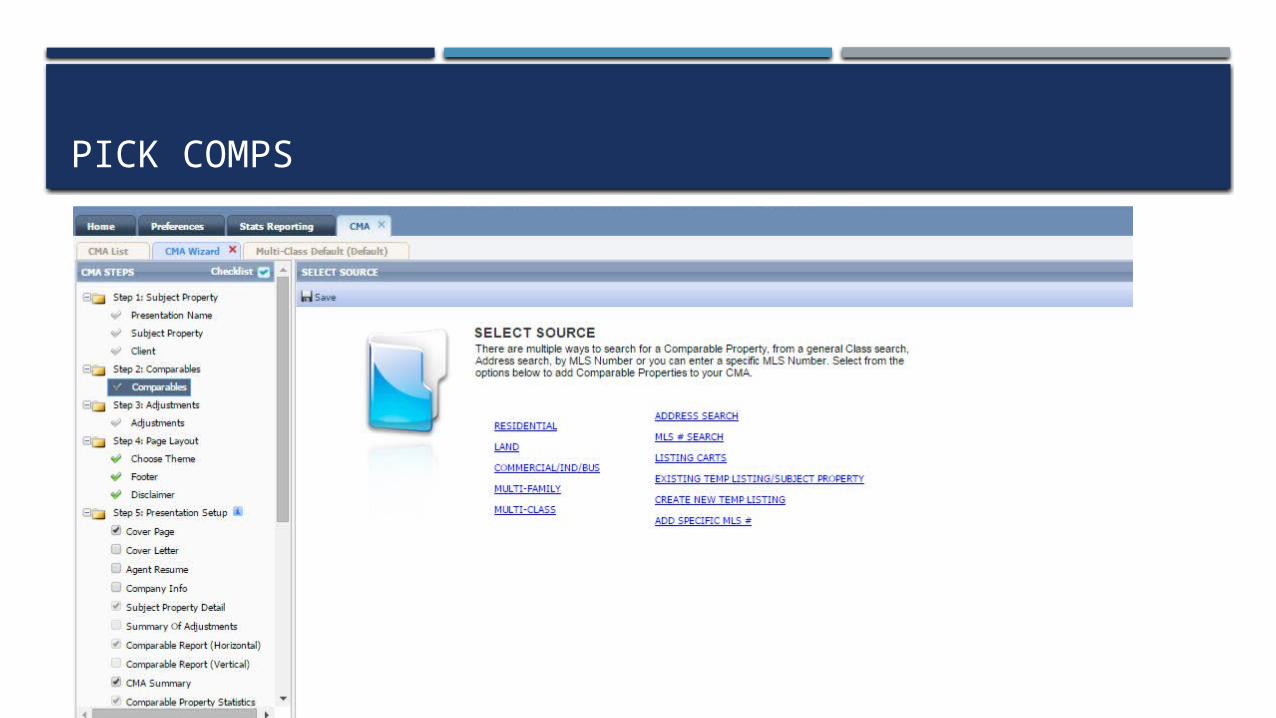
PICK COMPS

POINTERS

USE THE LISTING CART
Makes finding and searching for properties simple
Can save in titled listing cart at anytimeCan access saved data or change data easily