Embed Size (px)
DESCRIPTION
Ukraine – private sector competitiveness ap ppt aug2014
Citation preview

Ukraine – private sector competitiveness
Angela Prigozhina


What is Competitiveness?
3
It is about creating the conditions to allow firms and industries to compete
successfully in the global marketplace, while also raising the standard of
living of people in the home country, spurring the creation of sustainable,
higher-value-added jobs
Key issues:
What impacts competitiveness Determinants of competitiveness What drives sustainable growth What drives export growth How to achieve sustainable export growth How to avoid “natural resources” curse and move to knowledge led growth How to create better paid jobs How to make growth inclusive How to avoid middle income trap

Source: Michael Porter http://www.isc.hbs.edu/competitiveness-economic-development/frameworks-and-key-concepts/Pages/drivers-of-competitiveness.aspx

Competitiveness -
• Sound macroeconomic policies and stable political and legal institutions are necessary but not sufficient conditions to ensure a prosperous economy
• Competitiveness, based on the productivity with which nations produce goods and services, is rooted in a nation’s microeconomic fundamentals
Michael Porter


In other words…Competitiness = productivity
• Business environment • Business sophistication• Access to markets & local
markets development (value chains, access to infrastructure, financial access and depth, knowledge/skills, competition)
• Institutions and governance• Macroeconomic & political
stability• Endowments (natural resources,
location, population and country size)
Productivity ultimately depends on improving the microeconomic capabilityof the economy and the sophistication of local competitionMacroeconomiccompetitiveness sets the potential for high productivity, but is not sufficientEndowments create a foundation for prosperity, but true prosperity is created by productivity in the use of endowments

In other words
Basic conditions
Efficiency enhancers
Business sophistication
Business environment
Public sector services and social
infrastructure
• Macroeconomic stability• Institutions• Infrastructure• Natural resources
• Skills/Knowledge• Labor efficiency• Technological
readiness• Access to finance• Access to markets
(value chains, suppliers’ efficiency)
• Market size/scale• Location
• Business innovation• Business sophistication • R&D and academia-
business linkages• ICT and internet usage• Creativity index etc
• Openness & trade• Entry/exit• Cost of doing
business• Property
rights/IPR • Competition
• Rule of law• Enforcement and
Judicial system • Infrastructure
(registration, innovation, social services)
• Access to information/data

WEF-GCR 2013/2014

Ukraine vs selected countries
SourceL A Vision for Ukraine in the World Economy: Defining a Trade Policy Strategy that Leverages Global Opportunities, by Bernard Hoekman European University Institute and CEPR , Jesper Jensen, Director, Jensen Analysis; David Tarr, Consultant and former Lead Economist, World Bank, September 2013

Doing Business Ranking
SourceL A Vision for Ukraine in the World Economy: Defining a Trade Policy Strategy that Leverages Global Opportunities, by Bernard Hoekman European University Institute and CEPR , Jesper Jensen, Director, Jensen Analysis; David Tarr, Consultant and former Lead Economist, World Bank, September 2013

Ukraine innovation led growth
IRINA TARANENKO, Innovation led competitiveness in the global economyhttp://repec.mnje.com/mje/2013/v09-n01/mje_2013_v09-n01-a21.pdf

Business growth constraints WEF-GCR 2013/2014

Sustainable high growth – LMIC to HIC?
SourceL A Vision for Ukraine in the World Economy: Defining a Trade Policy Strategy that Leverages Global Opportunities, by Bernard Hoekman European University Institute and CEPR , Jesper Jensen, Director, Jensen Analysis; David Tarr, Consultant and former Lead Economist, World Bank, September 2013

Lower MIC – 50

Avoiding MIC trap…!
The path to high income

Countries aim to replicate success stories

Economic complexity & growth
Country Rank
Economic ComplexityIndex 2012
Japan 1 2.23517
Switzerland 2 2.00625
Germany 3 1.89482
Sweden 4 1.78978
South Korea 5 1.73625
Czech Republic 6 1.67932
Finland 7 1.64122
United Kingdom 8 1.63351
Austria 9 1.63339
Singapore 10 1.61342
Ukraine 2012Ukraine 2008
3842
0.7194660.5590
Serbia 40 0.681472
Turkey 41 0.617748
Armenia 44 0.544877
Moldova 60 0.22856
Chile 72 -0.0293834
Georgia 78 -0.148689
Azerbaijan 96 -0.460268
South Sudan 144 -2.90609
http://atlas.media.mit.edu/static/atlas/pdf/AtlasOfEconomicComplexity_Part_II.pdf
Hausmann, Hidalgo & al – The Atlas of Economic Complexity – mapping path to prosperity, 2008 Economic complexity is the composition of a country’sproductive output and reflects the structures thatemerge to hold and combine knowledge (explicit+tacit).• China, India and Thailand are countries with economies
that are remarkably complex, given their current level of income, and are expected to catch up faster than other developing nations.
• Belarus, Moldova, Zimbabwe, Ukraine and Bosnia-Herzegovina - five countries where the current level of income is dramatically lower than what one would expect given their productive capabilities.
Two regions of the world where the potential of per capitagrowth is higher are East Asia and Eastern Europe

Increasing Economic Complexity Drives Exports and Development
20
Development Impact of Manufacturing
Manufacturing Evolution in Thailand
1975 1990 2009
Economic Complexity “Map” shows growth of complex clusters Increasing inter-industry linkages and complementarities are mechanism for
multiplier and spillover effects, illustrate expanding country capabilities Black Squares indicate sectors with exports showing revealed comparative
advantage; illustrates steady export diversification

Costa Rica export evolution
Top 10 exports from Costa Rica, 2004 vs 2010
0
5
10
15
20
25
2004 2010
Source: WEF, GCR 2012/2013
Lessons: • Openness and trade facilitation (FTA, removal of barriers to trade) • Global value chain inclusion and SME internationalization• Technology adoption and business innovation• Knowledge/Capital intensive FDI and R&D (knowledge and technology transfer)

Export structure by marketsUkraine versus Georgia 2013

Ukraine export/import concentration

The Product S pace : is the network summarizing global similarities in the productive knowhow required by products. Nodes represent products and are colored according to communities using the color legend (above). Node size is proportional to global trade in that product and links connect products that tend to be exported by the same countries. The footprint of a country on the product space is indicated using square nodes with thick black outlines. These are the goods that the country exports with RCA>1

Export Opportunity Spectrum: These two figures summarize the position of a country in the product space. Here, bubbles represent a community of products and their size is proportional to global trade in that product community. The fraction of each bubble that is shown in white represents the fraction of all goods in that community for which the country has an RCA>1. In both charts, the vertical axis shows the average complexity of the products in that community that the country is not currently making. The horizontal axis on the left figure shows the distance between the country’s current productive structure to each one of the product communities. The horizontal of the right figure displays the opportunity gain, which is a measure of the number of new products that become closer if the country were to move into that community. For both the distance and opportunity gain measures, only the products that are more complex than the country’s complexity level are considered. The dashed grey line indicates the country’s level of economic complexity measured using the Economic Complexity Index (ECI).
UKRAINE
POLAND


Source: Michael Porter – Economic reform strategy for Vietnam, 2008

Rodrik 2007: Growth Diagnostic Decision Tree

29
Competitiveness growth framework – combination of?
• Strengthening comparative advantages and productivity growth – Micro-foundation of competitiveness (Porter)
– Industry-specific approach (Mc Kinsey model for competitive industries)
– Institutions (Rodrik and Sabel)
– Economic complexity, technological and knowledge led growth (Hausmann)
• Export led growth as part of a more “generalist” approach (Lucas, Romer, Krueger, Bhagwati, etc.)
• Washington Consensus (liberalization, privatization, democratization and fiscal austerity)
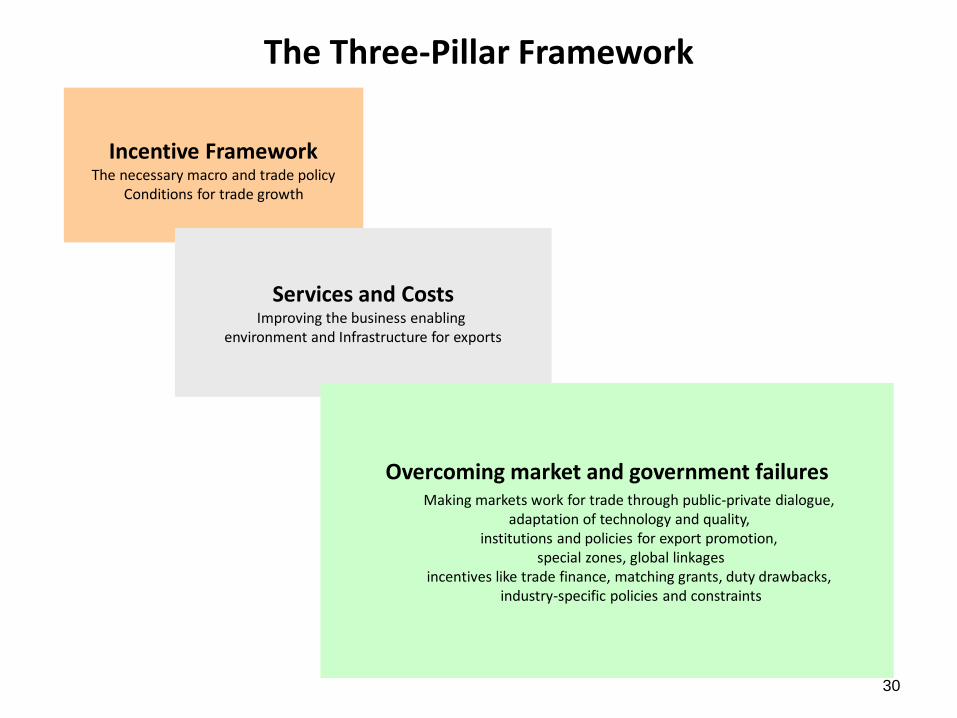
30
Incentive FrameworkThe necessary macro and trade policy
Conditions for trade growth
Services and CostsImproving the business enabling
environment and Infrastructure for exports
Overcoming market and government failuresMaking markets work for trade through public-private dialogue,
adaptation of technology and quality, institutions and policies for export promotion,
special zones, global linkagesincentives like trade finance, matching grants, duty drawbacks,
industry-specific policies and constraints
The Three-Pillar Framework

31
First generation reforms yet to be completed –horizontal reforms as a must!
– Macroeconomic stability – Removing protectionist measures – Opening economy – removing barriers to trade (soft
and hard) – Improving functioning of factor markets (capital, labor,
land, technologies) – Strengthening the regulatory and administrative
environments (deregulation, tax administration reform)
– Enhancing public services and institutions (judicial and anti-corruption reforms, rule of law, social services and infrastructure)
– Investing in trade infrastructure including transport, energy, and trade logistics

Second generation reforms - enhance business environment + strengthen comparative advantages &
facilitate export & innovation to foster sustainable growth
Competitive Industries is:
Nurturing industries with good governance and checks and balances
Creating healthy competition with safeguards
Creating public goods
Leadership from private sector and championing from public sector
Employing and flexibly adapting multiple tools and frameworks
Scaling up success and shutting down failure in a nimble fashion
Do trade diagnostic and competitive industries assessment, define growth poles and fast growth industries with comparative advantages – COMPETITIVE INDUSTRIES
Competitive Industries is NOT :
× Picking winners
× Helping rent seekers
× Central planning
× Government in control
× Unitary, cookie-cutter approach, whether clusters or any other
× Once-and-for-all policy formulation without exits or capacity to scale

Location of value added in the value chain
33Source: Gary Gereffi, presentation at OECD workshop, September 2010.

Competitive Industries – Filling the “missing middle”, speaking the language of the private sector
34
“We found that we can deliver very fast when we concentrate on the sectors that count”(YB Senator Dato’ Sri Idris Jala, Minister in Prime Minister’s Office and CEO, PEMANDU, Government of Malaysia)
Macro-stability, investment climate reforms and innovation policies
Mentoring, networking and financing support to grass roots and entrepreneurs
INDUSTRY LEVEL
FIRM LEVEL
ECONOMY WIDE
Multi-sectoral interventions bringing together public and
private sectors to unlock value chains and clusters

35
Singapore
Thailand
Germany
Aircraft
Servicing Avionics
Basic Food
Processing
Advanced
Design and
Food
Packaging
Services
Auto
manufactu-
ring
Automotive
design &
manufacturing
excellence
25 years ago…. …Today
Competitive industries and innovation

Mission impossible?
“Industrial Policy is any type of intervention or government policy thatattempts to improve the business environment or to alter the structure ofeconomic activity toward sectors, technologies or tasks that are expectedto offer better prospects for economic growth or societal welfare thanwould occur in the absence of such intervention.”
• Brazil – Plano Brasil Major
• China - Plan for National Strategic Emerging Industries• India – National Manufacturing Policy• Japan – Industrial Structure Vision• Netherlands – Top Sectors• UK – Plan for Growth and Industrial Strategy• US – American Recovery and Reinvestment Act
Structural reforms = combination of horizontal and vertical reforms ???

1. Pursue a balanced approach to interventions: markets can malfunction both when governments interfere too much or too little
2. Undertake coordinated and integrated action: prioritization as an iterative process amongst relevant stakeholders
3. Leverage analytics: to develop a collective judgment on potential sunrise sectors
4. Target activities not sectors: corrective support to address specific market failure
5. Activities must have clear spill over and demonstration effects:activities should have the potential to crowd in others
6. Some prioritized activities will fail: failure is part of innovation. Indeed policies should have sunset clauses to avoid subsidizing failure.
‘What’ is an effective industrial strategy?Global experience shows no ‘silver bullet’, but some lessons do exist
37

Dimensions of industrial policy
• Aim: Industrialisation, productivity, sector growth, employment, social welfare, distribution.
• Target group: Sector (or technology, input, or stage of the value chain), firms or clusters?
• Rationale: Underlying philosophy that justifies active industrial policy (market failures, capacity building etc).
• Orientation: Is policy horizontal/functional or vertical/selective? Is targeting strategic or in response to market pressures? Is intervention time-limited or longer-term? Conditional or unconditional? Does policy work with existing comparative advantage or explore new areas?
• Policy domain: Product or factor markets – labour, capital, land and technology. Role for policies to develop entrepreneurship or facilitate coordination or the creation of new networks?
38

Two-way classification of strategic industrial policy
39

Cluster policies
Investment promotion
(FDI)
Public procurement
Fostering green
growth
New industrial policy in practice
40

Typology of instruments
Domain Horizontal Policies Selective Policies
Product markets
Competition and anti-trust Indirect tax Product market regulation Exchange rate policy
National Champions Nationalisation/privatisation Output subsidies/state aids Export promotion Price regulation (e.g. pharma) Public procurement Trade policy Car scrappage
Labour and skills Skills and education policies Training subsidies Wage subsidies Income and employment tax Management advisory services Labour market regulation
Targeted skills policies Apprenticeship policies Sector-specific advisory services
Capital markets Loan guarantees Corporate tax/capital allowances Macro/financial stability Financial market regulation
Strategic Investment Fund Emergency Loans State Investment Bank Inward investment promotion
Land Planning regulation Land use planning
Enterprise zones Place-based clusters policy Infrastructure
Technology R&D tax credit Science Budget IPR regime
Green technology Lead Markets Public procurement for innovation Patent Box Selective technology funding Centres of expertise
Systems/Institutions Entrepreneurship policy Scenario planning Distribution of information Overall competitiveness strategy
Indicative planning Foresight initiatives Smart specialisation Sectoral competitiveness strategy Clusters policy

What have we learned?
42
Embeddedness Carrots & sticks Accountability
(Rodrik, 2008)
“The emerging consensus is that the risks associated with selective-strategic industrial policy can be minimised through a ‘soft’ form of industrial policy, based on a more facilitative, coordinating role for government, consistent with the systems approach......
“The goal of ‘soft’ industrial policy is to develop ways for government and industry to work together to set strategic priorities, deal with coordination problems, allow for experimentation, avoid capture by vested interests and improve productivity.”


• Georgia – key 1st generation reforms successfully implemented, but no new jobs and inclusive growth;
• Further economic transformation requires factor markets enhancement and development of new/existing industries for jobs creation and export growth
• Georgia 2020 Economic reform strategy adopted with the focus on private sector competiveness, access to finance and enhanced skills/knowledge – combination of horizontal reforms with smart policies to address market failures
Georgia’s high growth potential industries can be differentiated into: Resource-Based Locomotives, i.e. already existing well-performing export sectors with
significant performance improvement potential; Quick Wins, i.e. sectors that are within Georgia’s reach to improve and that are not yet
being tapped into; and Big Prize, i.e. industries that are farther from Georgia’s current capacity frontier but have
a potential to bring in significant value added to economic growth
Competitive industries -where to start?Georgia Example (World Bank Program 2013-2014)
Which sectors?
New
Quick Wins
Big PrizeExisting

Resource-Based
LocomotivesQuick Wins Big Prize
Agribusiness (including fruits
and vegetables, hazelnuts,
wine and agro processing)
Tourism
Mining
Metal Processing
Hydropower
Chemicals
Light Manufacturing/ Apparel
Trade Logistics
Services (ICT, business services(accounting,
auditing, consulting/engineering),
entertainment/movie production),
Pharmaceuticals/bio-tech
Precision Machinery, Automotive & Industrial
Design,
Electronics and Electrical appliances/machinery
Improve: Access to finance
Information and communication
Export promotion
Quality upgrading & technological advancement (processing, infrastructure)
Value chain integration - support with development of linkages between small and large actors
Strengthen professional organizations/associations
Diversify in new sectors (textile/light manufacturing)
Mobilize FDIs to develop/upgrade other sectors
Advance trade/transportation/logistics
Compete on quality and price
Customize and service niche markets in can be key for further development of light manufacturing in Georgia
Enhance innovation & entrepreneurship
Follow flagship FDIs to integrate into global value chain
Develop special mechanisms and instruments to promote exports and SMEs in new higher value added products/services (ICT, manufacturing)

Key success factors for an economic development prioritization strategy
[1/3]
Parameters Examples
Adopt an economic development mindset
Korea Singapore
Infrastructure such as highways and industrial estates, as well as export promoting institutions and long term lending institutions to support the industrial development
International network of industrial assets to constantly create new opportunities for domestic firms. MNCs’ R&D labs heavily subsidized by the government.
Build a shared vision. Working: Top-down (federal and state
agencies) Bottom-up (industry
associations, SMEs, grassroots agencies)
Korea Taiwan Singapore
Private sector controlled by the government
Private sector controlled by the government
Industry 21 visionTechnopreneurship 21 Plan for entrepreneurship
Undertake stakeholder alignment: Various ministries and
boards Industry associations Multi/bilateral agencies Civil society etc.
Korea Singapore Thailand
Insightful elites and competent economic policymakers involved in the process
Economic Development Board
Jurong Town Corporation National Science &
Technology Board
Nine industry-specific non-profit institutes created by the government to facilitate co-ordination among stakeholders (steel, food, textile, etc.)
1
2
3
46

Parameters Examples
Simultaneously pursue broad investment climate initiatives & sector-specific reforms
Chile
Cluster: food industry, fish farming, mining, special interest tourism, global services Transversal areas: Environment and water resources, biotechnology, renewable
energies, ICT
Focus on high-impact segments and sub segments, using lenses of: Comparative advantage Genuine strategic priorities Sectors with good
governance
Korea Taiwan Chile
Continuous revision of strategic industries, currently IT and biotechnology
Technology, textile and garments machinery technology
Food industry, fish farming, mining, special interest tourism, global services
Facilitate investment financing - private capital, sovereign fund
Chile Singapore Taiwan
Agencies are responsible for matching of public grants by public funds
Economic Development Agency (CORFO)
Foundation for Agricultural Innovation
Increase of capital-driven investments to provide added potential for capability development, technology acquisition and renewal of international business practices
Special agency for FDI Investment
Commission
6
5
4
Key success factors for an economic development prioritization strategy [2/3]
47

Parameters Examples
Roll-out an overarching execution model: Autonomous project
management office Milestones and progress
reviews Put in place pragmatic
monitoring and evaluation mechanisms
Chile Indonesia
Biannual action plans, National Innovation Council, Ministerial Committee for Innovation responsible for elaboration and implementation
Industrial revitalization program dividing industries into three categories: Industries to be revitalized (export
industries) Industries to be developed (high
potential to absorb labor and earn foreign exchange)
Supporting industries (required to strengthen industrial revitalization and development)
Put in place pragmatic monitoring and evaluation mechanisms
Ireland Singapore
Guidelines from the EU due to Ireland being a fund beneficiary
Recognized globally as a leading example with strong feedback and performance measurement mechanisms
Multinational firms are well-represented in the boards of directors of the statutory boards
Key success factors for an economic development prioritization strategy [3/3]
7
8
48

Key reform objectives in Ukraine
Improved quality of life, with equal access to opportunities (information, services, infrastructure, finance) and protection of the vulnerable – shared prosperity
– High and sustainable economic growth leading to higher income – from MIC to HIC (measured as GDP per capita )
– Shared prosperity, with more and better paid jobs (GNI, personal income, employment)
– Improved quality and access to public services (including social protection) – cost of doing business, TSA, education, health, pension etc

Private sector growth factors
Macro and political stability – macro risks
Financial sector stability, access to finance and investment
Human capital
Infrastructure (hard, soft, innovative)
Business environment
Access to markets and coordination failures
Access to information

Elements of reforms
•QUALITY & PRODUCTIVITY •higher firm-level productivity (labor productivity, skills and knowledge, technologies, innovation, quality standards and controls) •increased share of sectors with higher value addition in GDP and exports •deeper and broader financial markets • improved access to markets (export – trade policy), infrastructure (public and private), finance (debt and equity), land and resources, and information (e-government, open society, domestic and international data and analysis including on export markets)•FDI /investment promotion• R&D and innovation investments •RULE OF LAW AND ECONOMIC FREEDOM •conducive business and investment climate (property rights and IPR, law enforcement, creditors rights protection, valuation, entry/exit)•Tax and policy predictability•Competition/level playing field•Alternative dispute resolution•Public-private dialogue and accountability•Anti corruption and transparency policy•QUALITY PUBLIC SERVICES AND ROLE OF THE STATE •Legislation and rule of law enforcement •Financial and other market regulation •Access to data and quality of Information•Property and other registries•Promotion policies and measures (export promotion, SME internationalization, •State intervention, state monopolies and SOE entry, management and exit policies