Embed Size (px)
Citation preview
Improving health worldwidewww.lshtm.ac.uk
Phil EdwardsLANTERNS ProjectSenior Lecturer, Department of Population Health
Does street lighting adaptation impact onroad traffic injury or crime?
The LANTERNS project is funded by the NIHR Public Health Research Programme. The views expressed here are those of the authors and do not necessarily reflect those of NIHR or the Department of Health

EconomyAusterity
Sustainability
Evidence for street lighting
Welsh BC, Farrington DP.Effects of improved street lighting on crime. Campbell Systematic Reviews 2008:13 DOI: 10.4073/csr.2008.13
Beyer FR, Ker K.Street lighting for preventing road traffic injuries. Cochrane Database of Systematic Reviews 2009, Issue 1. Art. No.: CD004728. DOI: 10.1002/14651858.CD004728.pub2.

LANTERNS Project
Local Authority collaborators’ National Evaluation ofReduced Night-time Streetlight

1. Collate information on street lighting adaptation schemes nationally
2. Statistically examine whether reduced lighting has effects on traffic collisions and crime
3. Explore public opinion on street lighting provision, and potential for reducing levels
4. Investigate whether street lighting adaptation schemes offer value for money
Project aims
METHODSControlled interrupted time series analysis

slope pre-
Monthly counts of collisions/ crime
Time (months)
slope post-
step change associated with the intervention
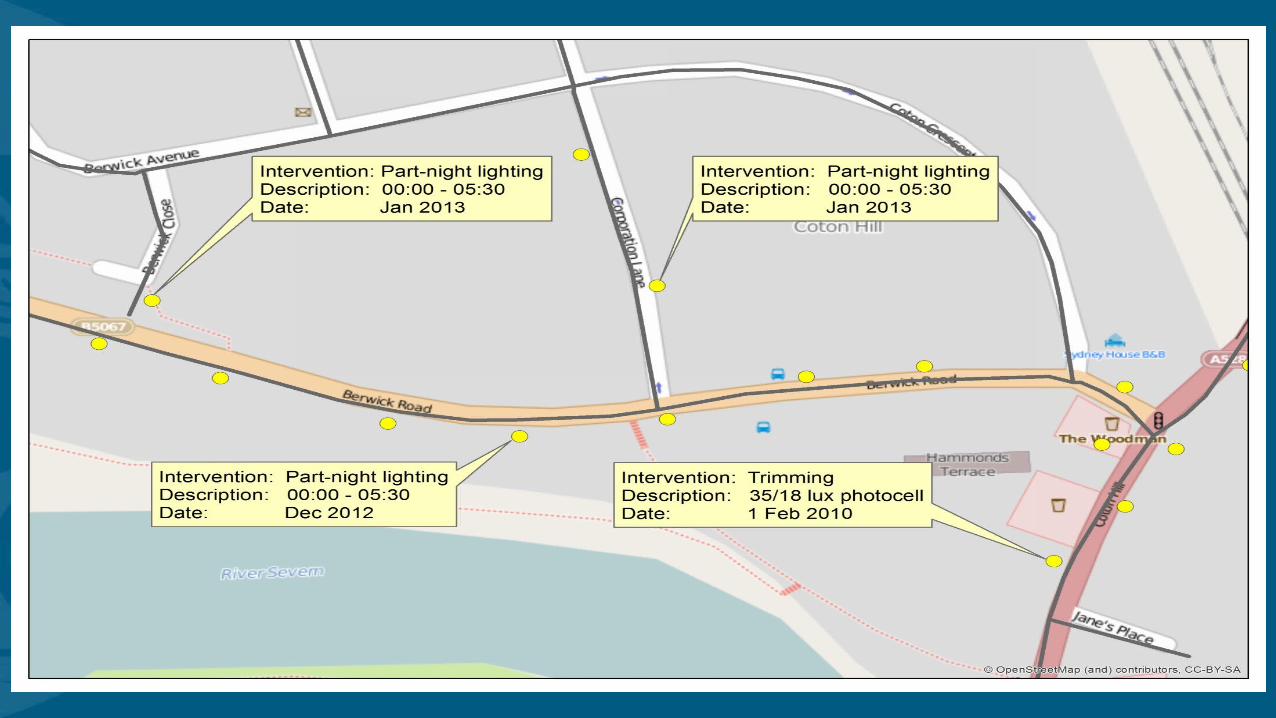
Lighting interventions introduced:•Part-night lighting•Dimming•White light/LEDs•Switch off
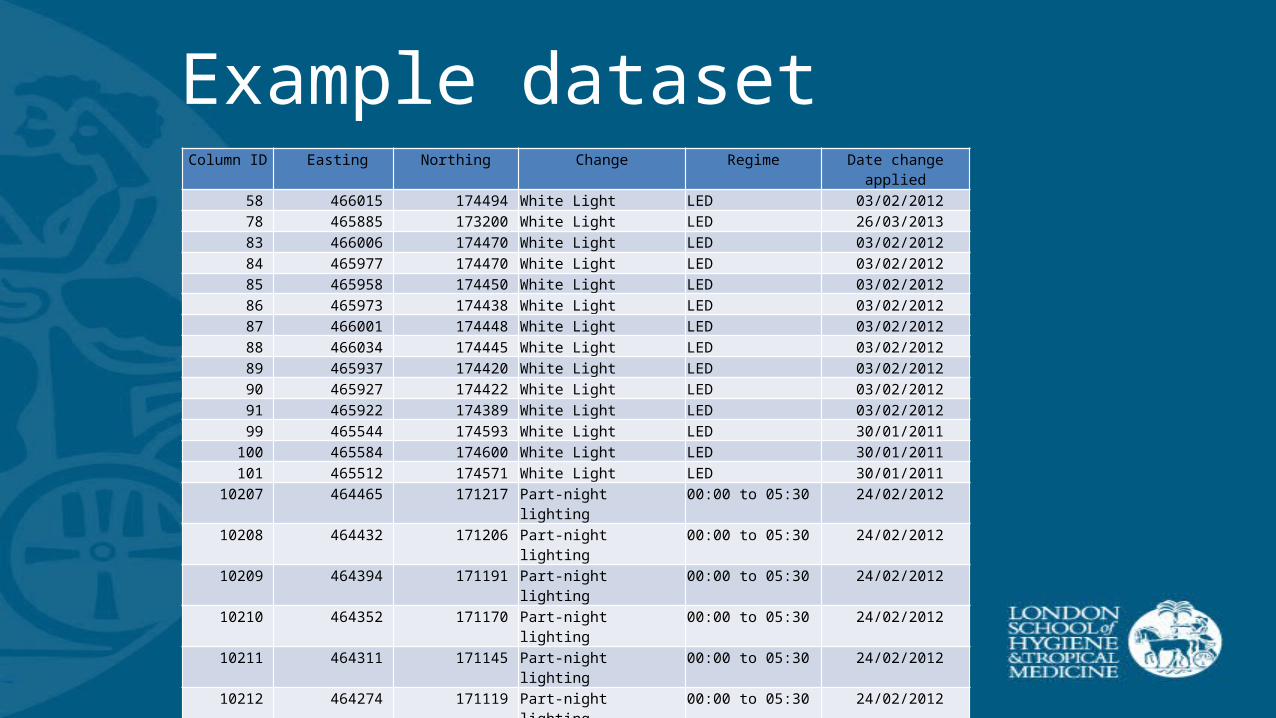
Example datasetColumn ID Easting Northing Change Regime Date change applied
58 466015 174494 White Light LED 03/02/201278 465885 173200 White Light LED 26/03/201383 466006 174470 White Light LED 03/02/201284 465977 174470 White Light LED 03/02/201285 465958 174450 White Light LED 03/02/201286 465973 174438 White Light LED 03/02/201287 466001 174448 White Light LED 03/02/201288 466034 174445 White Light LED 03/02/201289 465937 174420 White Light LED 03/02/201290 465927 174422 White Light LED 03/02/201291 465922 174389 White Light LED 03/02/201299 465544 174593 White Light LED 30/01/2011
100 465584 174600 White Light LED 30/01/2011101 465512 174571 White Light LED 30/01/2011
10207 464465 171217 Part-night lighting 00:00 to 05:30 24/02/201210208 464432 171206 Part-night lighting 00:00 to 05:30 24/02/201210209 464394 171191 Part-night lighting 00:00 to 05:30 24/02/201210210 464352 171170 Part-night lighting 00:00 to 05:30 24/02/201210211 464311 171145 Part-night lighting 00:00 to 05:30 24/02/201210212 464274 171119 Part-night lighting 00:00 to 05:30 24/02/201210213 464234 171085 Part-night lighting 00:00 to 05:30 24/02/201210214 464198 171049 Part-night lighting 00:00 to 05:30 24/02/201210207 464465 171217 Part-night lighting 00:00 to 05:30 24/02/201210208 464432 171206 Part-night lighting 00:00 to 05:30 24/02/2012

Road traffic collisionsSTATS19
– Easting and Northing of collision location– Time of day– Severity of injuries
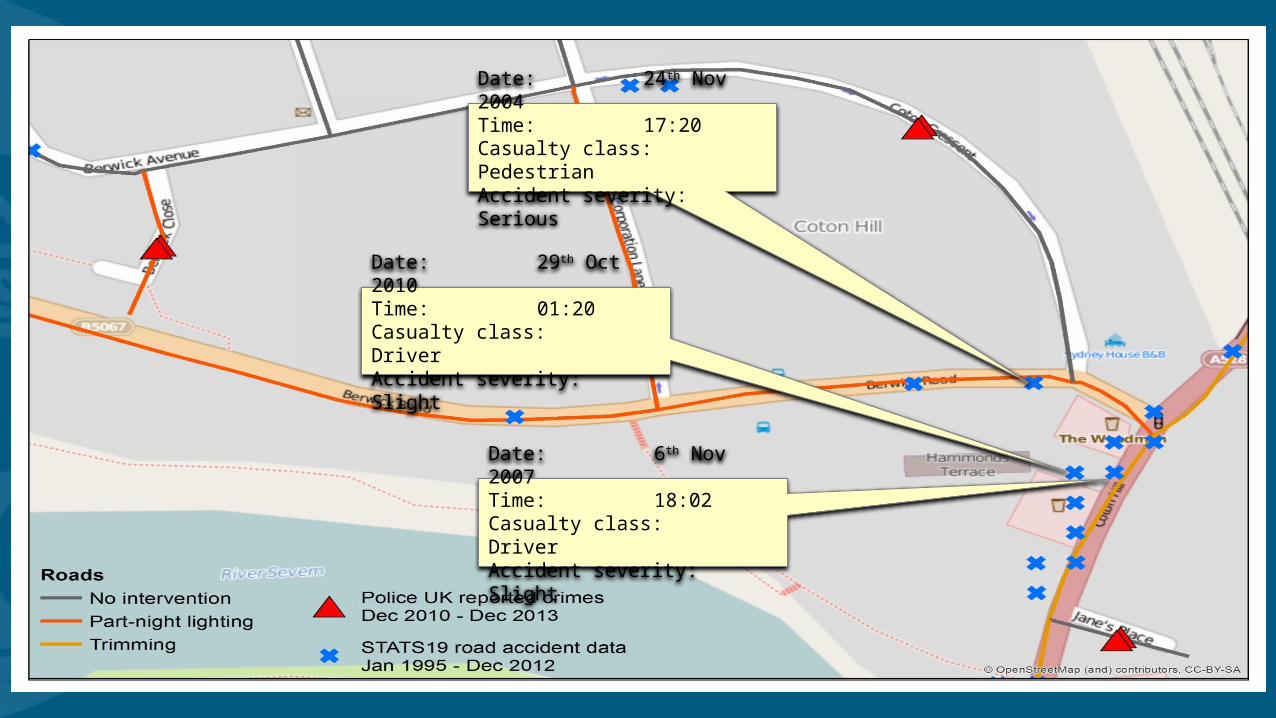
Date: 24th Nov 2004Time: 17:20Casualty class: PedestrianAccident severity: Serious
Date: 6th Nov 2007Time: 18:02Casualty class: DriverAccident severity: Slight
Date: 29th Oct 2010Time: 01:20Casualty class: DriverAccident severity: Slight

CrimePolice.uk
– Monthly counts– Burglary, Violence, Vehicle crime, Robbery


Police.uk data spatial accuracy
Tompson, L., Johnson, S.D., Ashby, M., Perkins, C., and Edwards, P. (2014). UK open source crime data: Accuracy and possibilities for research. Cartography and Geographic Information Science, 42(2), 97-111.
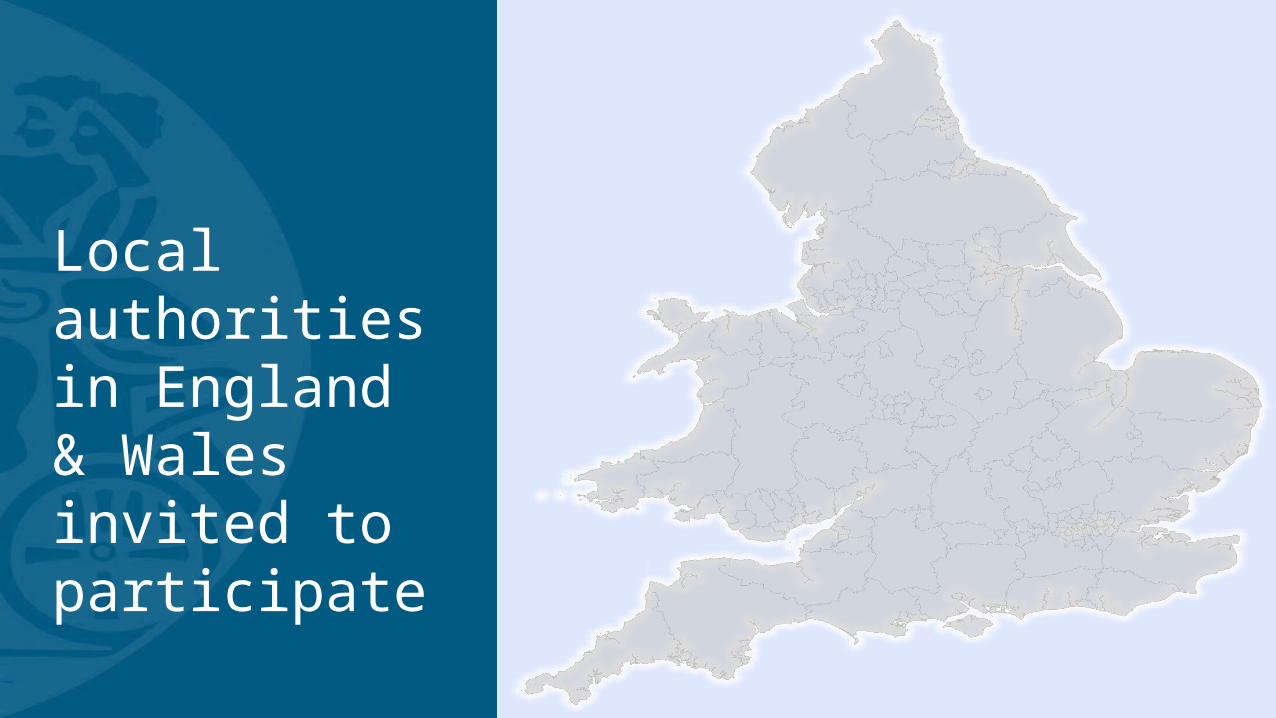
Local authorities in England & Wales invited to participate

71 local authorities contributed data

Data from 62 authorities included in analysis
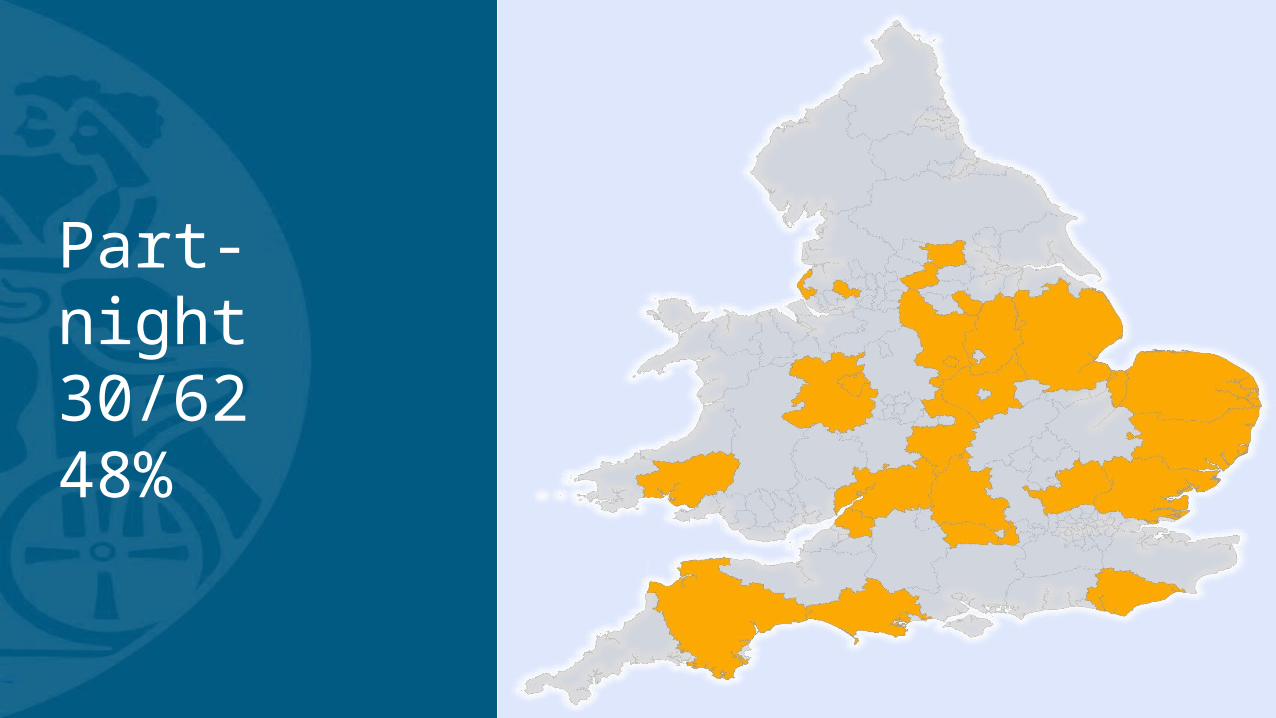
Part-night30/6248%

Dimming40/6265%

White light52/6284%

0
2000
4000
6000
8000
10000
12000
14000
16000
2000 2001 2002 2003 2004 2005 2006 2007 2008 2009 2010 2011 2012 2013
Km of road
Switch offPart-night lightingDimmingWhite light

RESULTSDoes street lighting adaptation impact on road traffic injury?

Night-time collisions on roads (2000–13):
5,670 (4%) with part-night lighting11,634 (7%) with dimming12,423 (8%) with white light 1,202 (0.7%) with switch off

Overall(I2 = 0.0%, p =0.46) 0.95 (0.84, 1.07)
0.78 (0.50, 1.22)
1.82 (0.58, 5.75)
0.80 (0.60, 1.07)
0.99 (0.63, 1.54)
1.35 (0.85, 2.12)
0.97 (0.80, 1.17)
0.96 (0.74, 1.24)
Decrease with PNL Increase with PNL 1.5 1 2
Part night light Rate ratio (95% CI)
East
London
East Midlands
Wales
West Midlands
North East
South West
Yorkshire
North West
South East
Region
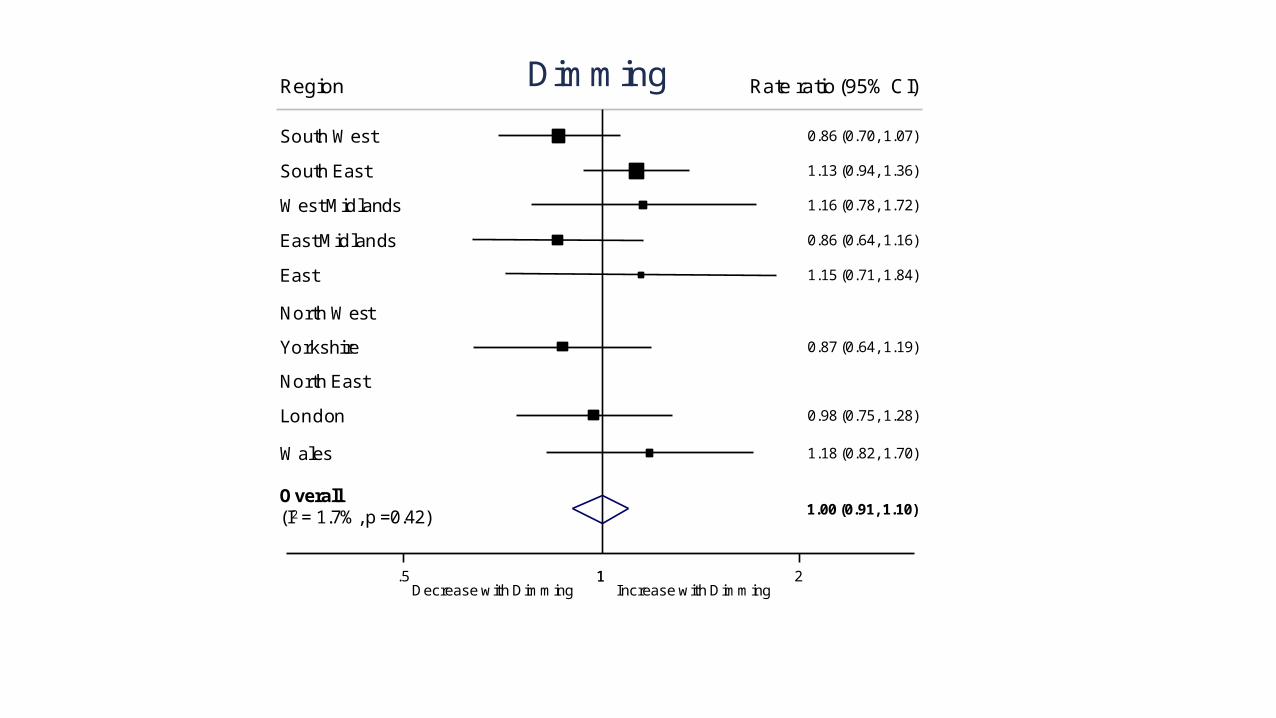
Overall(I2 = 1.7%, p =0.42)
North East
Yorkshire
Wales
London
East Midlands
South West
South East
East
North West
West Midlands
1.00 (0.91, 1.10)
0.87 (0.64, 1.19)
1.18 (0.82, 1.70)
0.98 (0.75, 1.28)
0.86 (0.64, 1.16)
0.86 (0.70, 1.07)
1.13 (0.94, 1.36)
1.15 (0.71, 1.84)
1.16 (0.78, 1.72)
Decrease with Dimming Increase with Dimming 1.5 1 2
Dimming Rate ratio (95% CI)Region
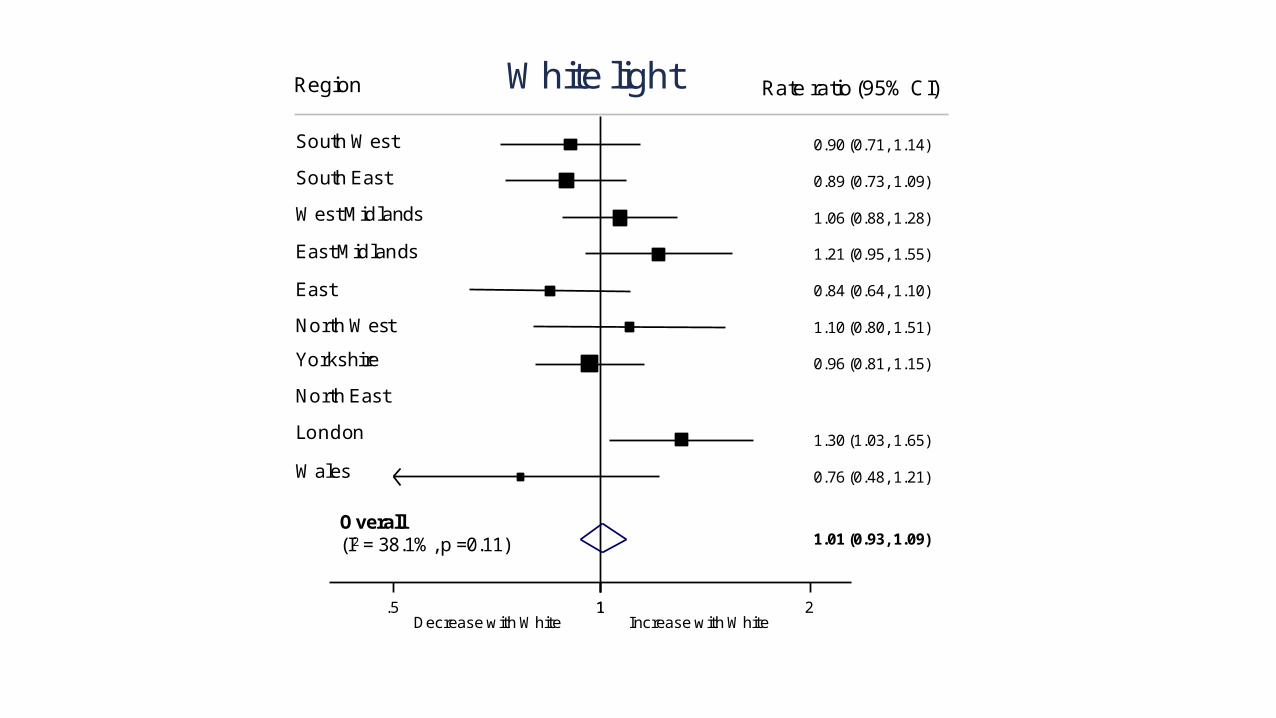
Overall(I2 = 38.1%, p =0.11) 1.01 (0.93, 1.09)
1.06 (0.88, 1.28)
0.84 (0.64, 1.10)
0.96 (0.81, 1.15)
1.10 (0.80, 1.51)
1.30 (1.03, 1.65)
0.90 (0.71, 1.14)
0.76 (0.48, 1.21)
1.21 (0.95, 1.55)
0.89 (0.73, 1.09)
Decrease with White Increase with White 1.5 1 2
White light Rate ratio (95% CI)
East
London
East Midlands
Wales
West Midlands
North East
South West
Yorkshire
North West
South East
Region
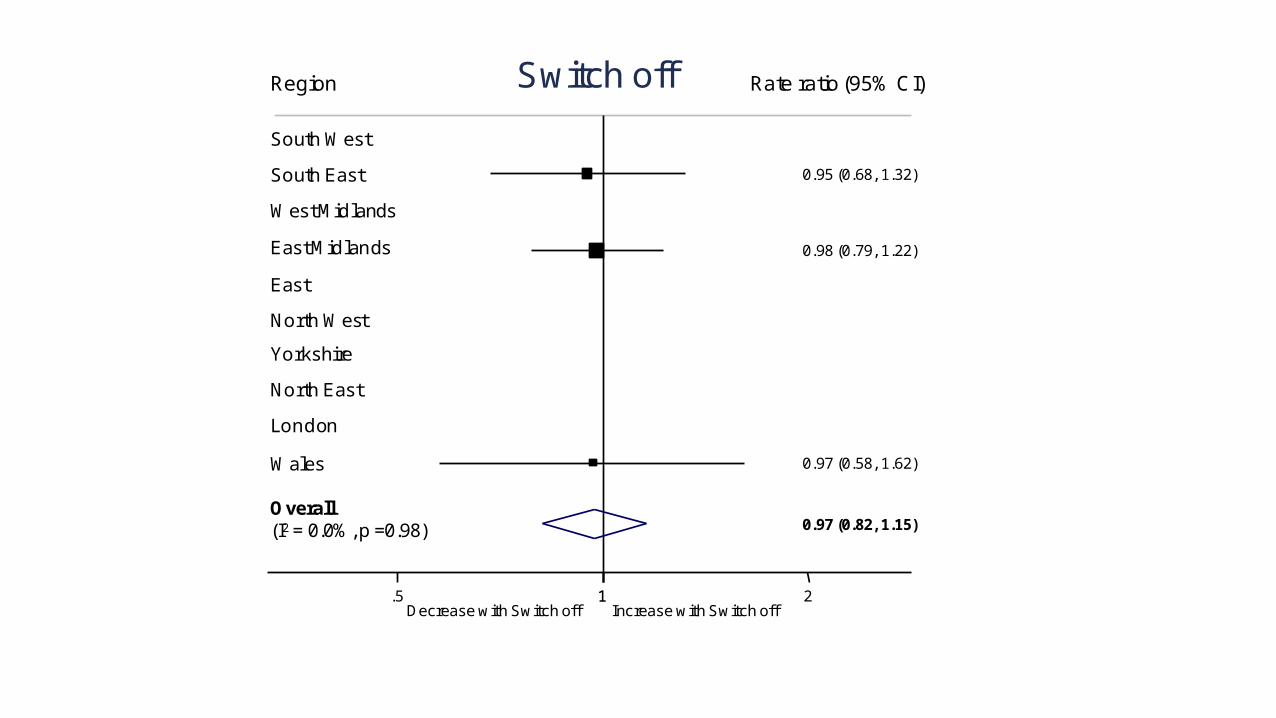
Overall(I2 = 0.0%, p =0.98)
East
London
East Midlands
Wales
West Midlands
North East
South West
Yorkshire
North West
South East
0.97 (0.82, 1.15)
0.98 (0.79, 1.22)
0.97 (0.58, 1.62)
Rate ratio (95% CI)
0.95 (0.68, 1.32)
Decrease with Switch off Increase with Switch off 1.5 1 2
Switch offRegion

RESULTS Does street lighting adaptation impact on crime?

Crime (Dec 2010 - Dec 2013):
581,837 Burglaries730,280 Violence475,657 Vehicle crime 67,470 Robberies
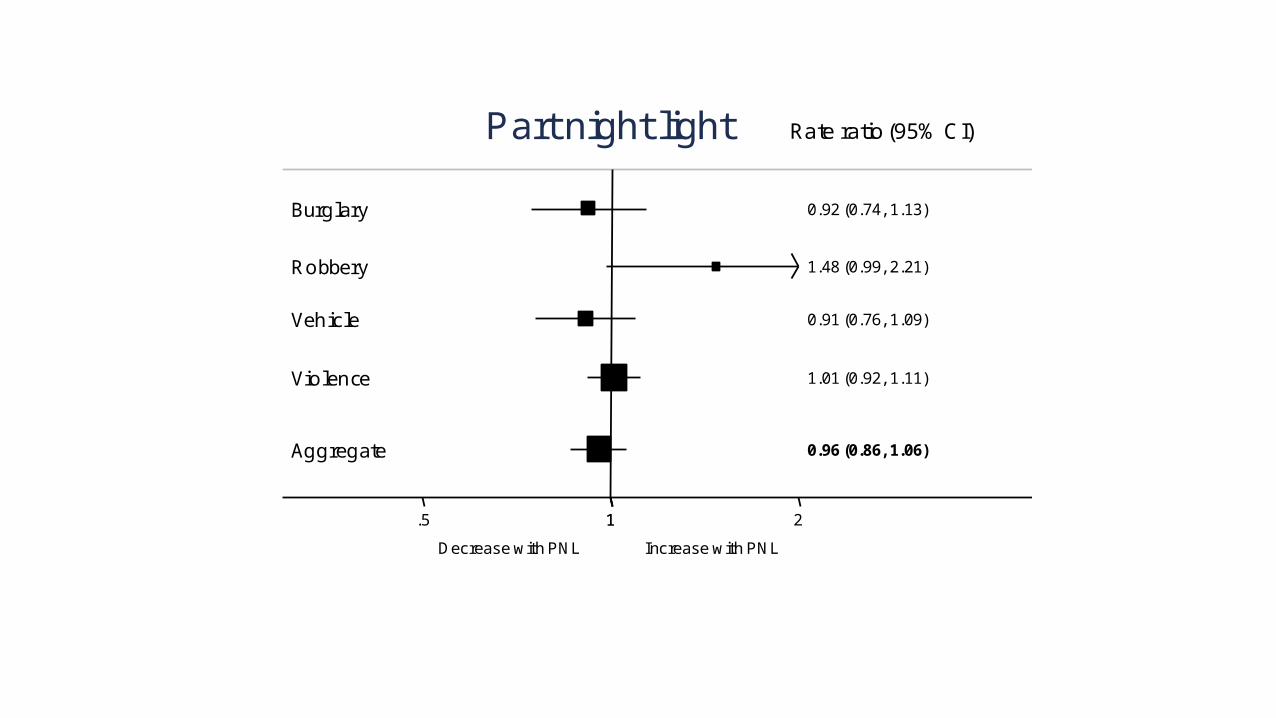
Aggregate
Burglary
Robbery
Vehicle
Violence
0.96 (0.86, 1.06)
0.92 (0.74, 1.13)
1.48 (0.99, 2.21)
0.91 (0.76, 1.09)
1.01 (0.92, 1.11)
Decrease with PNL Increase with PNL
1.5 1 2
Part night light Rate ratio (95% CI)
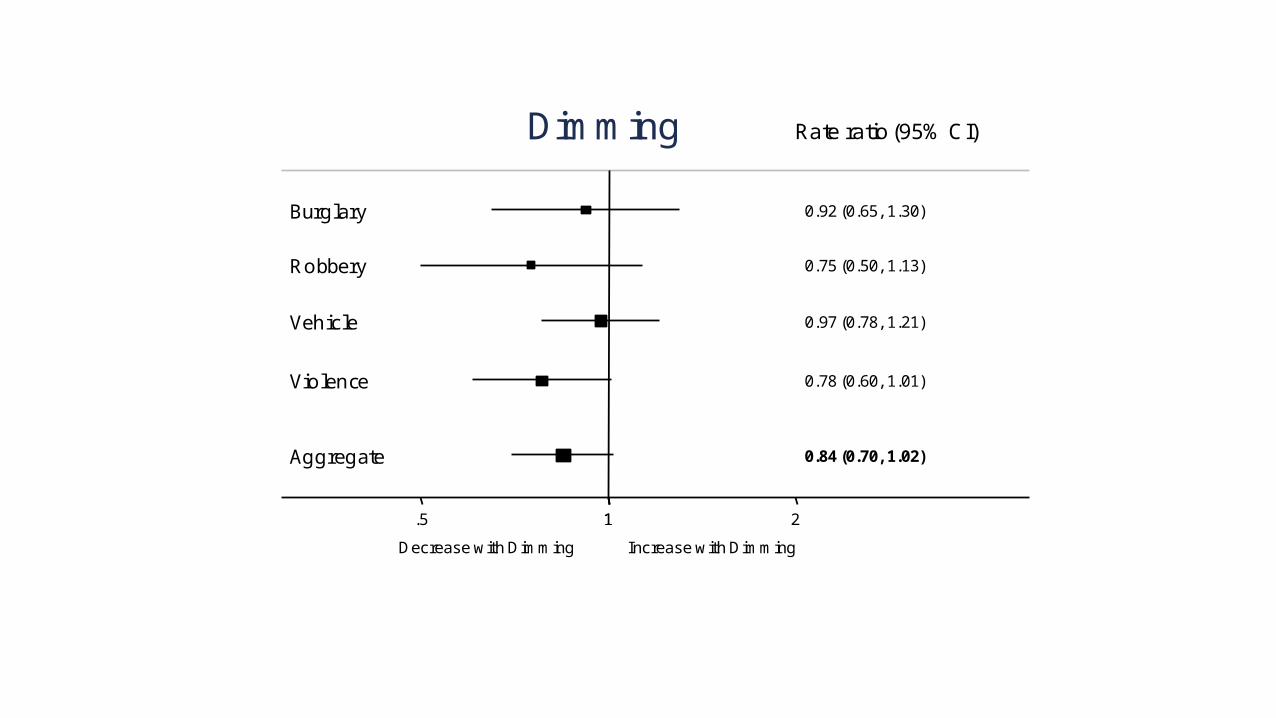
Aggregate
Burglary
Robbery
Vehicle
Violence
0.84 (0.70, 1.02)
0.92 (0.65, 1.30)
0.75 (0.50, 1.13)
0.97 (0.78, 1.21)
0.78 (0.60, 1.01)
Decrease with Dimming Increase with Dimming
1.5 1 2
Dimming Rate ratio (95% CI)
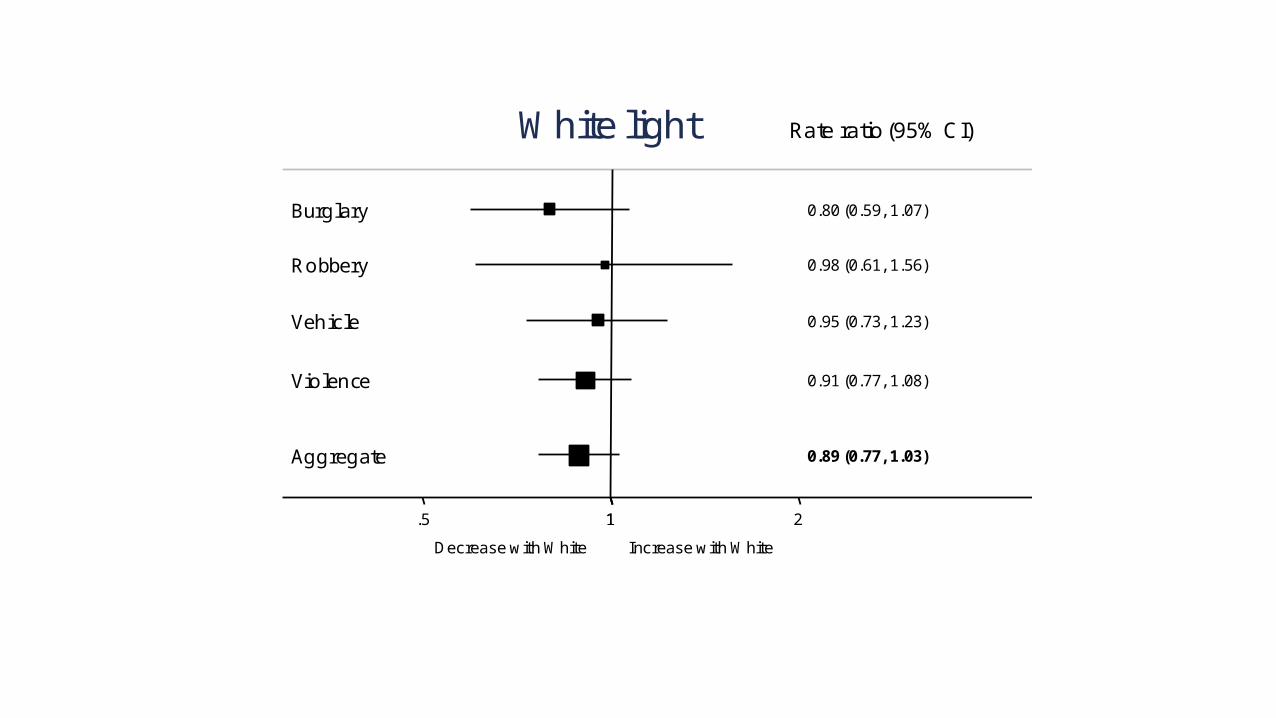
Aggregate
Burglary
Robbery
Vehicle
Violence
0.89 (0.77, 1.03)
0.80 (0.59, 1.07)
0.98 (0.61, 1.56)
0.95 (0.73, 1.23)
0.91 (0.77, 1.08)
Decrease with White Increase with White
1.5 1 2
White light Rate ratio (95% CI)
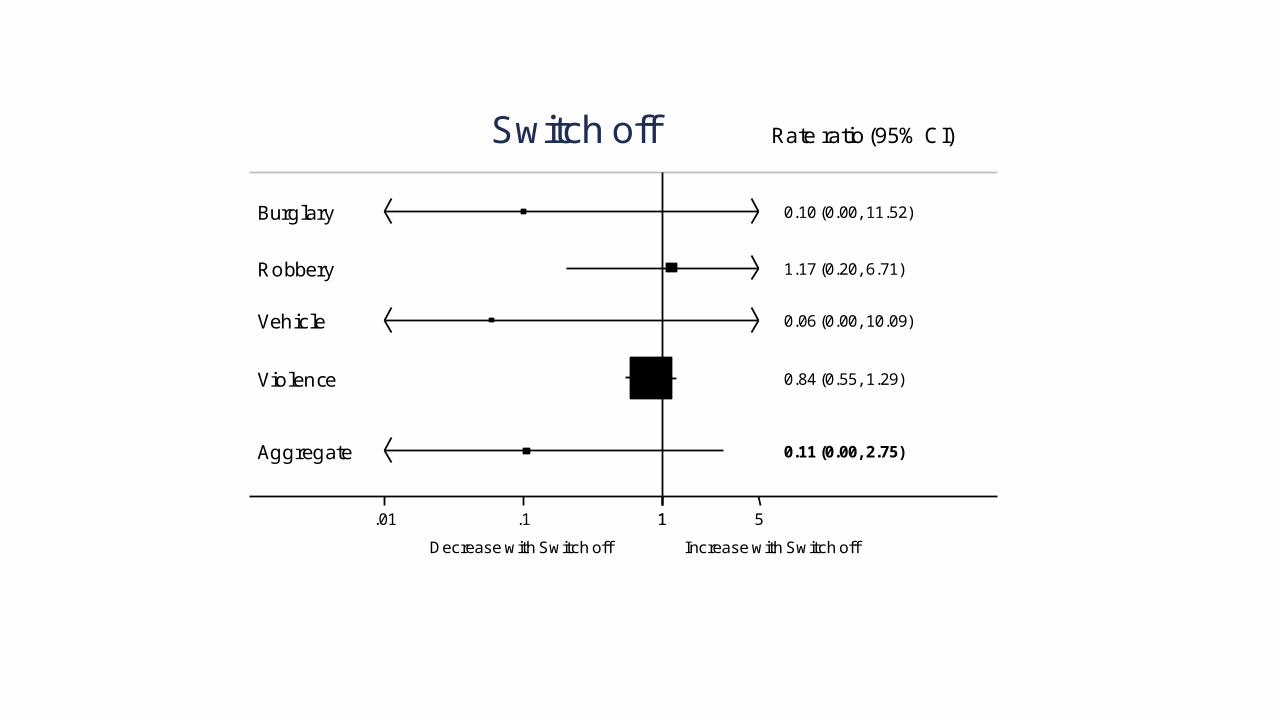
Aggregate
Burglary
Robbery
Vehicle
Violence
0.11 (0.00, 2.75)
0.10 (0.00, 11.52)
1.17 (0.20, 6.71)
0.06 (0.00, 10.09)
0.84 (0.55, 1.29)
Decrease with Switch off Increase with Switch off
1.01 .1 1 5
Switch off Rate ratio (95% CI)

RESULTSCrime results showed heterogeneity between police forces

Overall(I2 = 65.4%, p<0.001)
14
16
31
1
26
4
9
28
3
11
27
24
8
29
20
5
6
12
0.96 (0.86, 1.06)
0.42 (0.01, 22.46)
0.99 (0.74, 1.34)
1.11 (0.39, 3.18)
1.26 (1.06, 1.48)
1.64 (1.26, 2.14)
0.99 (0.80, 1.24)
0.56 (0.26, 1.21)
0.91 (0.80, 1.04)
0.72 (0.45, 1.15)
0.90 (0.83, 0.98)
7.26 (0.72, 73.33)
0.83 (0.71, 0.97)
0.95 (0.46, 1.95)
0.93 (0.69, 1.24)
1.10 (0.73, 1.66)
0.67 (0.56, 0.81)
0.84 (0.38, 1.86)
0.96 (0.86, 1.06)
Decrease with PNL Increase with PNL 1.01 .1 1 10 100
Part night light Rate ratio (95% CI)Police force
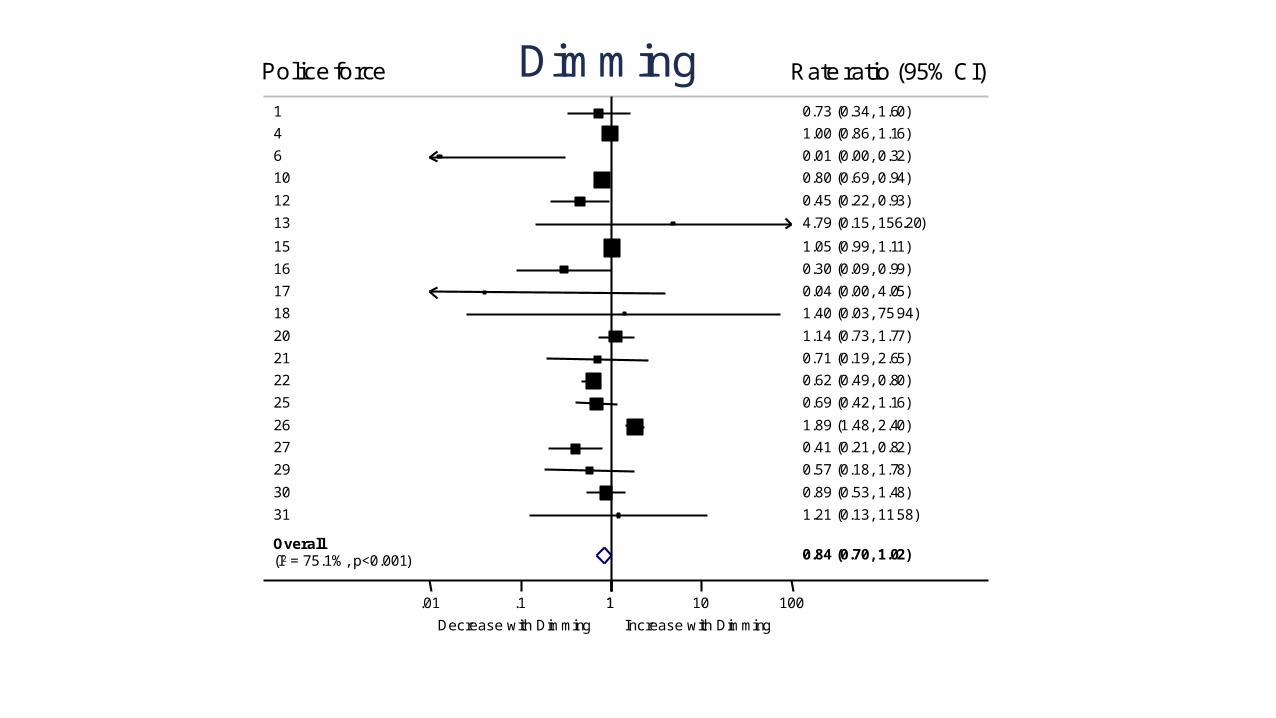
Overall(I2 = 75.1%, p<0.001)
31
25
4
21
29
26
17
12
6
27
22
30
1820
16
10
13
1
15
0.84 (0.70, 1.02)
1.21 (0.13, 11.58)
0.69 (0.42, 1.16)
1.00 (0.86, 1.16)
0.71 (0.19, 2.65)
0.57 (0.18, 1.78)
1.89 (1.48, 2.40)
0.04 (0.00, 4.05)
0.45 (0.22, 0.93)
0.01 (0.00, 0.32)
0.41 (0.21, 0.82)
0.62 (0.49, 0.80)
0.89 (0.53, 1.48)
1.40 (0.03, 75.94)1.14 (0.73, 1.77)
0.30 (0.09, 0.99)
0.80 (0.69, 0.94)
4.79 (0.15, 156.20)
0.73 (0.34, 1.60)
1.05 (0.99, 1.11)
Decrease with Dimming Increase with Dimming 1.01 .1 1 10 100
Dimming Rate ratio (95% CI)Police force
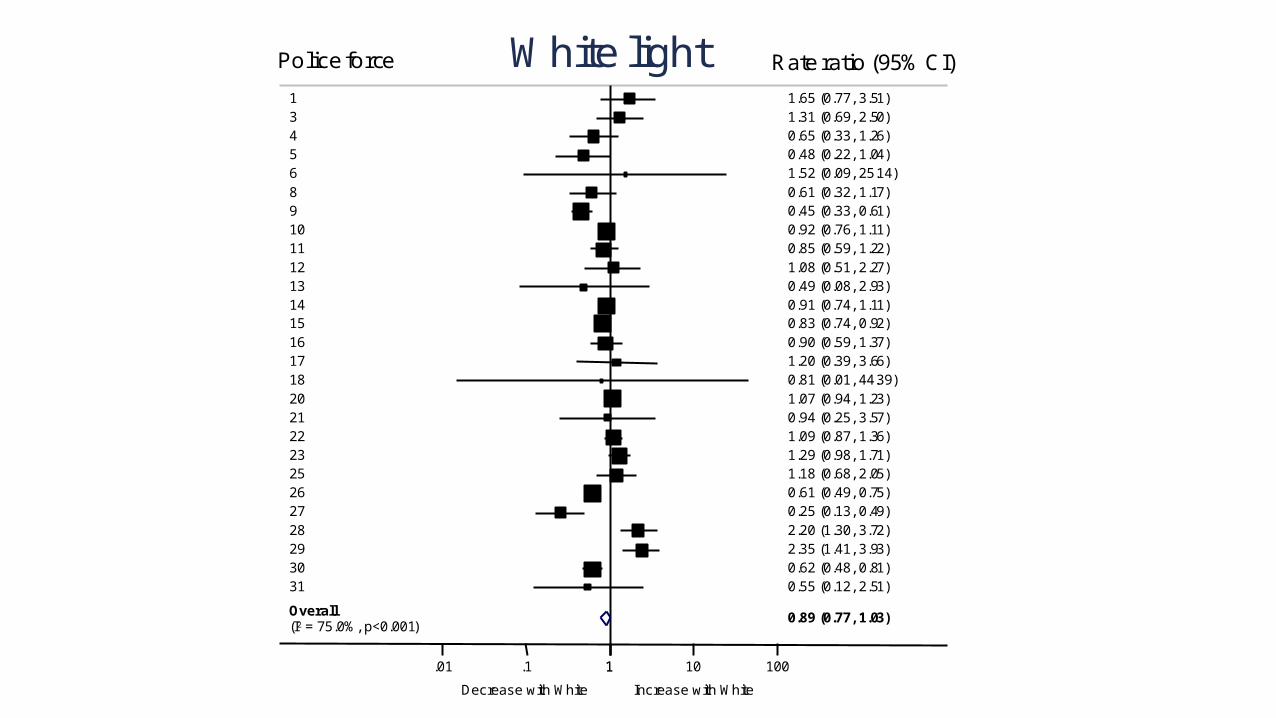
Overall(I2 = 75.0%, p<0.001)
1820
13
23
21
30
11
31
25
8
5
28
4
29
109
16
22
17
1514
26
6
27
3
12
1
0.89 (0.77, 1.03)
0.81 (0.01, 44.39)1.07 (0.94, 1.23)
0.49 (0.08, 2.93)
1.29 (0.98, 1.71)
0.94 (0.25, 3.57)
0.62 (0.48, 0.81)
0.85 (0.59, 1.22)
0.55 (0.12, 2.51)
1.18 (0.68, 2.05)
0.61 (0.32, 1.17)
0.48 (0.22, 1.04)
2.20 (1.30, 3.72)
0.65 (0.33, 1.26)
2.35 (1.41, 3.93)
0.92 (0.76, 1.11)0.45 (0.33, 0.61)
0.90 (0.59, 1.37)
1.09 (0.87, 1.36)
1.20 (0.39, 3.66)
0.83 (0.74, 0.92)0.91 (0.74, 1.11)
0.61 (0.49, 0.75)
1.52 (0.09, 25.14)
0.25 (0.13, 0.49)
1.31 (0.69, 2.50)
1.08 (0.51, 2.27)
1.65 (0.77, 3.51)
Decrease with White Increase with White
1.01 .1 1 10 100
White light Rate ratio (95% CI)Police force

Limitations:-Selection bias?-Information bias?-Confounding?

Conclusions-Reduced street lighting over recent years has been done safely, without increasing road traffic casualties or crime.-Part-night lighting and dimming may be considered after careful assessment by qualified lighting professional, using a risk-based analysis.

Further research
AcknowledgementsThe authors wish to acknowledge the advice and support of the Institution of Lighting Professionals and the London Lighting Engineers Group.
The authors also thank: Denise Kendrick, Emily Conner and Mark Norris for advice, and the local authority street lighting managers who provided data for the project.