Embed Size (px)
Citation preview
Replacement Migration:
Revisiting a debated concept
15 years later
Forum on Migration, Citizenship and Demography
Florence - Italy, 4-5 February, 2016
Pablo LattesMigration Section
Population Division - DESAUnited Nations

Background information
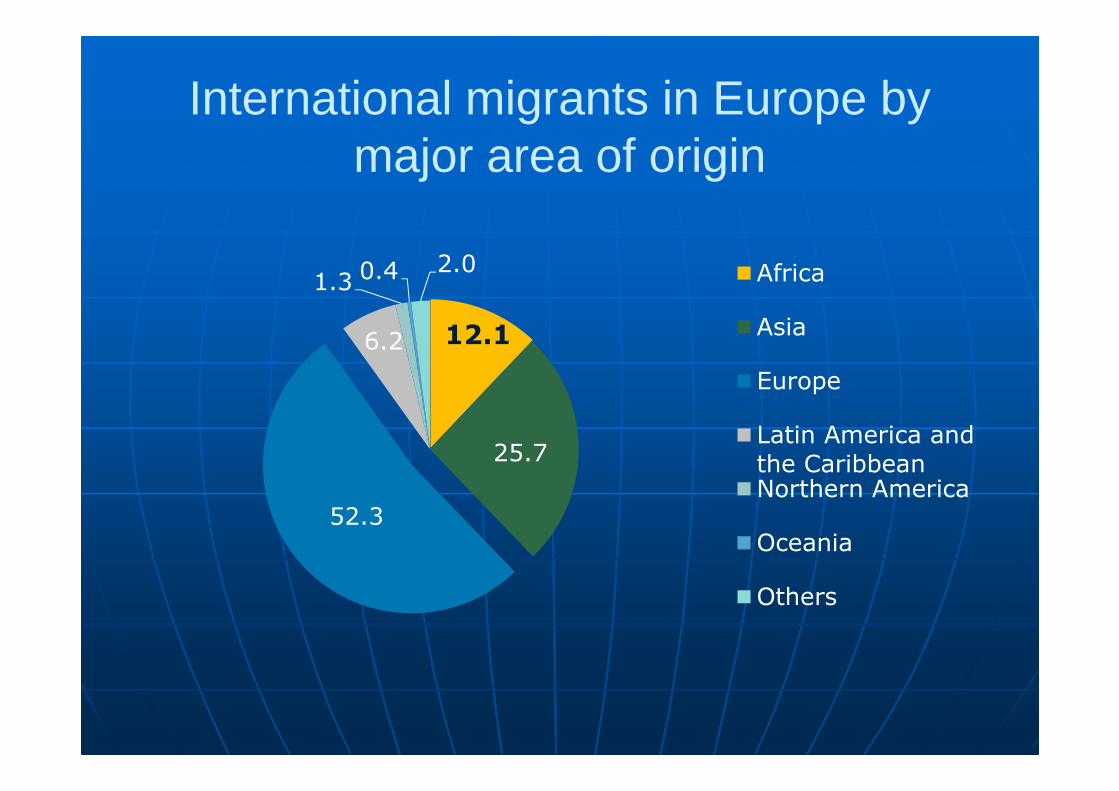
International migrants in Europe by major area of origin
12.1
25.7
52.3
6.2
1.3 0.4 2.0 Africa
Asia
Europe
Latin America and
the CaribbeanNorthern America
Oceania
Others
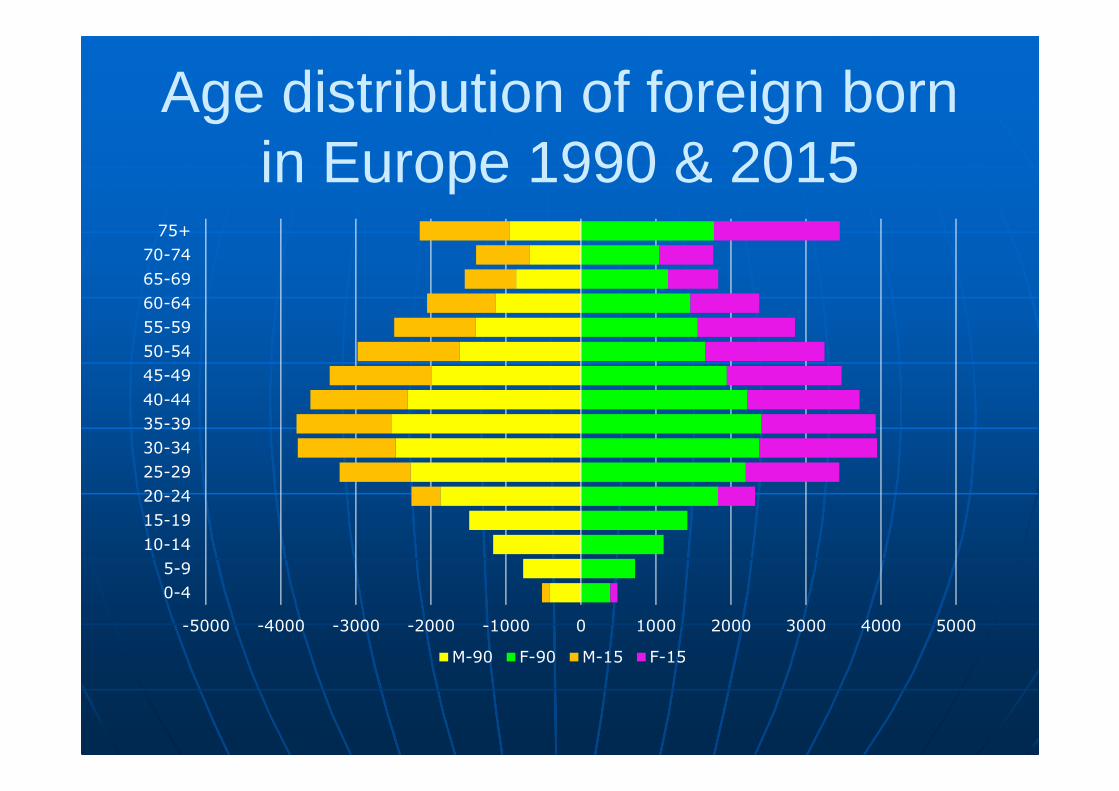
Age distribution of foreign born in Europe 1990 & 2015
-5000 -4000 -3000 -2000 -1000 0 1000 2000 3000 4000 5000
0-4
5-9
10-14
15-19
20-24
25-29
30-34
35-39
40-44
45-49
50-54
55-59
60-64
65-69
70-74
75+
M-90 F-90 M-15 F-15
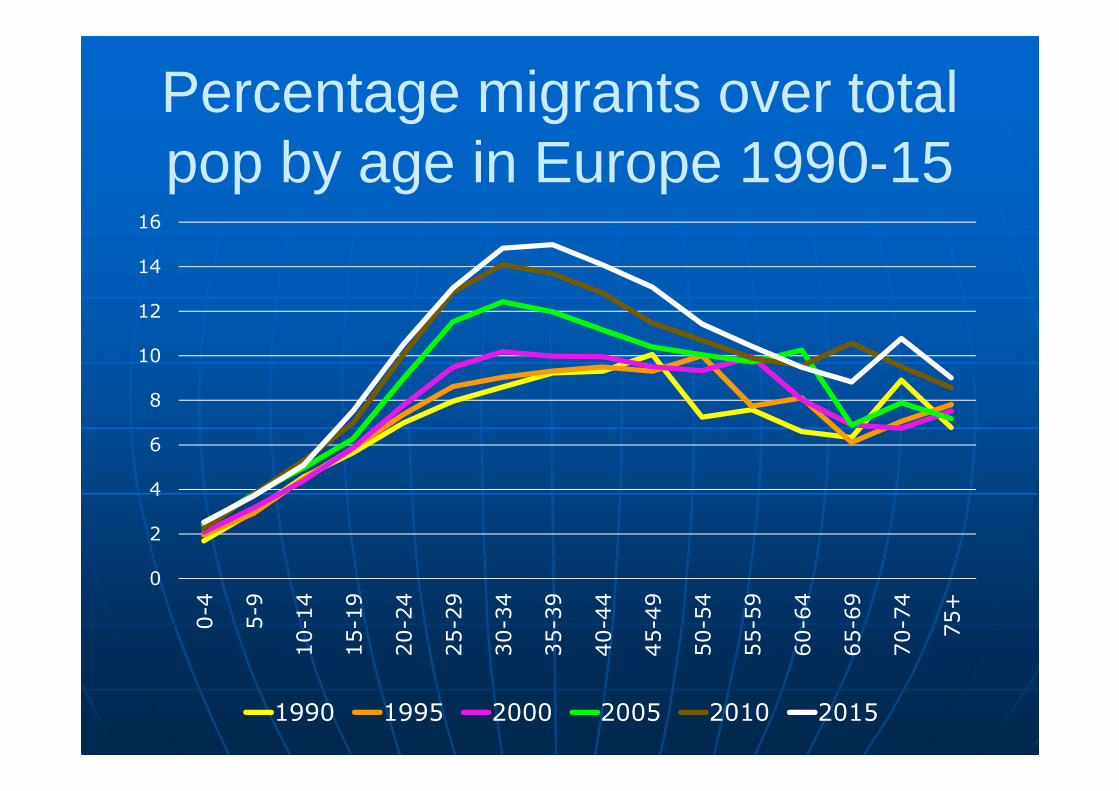
Percentage migrants over total pop by age in Europe 1990-15
0
2
4
6
8
10
12
14
160-4
5-9
10-1
4
15-1
9
20-2
4
25-2
9
30-3
4
35-3
9
40-4
4
45-4
9
50-5
4
55-5
9
60-6
4
65-6
9
70-7
4
75+
1990 1995 2000 2005 2010 2015
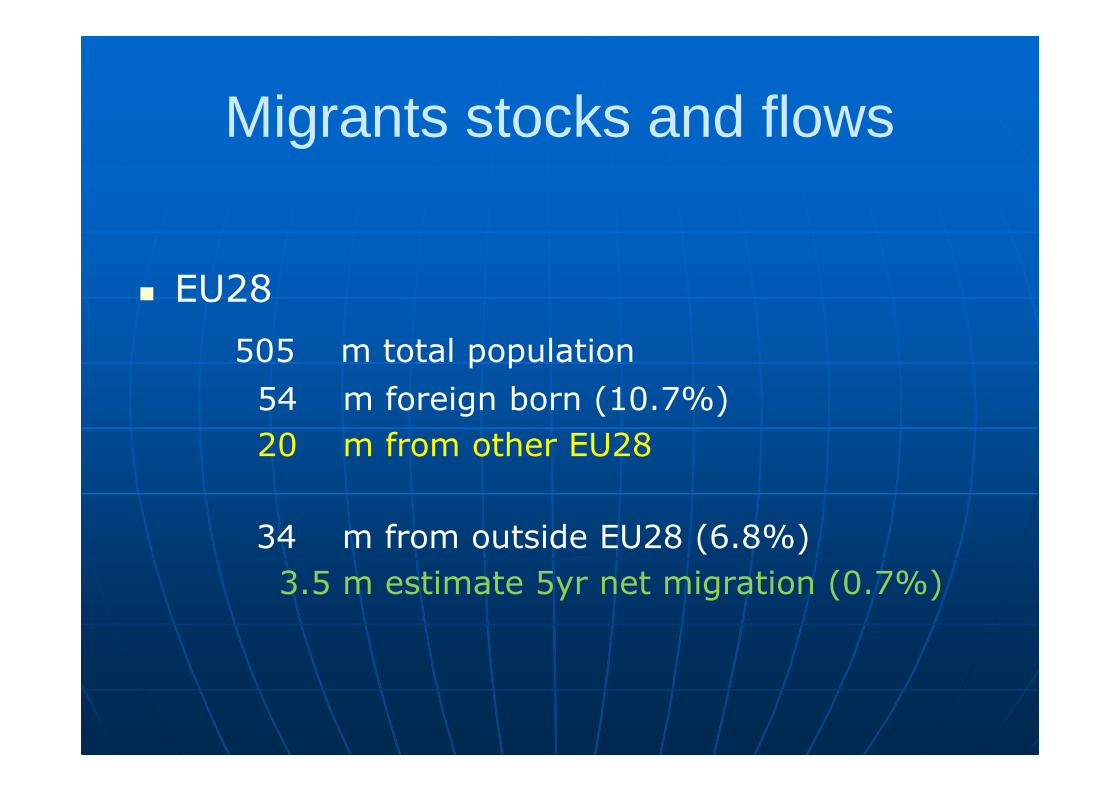
Migrants stocks and flows
� EU28
505 m total population
54 m foreign born (10.7%)
20 m from other EU28
34 m from outside EU28 (6.8%)
3.5 m estimate 5yr net migration (0.7%)
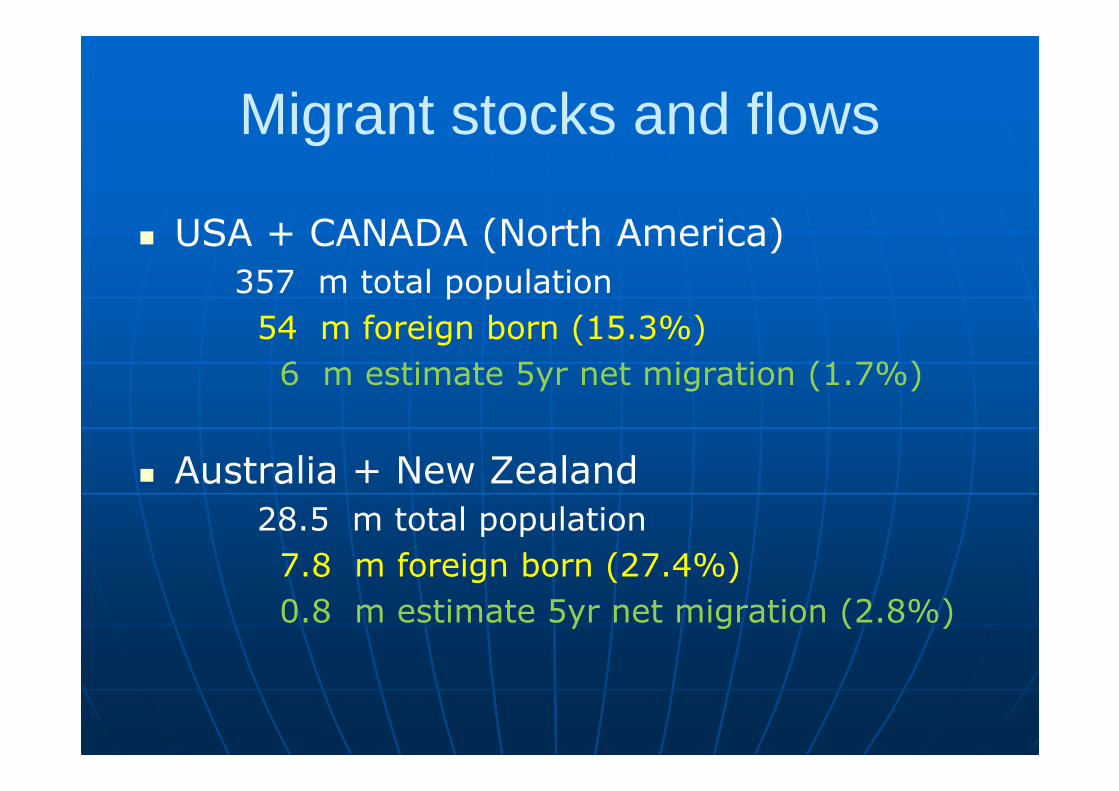
Migrant stocks and flows
� USA + CANADA (North America)
357 m total population
54 m foreign born (15.3%)
6 m estimate 5yr net migration (1.7%)
� Australia + New Zealand
28.5 m total population
7.8 m foreign born (27.4%)
0.8 m estimate 5yr net migration (2.8%)
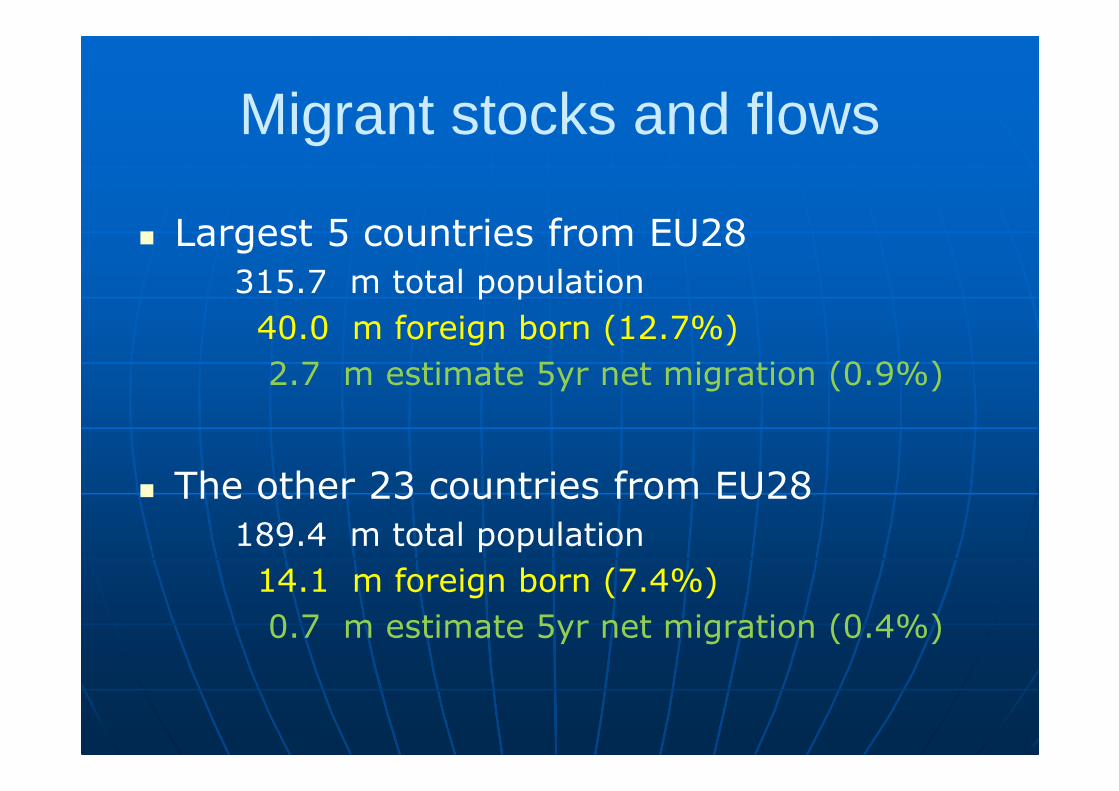
Migrant stocks and flows
� Largest 5 countries from EU28
315.7 m total population
40.0 m foreign born (12.7%)
2.7 m estimate 5yr net migration (0.9%)
� The other 23 countries from EU28
189.4 m total population
14.1 m foreign born (7.4%)
0.7 m estimate 5yr net migration (0.4%)
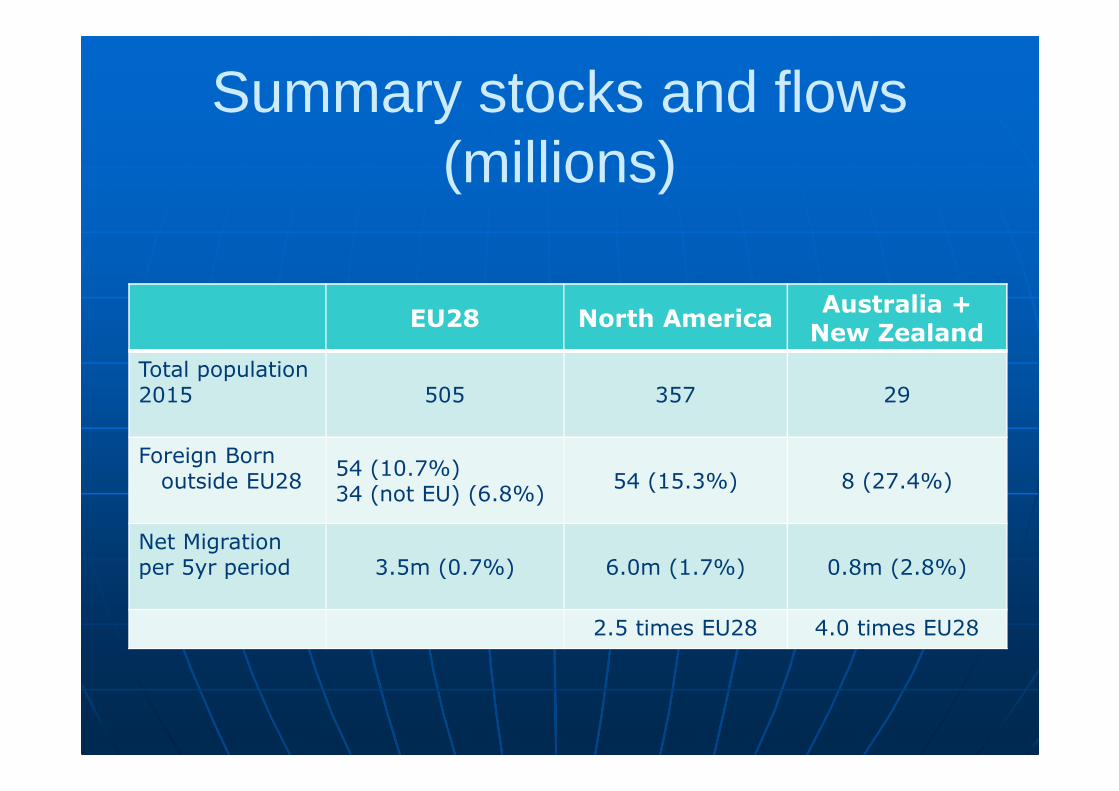
Summary stocks and flows (millions)
EU28 North AmericaAustralia +
New Zealand
Total population 2015 505 357 29
Foreign Bornoutside EU28
54 (10.7%)34 (not EU) (6.8%)
54 (15.3%) 8 (27.4%)
Net Migration per 5yr period 3.5m (0.7%) 6.0m (1.7%) 0.8m (2.8%)
2.5 times EU28 4.0 times EU28
Approaches to population growth -migration or fertility?
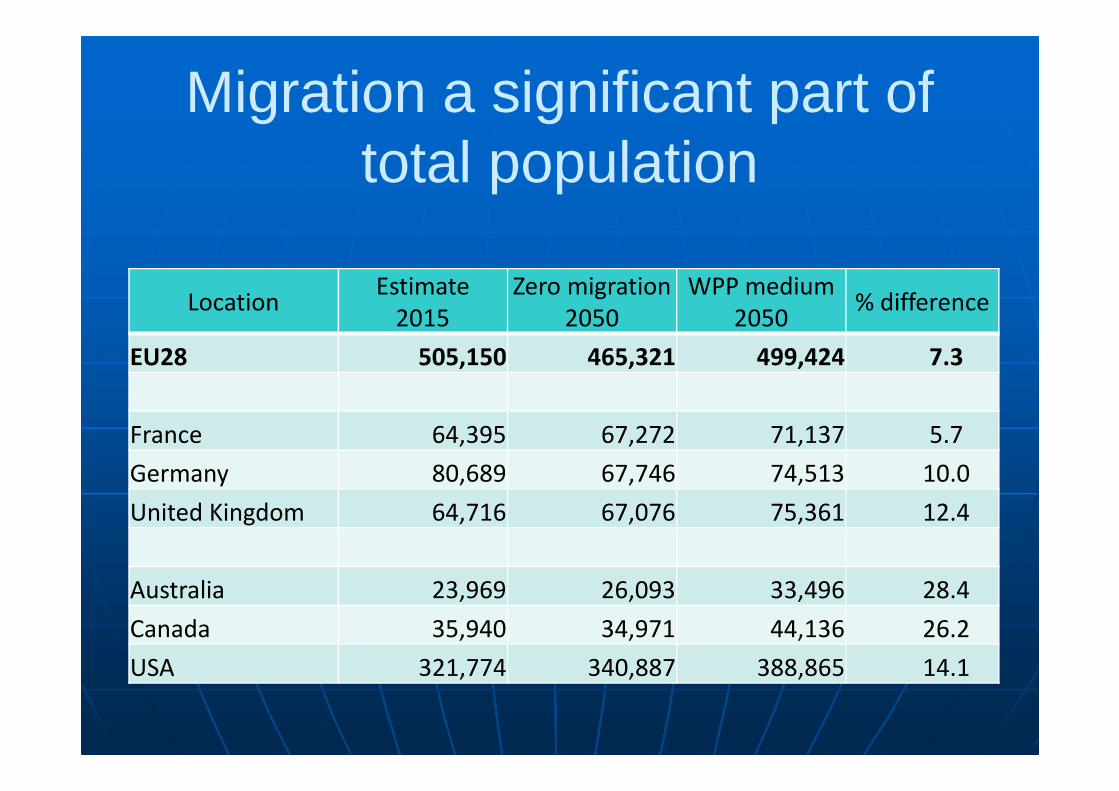
Migration a significant part of total population
LocationEstimate
2015
Zero migration
2050
WPP medium
2050% difference
EU28 505,150 465,321 499,424 7.3
France 64,395 67,272 71,137 5.7
Germany 80,689 67,746 74,513 10.0
United Kingdom 64,716 67,076 75,361 12.4
Australia 23,969 26,093 33,496 28.4
Canada 35,940 34,971 44,136 26.2
USA 321,774 340,887 388,865 14.1
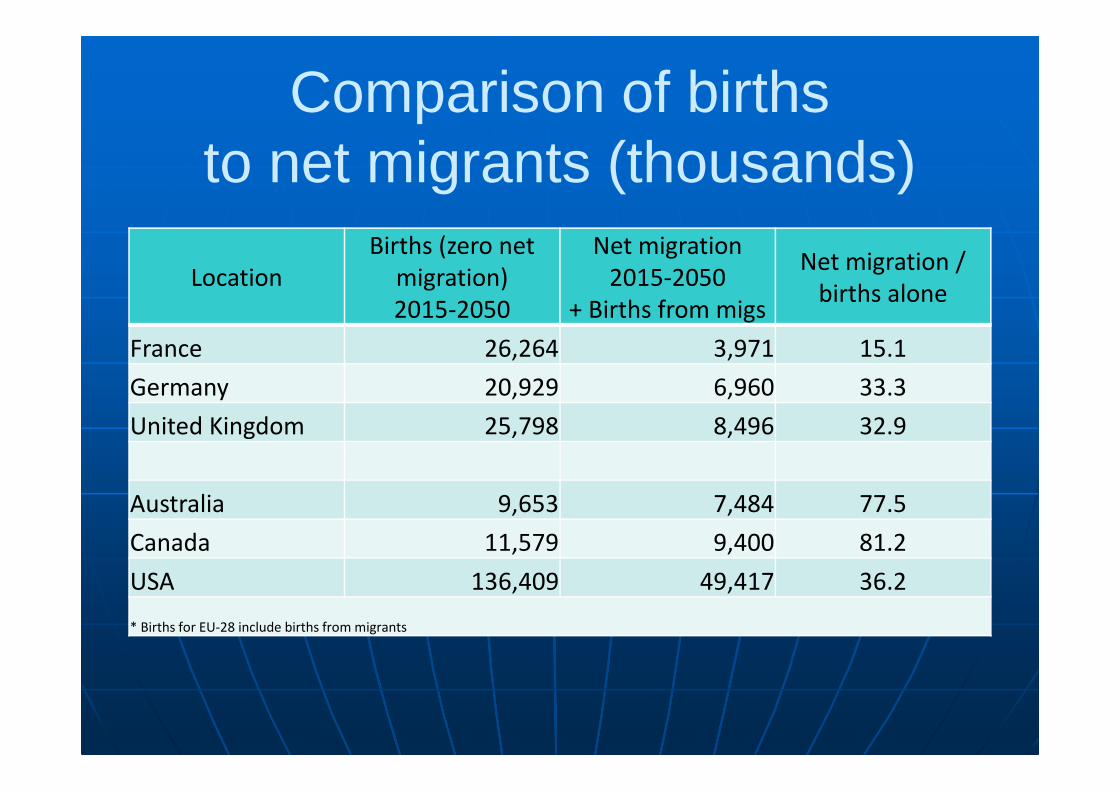
Comparison of births to net migrants (thousands)
Location
Births (zero net
migration)
2015-2050
Net migration
2015-2050
+ Births from migs
Net migration /
births alone
France 26,264 3,971 15.1
Germany 20,929 6,960 33.3
United Kingdom 25,798 8,496 32.9
Australia 9,653 7,484 77.5
Canada 11,579 9,400 81.2
USA 136,409 49,417 36.2
* Births for EU-28 include births from migrants
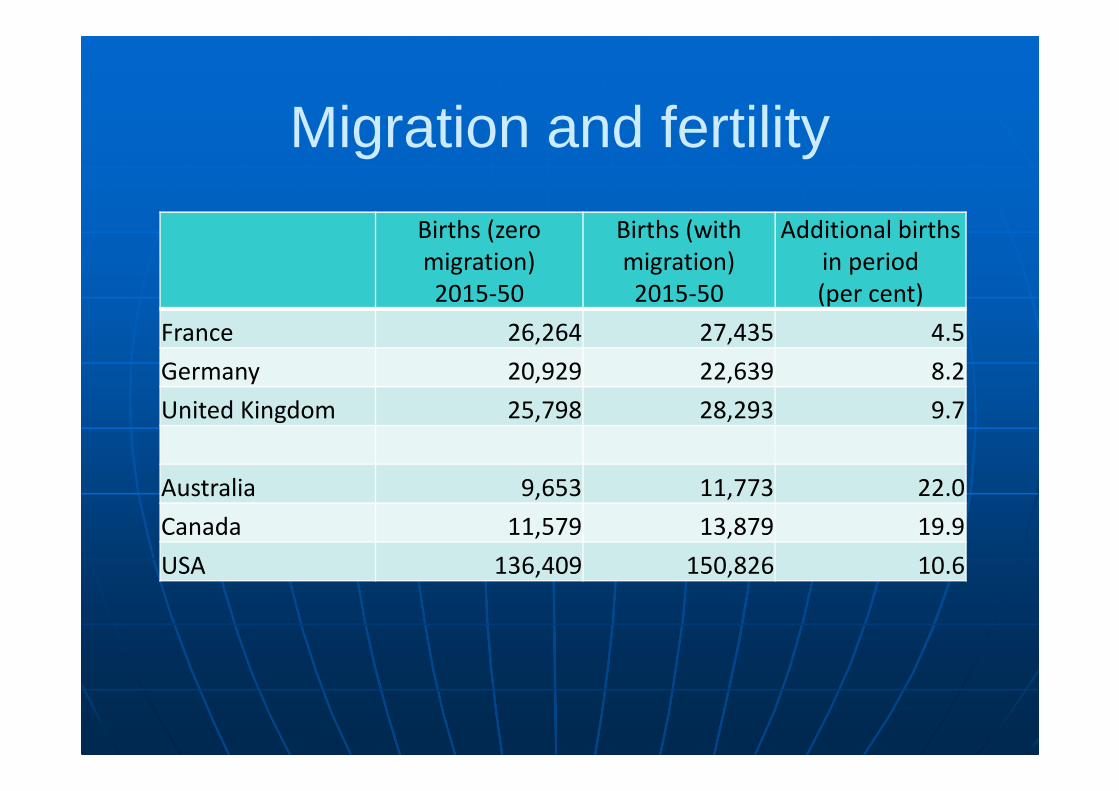
Migration and fertility
Births (zero
migration)
2015-50
Births (with
migration)
2015-50
Additional births
in period
(per cent)
France 26,264 27,435 4.5
Germany 20,929 22,639 8.2
United Kingdom 25,798 28,293 9.7
Australia 9,653 11,773 22.0
Canada 11,579 13,879 19.9
USA 136,409 150,826 10.6
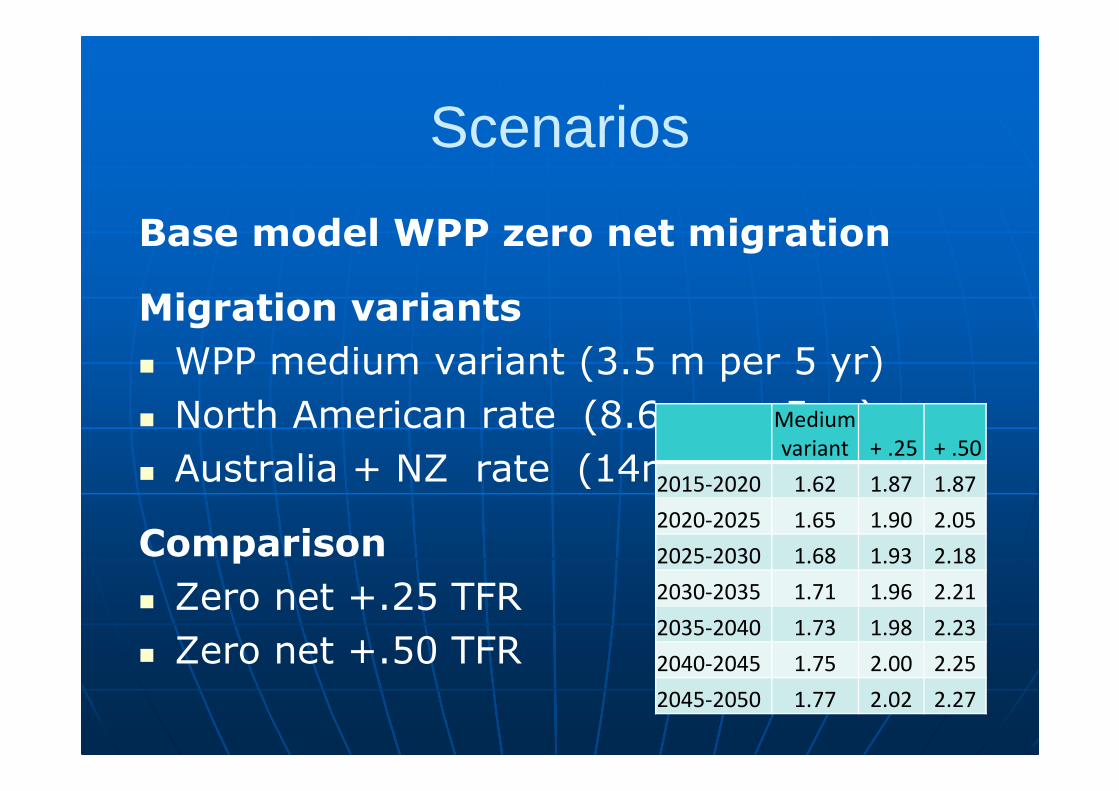
Scenarios
Base model WPP zero net migration
Migration variants
� WPP medium variant (3.5 m per 5 yr)
� North American rate (8.6m per 5 yr)
� Australia + NZ rate (14m per 5 yr)
Comparison
� Zero net +.25 TFR
� Zero net +.50 TFR
Medium
variant + .25 + .50
2015-2020 1.62 1.87 1.87
2020-2025 1.65 1.90 2.05
2025-2030 1.68 1.93 2.18
2030-2035 1.71 1.96 2.21
2035-2040 1.73 1.98 2.23
2040-2045 1.75 2.00 2.25
2045-2050 1.77 2.02 2.27
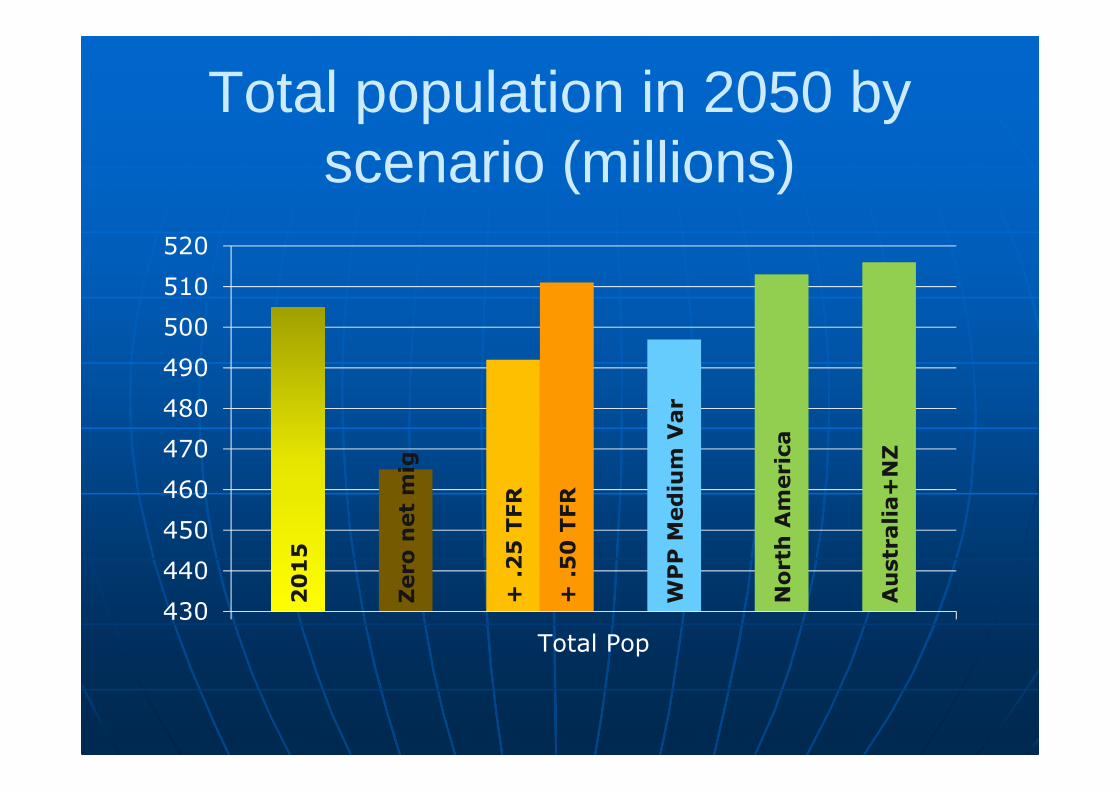
Total population in 2050 by scenario (millions)
20
15
Zero
net
mig
+ .
25
TFR
+ .
50
TFR
WP
P M
ed
ium
Var
No
rth
Am
eric
a
Au
str
alia+
NZ
430
440
450
460
470
480
490
500
510
520
Total Pop
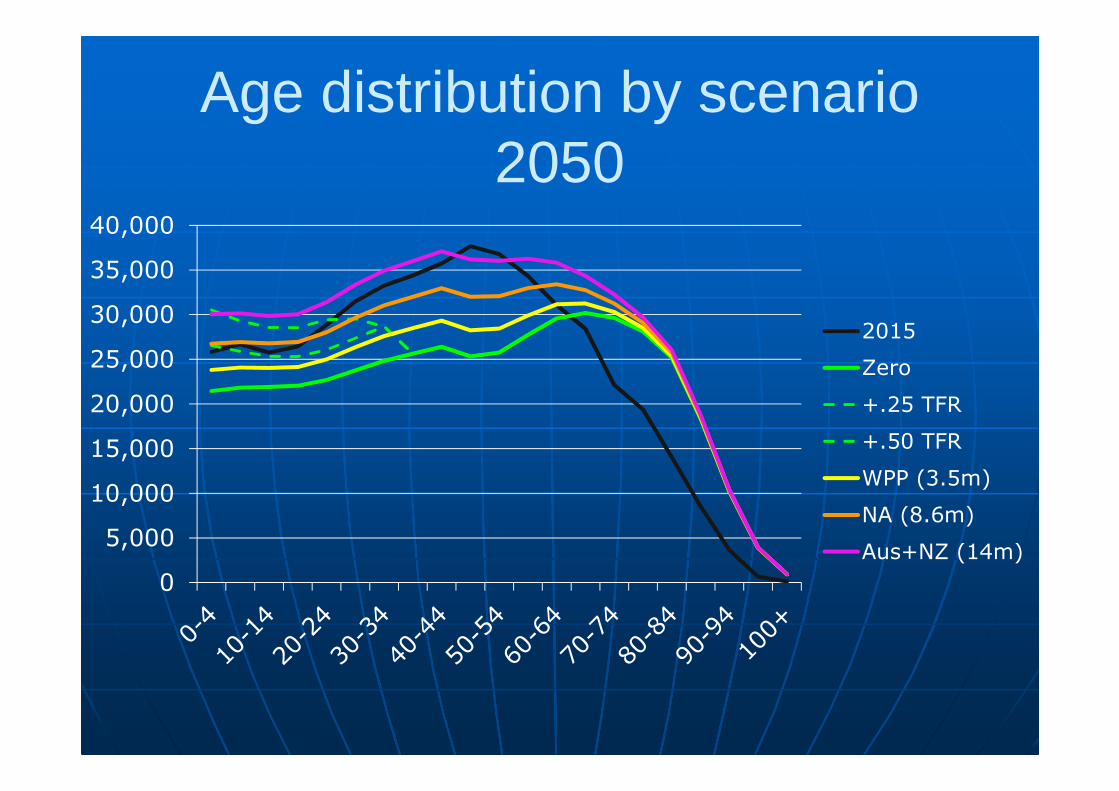
Age distribution by scenario2050
0
5,000
10,000
15,000
20,000
25,000
30,000
35,000
40,000
2015
Zero
+.25 TFR
+.50 TFR
WPP (3.5m)
NA (8.6m)
Aus+NZ (14m)
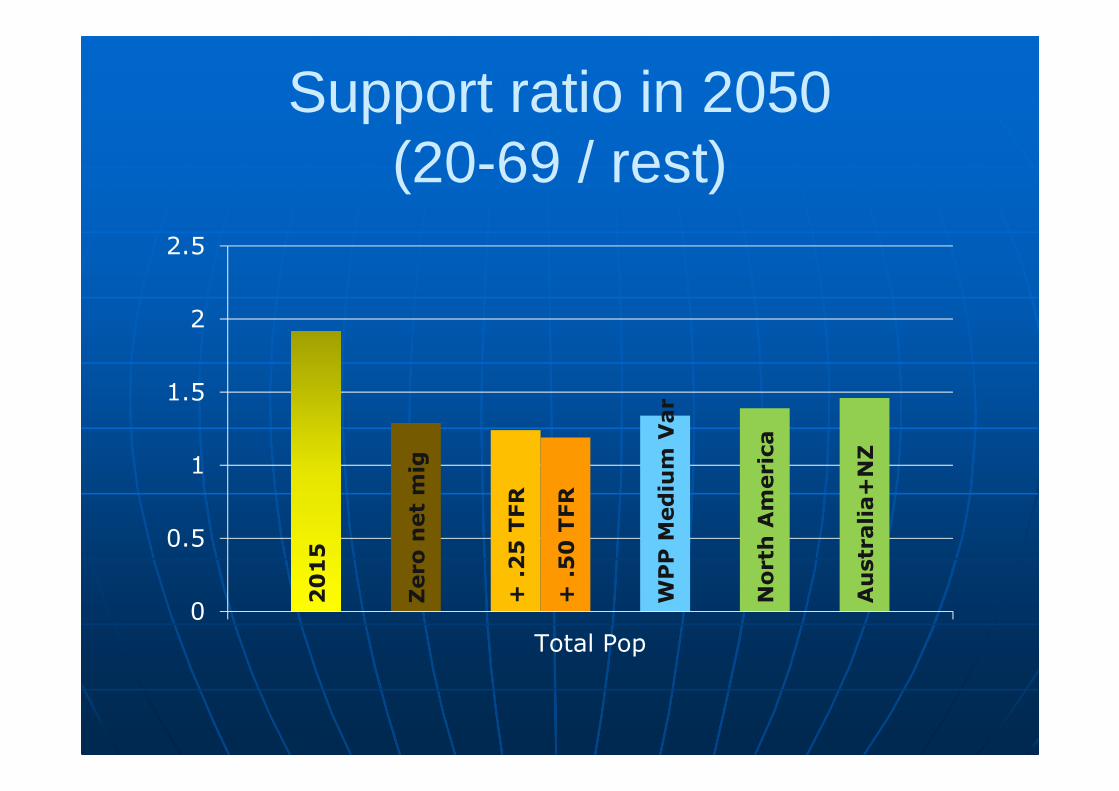
Support ratio in 2050 (20-69 / rest)
20
15
Zero
net
mig
+ .
25
TFR
+ .
50
TFR
WP
P M
ed
ium
Var
No
rth
Am
eric
a
Au
str
alia+
NZ
0
0.5
1
1.5
2
2.5
Total Pop
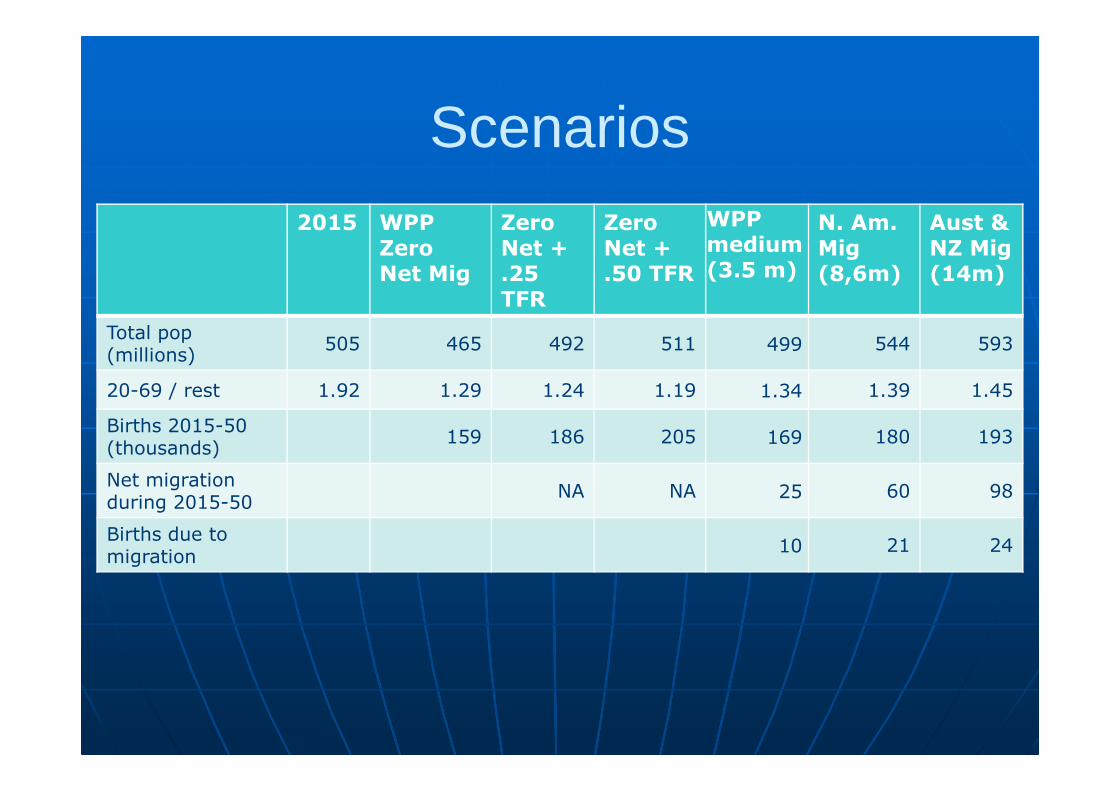
Scenarios2015 WPP
Zero Net Mig
Zero Net + .25 TFR
Zero Net + .50 TFR
WPP medium (3.5 m)
N. Am. Mig(8,6m)
Aust & NZ Mig(14m)
Total pop (millions)
505 465 492 511 499 544 593
20-69 / rest 1.92 1.29 1.24 1.19 1.34 1.39 1.45
Births 2015-50 (thousands)
159 186 205 169 180 193
Net migration during 2015-50
NA NA 25 60 98
Births due to migration
10 21 24
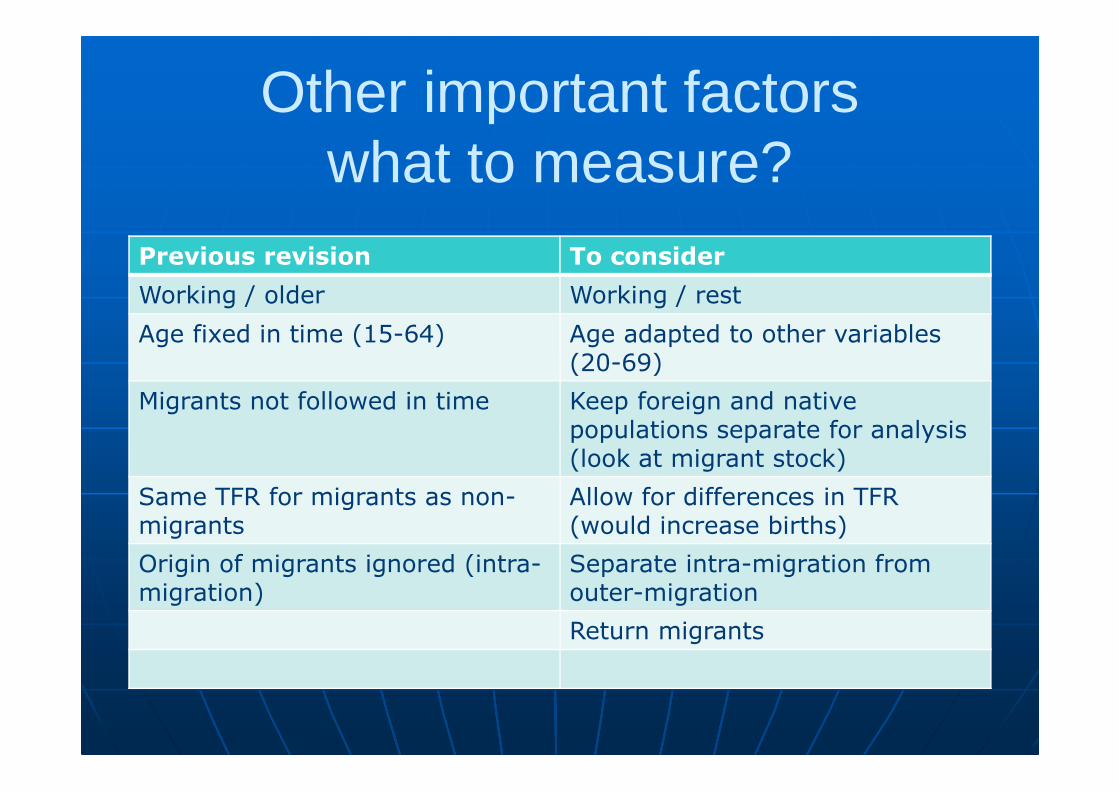
Other important factors what to measure?
Previous revision To consider
Working / older Working / rest
Age fixed in time (15-64) Age adapted to other variables (20-69)
Migrants not followed in time Keep foreign and nativepopulations separate for analysis(look at migrant stock)
Same TFR for migrants as non-migrants
Allow for differences in TFR (would increase births)
Origin of migrants ignored (intra-migration)
Separate intra-migration from outer-migration
Return migrants
Concluding remarks
� Migration can play a major role in the size and age distribution of future population
� But Europe is experiencing much lower levels of (external) migration compared to other countries or regions
� Increases in TFR take many years to have an effect on the workforce.
� Net migration hides many of the characteristics of migrants by mixing them with total population.
� Shorter term migration is becoming more significant and has the effect of slowing down the ageing further.