Embed Size (px)
Citation preview
Enhancing Cultural Experience
by Designing for Inclusion !
Janice Majewski, IHCD Misa Lund, wHY
Margaret Matz, Paola Barcarolo, Milestone Architecture
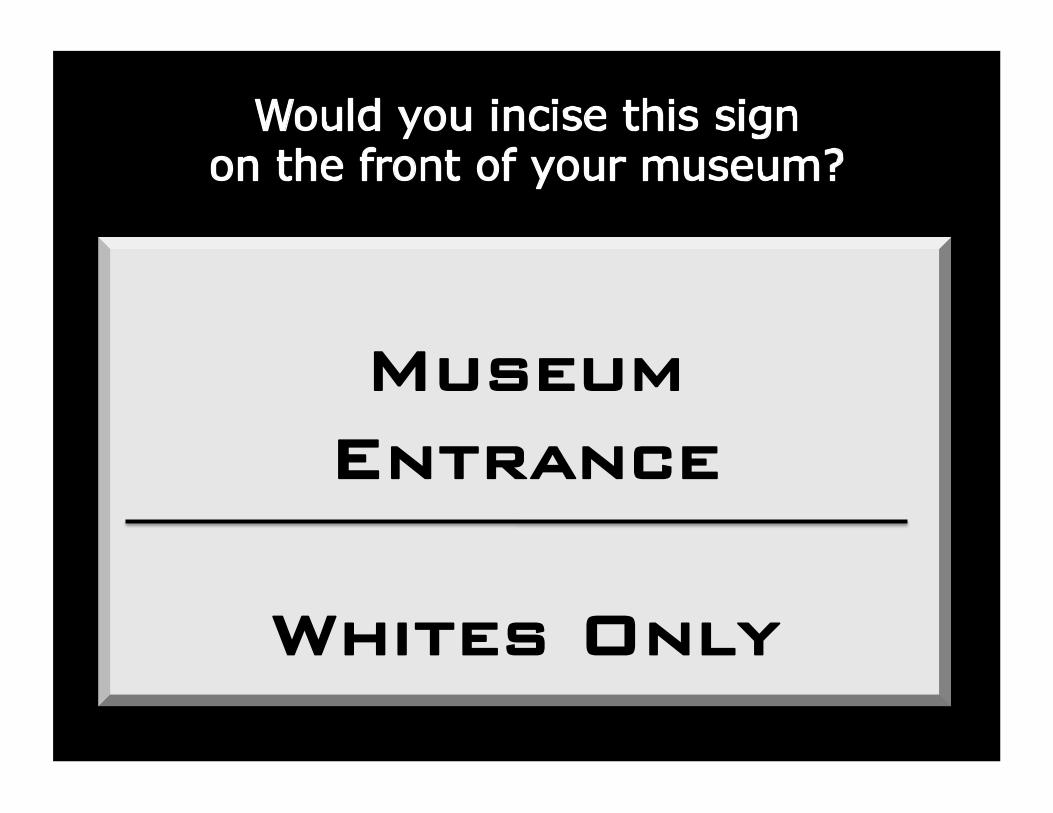
Museum!Entrance !
Whites Only!
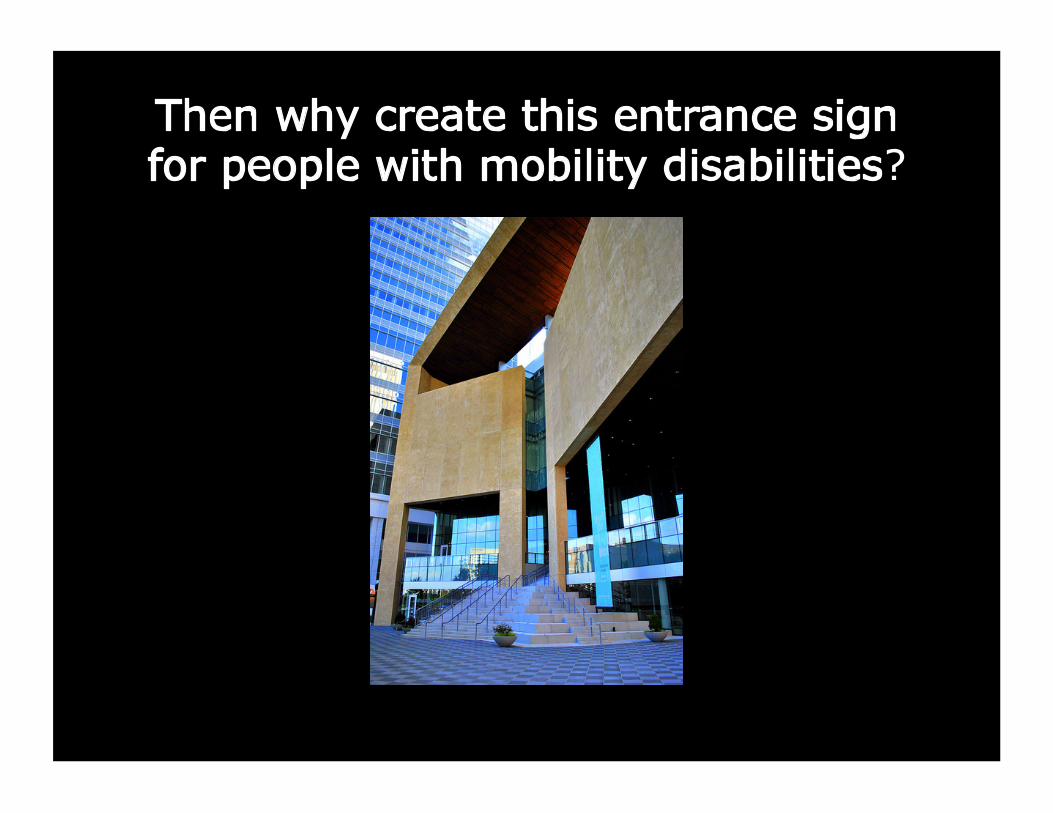
?
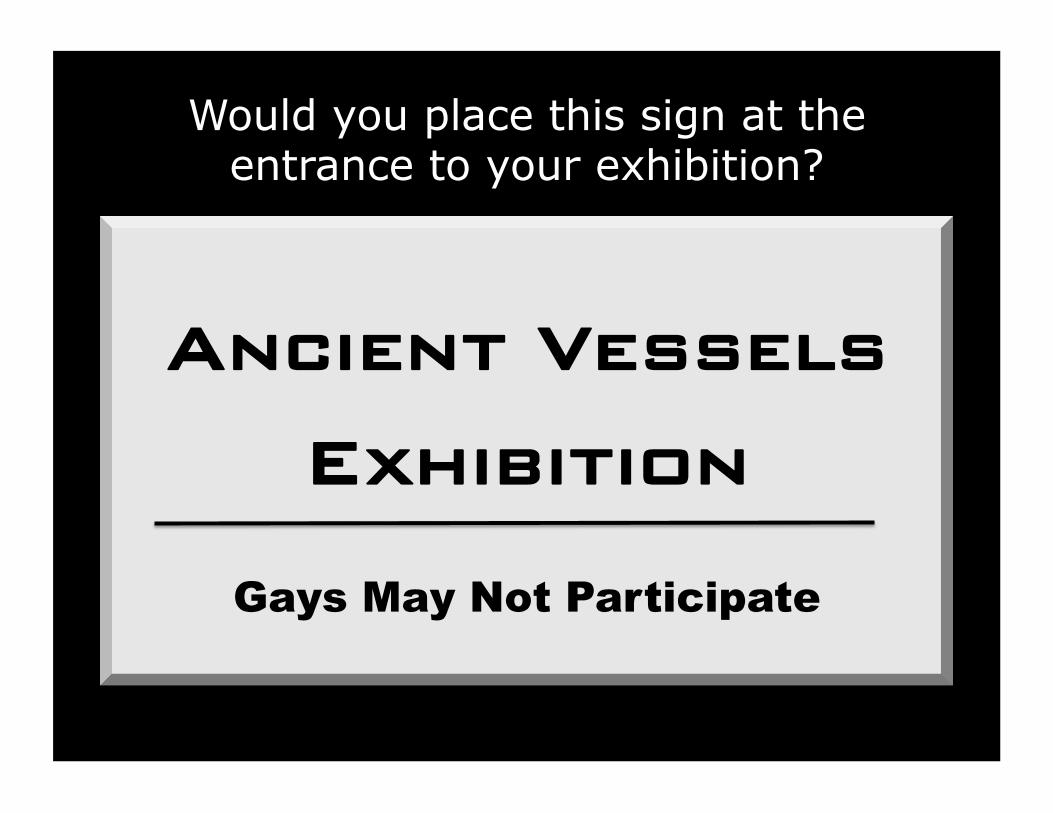
Would you place this sign at the entrance to your exhibition?
Ancient Vessels!
Exhibition!
Gays May Not Participate
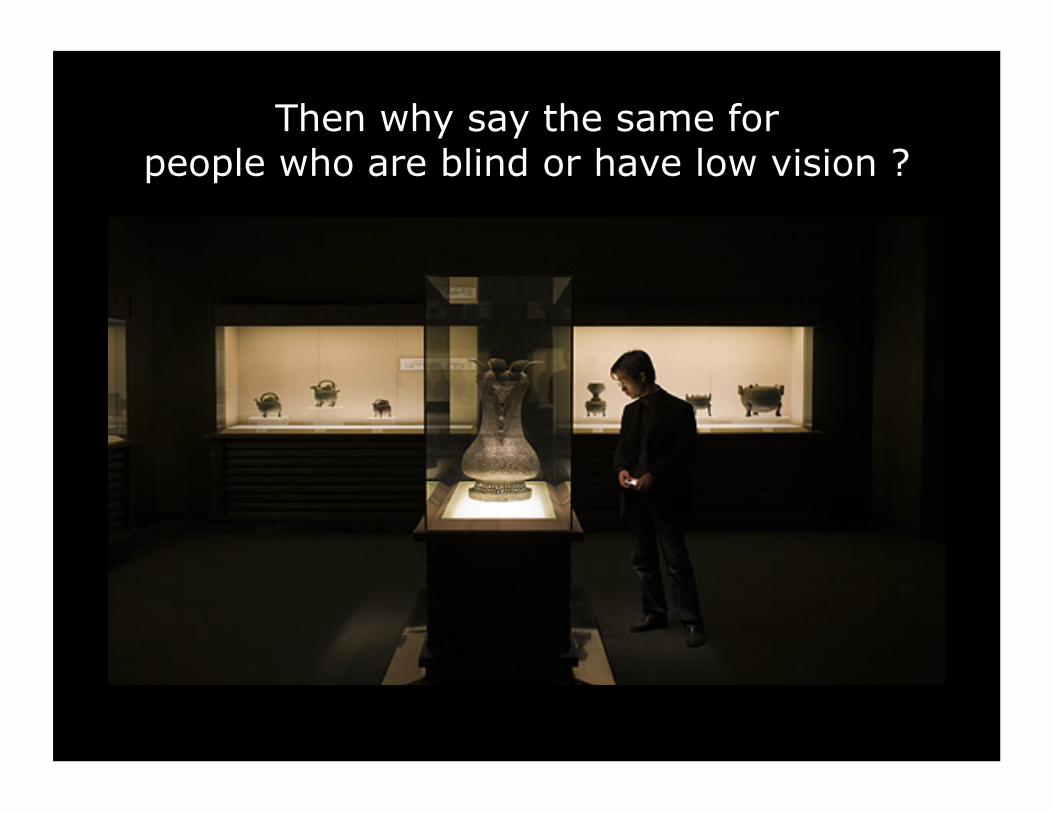
Then why say the same for people who are blind or have low vision ?

Would you post this sign in your museum gallery?
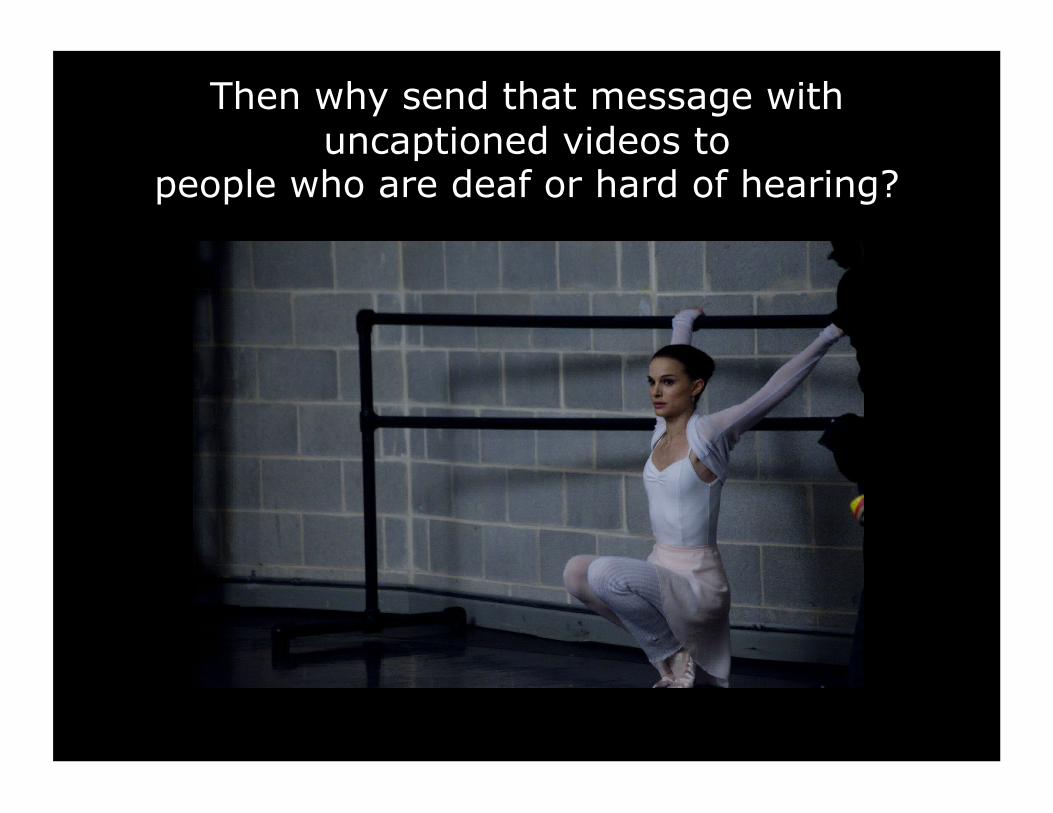
Then why send that message with uncaptioned videos to
people who are deaf or hard of hearing?
Disability Rights !
are Civil Rights!
The ADA is Comprehensive!
Civil Rights Legislation!
That Is Almost 25 Years Old!
Three Important Facts
• Inclusion is a right, not an option.
• Inclusion is a smart choice for museums.
• Designing for inclusion ensures that museums sustain an audience for a longer, richer period of time.
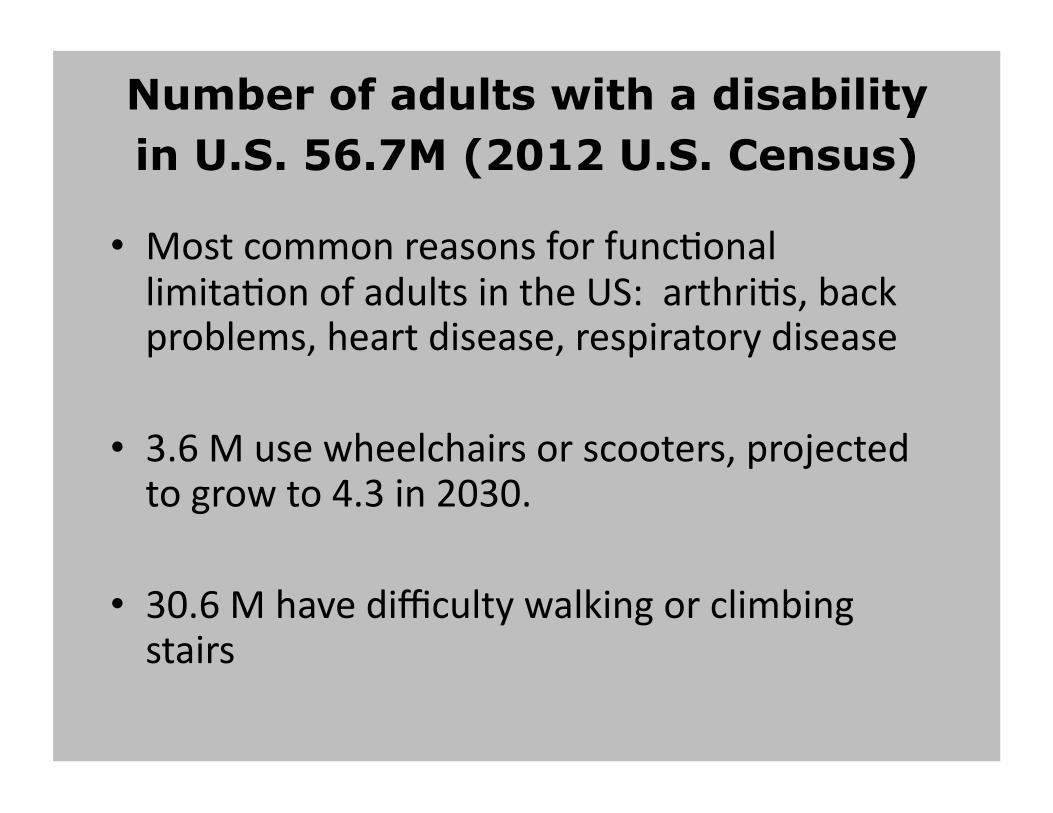
Number of adults with a disability in U.S. 56.7M (2012 U.S. Census)
• Most common reasons for func.onal limita.on of adults in the US: arthri.s, back problems, heart disease, respiratory disease
• 3.6 M use wheelchairs or scooters, projected to grow to 4.3 in 2030.
• 30.6 M have difficulty walking or climbing stairs
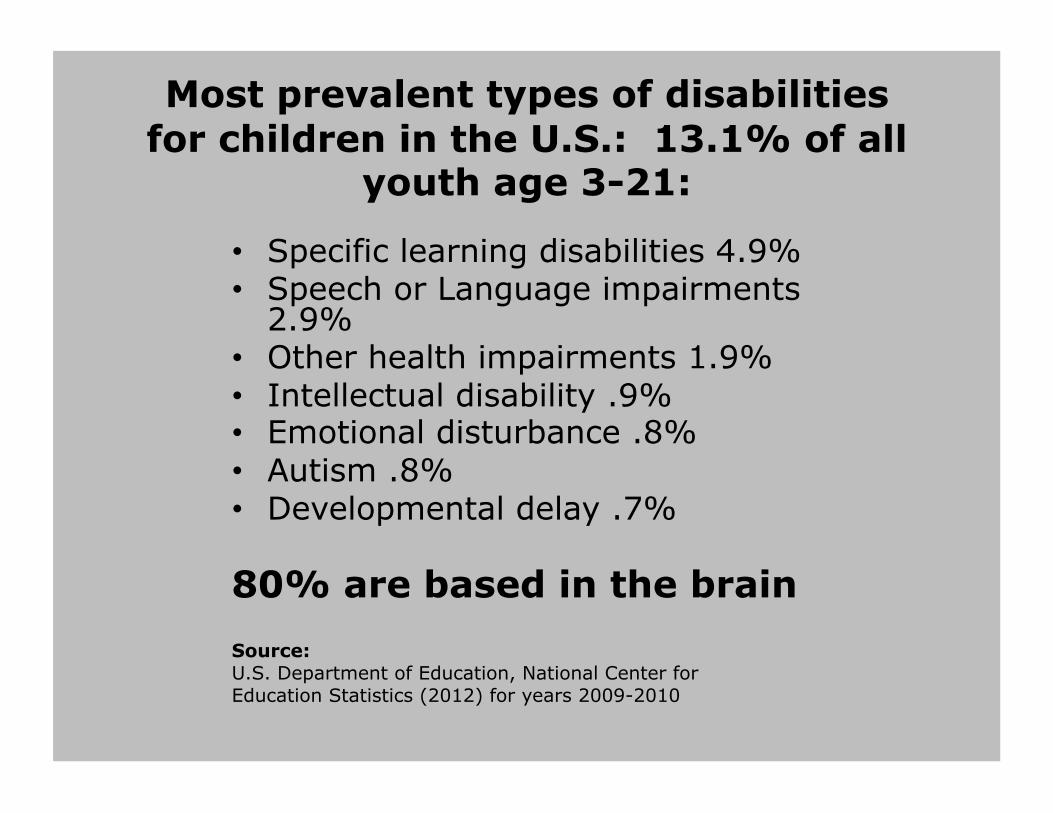
Most prevalent types of disabilities for children in the U.S.: 13.1% of all
youth age 3-21: • Specific learning disabilities 4.9% • Speech or Language impairments
2.9% • Other health impairments 1.9% • Intellectual disability .9% • Emotional disturbance .8% • Autism .8% • Developmental delay .7%
80% are based in the brain
Source: U.S. Department of Education, National Center for Education Statistics (2012) for years 2009-2010
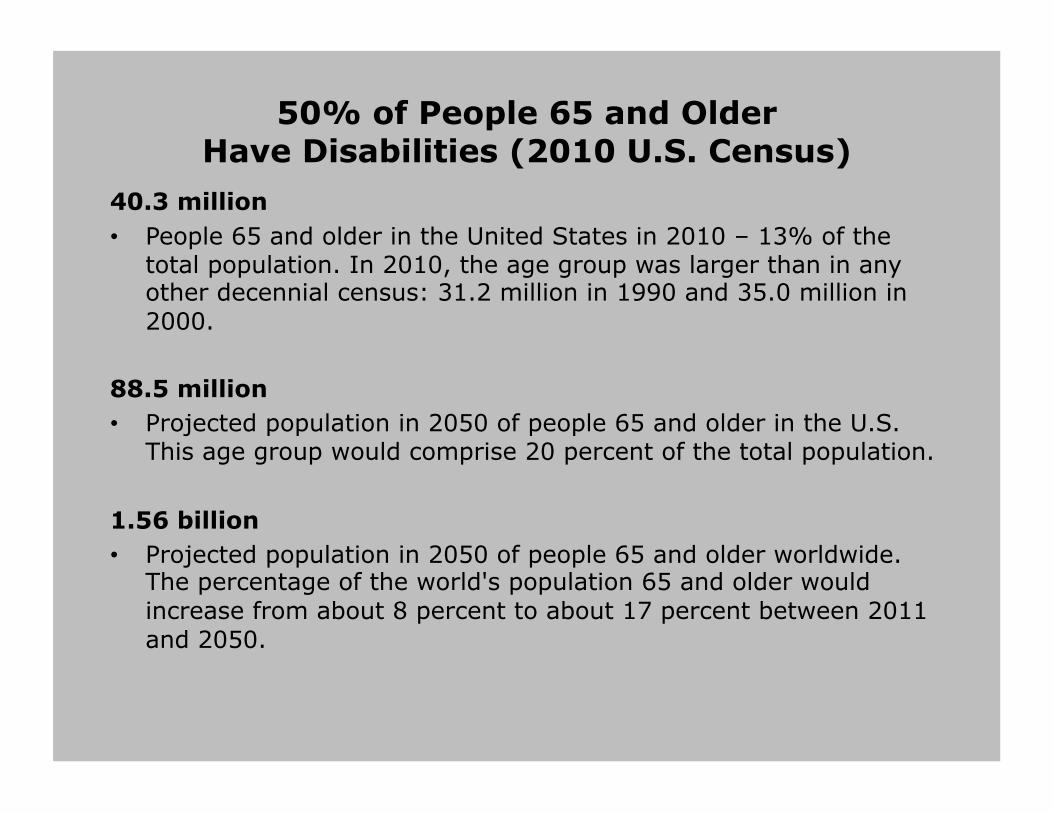
50% of People 65 and Older Have Disabilities (2010 U.S. Census)
40.3 million • People 65 and older in the United States in 2010 – 13% of the
total population. In 2010, the age group was larger than in any other decennial census: 31.2 million in 1990 and 35.0 million in 2000.
88.5 million • Projected population in 2050 of people 65 and older in the U.S.
This age group would comprise 20 percent of the total population.
1.56 billion • Projected population in 2050 of people 65 and older worldwide.
The percentage of the world's population 65 and older would increase from about 8 percent to about 17 percent between 2011 and 2050.
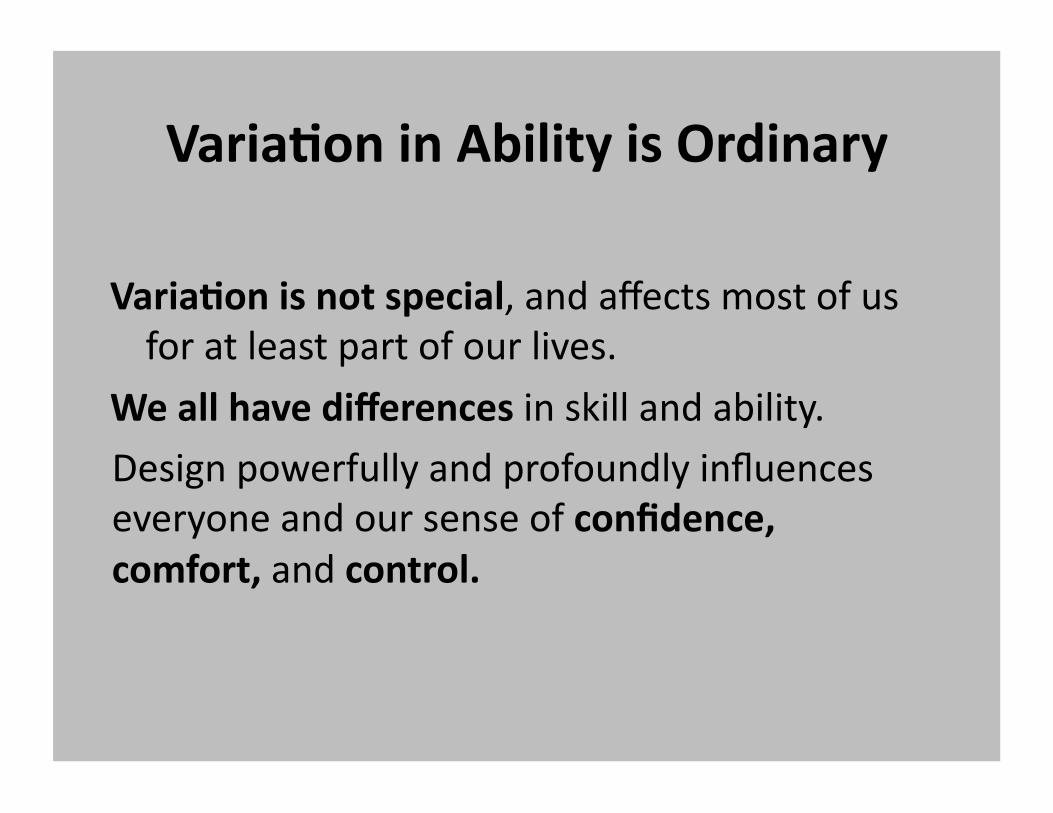
Varia%on in Ability is Ordinary
Varia%on is not special, and affects most of us for at least part of our lives.
We all have differences in skill and ability.
Design powerfully and profoundly influences everyone and our sense of confidence, comfort, and control.
How can architecture and design
help eliminate discrimination?