Embed Size (px)
Citation preview

Recommending overweight commodities and long enhanced GSCI.
Historically, when the US and Chinese output gap closes and inflation begins to rise,
this has been a buy signal for commodities. We believe the recent reacceleration in
global PMIs suggests commodity markets are entering a cyclically stronger
environment. Supply restrictions from policy actions should benefit oil, coking coal
and nickel in the near term while economic reductions should boost natural gas and
zinc. Accordingly, we are upgrading our GSCI returns forecast to +9.0%
/+11.0%/+6.0% on a 3, 6 and 12 month basis from -2.0%/+1.7%/+8.3%.
The increased likelihood of an OPEC cut motivates our near-term forecast
upgrade. Stronger than expected demand growth and lower production from high-
cost countries increase our confidence that the global oil market will shift into deficit
by 2H17 even with OPEC production above current levels. Thus, there is now a
stronger incentive for OPEC producers to halt inventory growth in 1H17 and normalize
the current high level of inventories with a short-duration production cut. We think a
cut should generate backwardation – helping OPEC grow market share by sidelining
higher-cost producers – and reduce oil price volatility – increasing the valuation of
their debt and equity.
Higher commodity prices likely to improve financial conditions. Commodity
prices are correlated with the accumulation and de-accumulation of EM excess
savings. Unlike in the 1970s, more sophisticated financial markets in the 2000s were
able to transform the excess savings into greater global liquidity that increased asset
values, lowered interest rates and improved credit conditions that spanned the globe.
Weak commodity prices in 2015 and 2016 acted as a drag on financial conditions.
A bullish dollar view is not incompatible with a bullish commodity view. We
expect that the positive roll return from backwardation in commodities will offset the
Commodity Watch
Why high commodity prices can be good for the world: Upgradingto overweight commodities in 2017

A stronger cyclical backdrop
expect that the positive roll return from backwardation in commodities will offset the
downward pressure from a strengthening dollar, as has historically been the case.
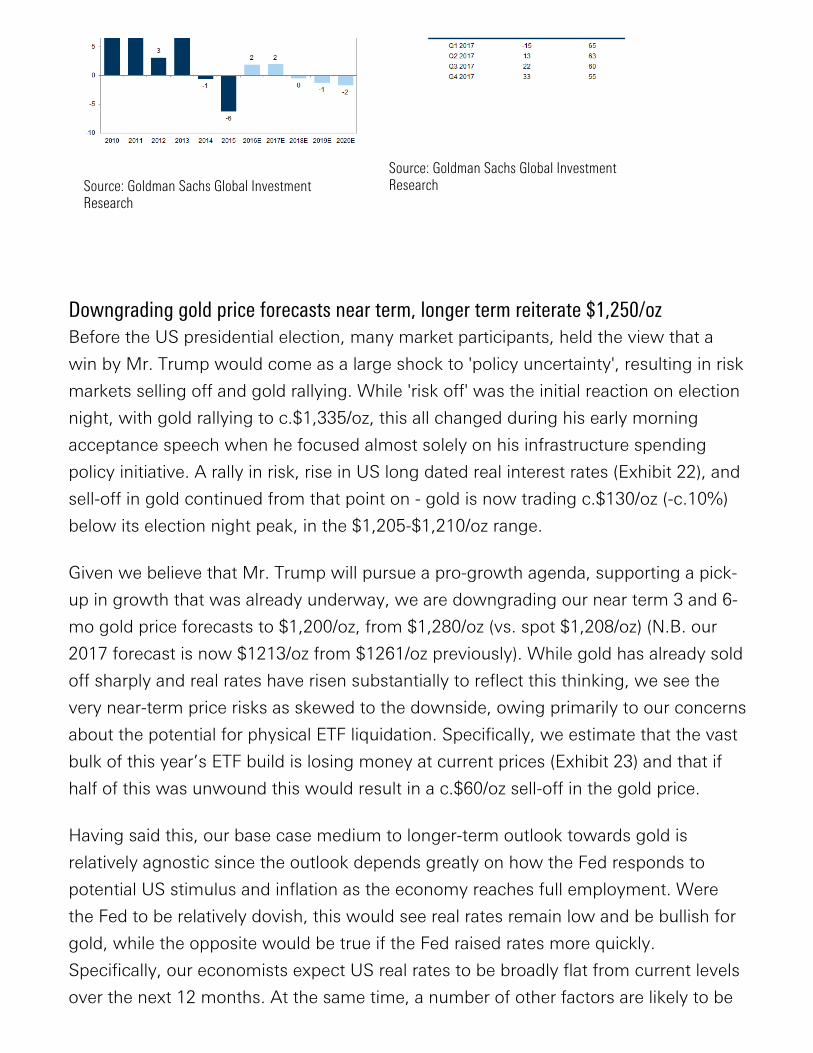
We upgrade our 3/6/12-month iron ore price forecasts to $65/63/55 per tonne.
Steel consumption is more resilient than expected and demand for iron ore is likely to
be supported further by incremental restocking across the steel supply chain. Further,
the pace of supply growth has slowed as a result of delayed capital expenditure and
operational challenges.
We downgrade our 3/6-month gold price forecast to $1200/toz on stronger
cyclical outlook. Downside risks remain from potential physical ETF liquidation.
However, our 12-month outlook is unchanged at $1250/toz as it depends on how the
Fed responds to potential US stimulus and inflation as the economy reaches full
employment.
Cyclically driven commodity reflation. We recommend going long the enhanced
GSCI commodity index (number 139) indexed to 100 with a target of 112 and a stop
of 94. We prefer the enhanced structure to reduce the current negative carry on oil.
It is tempting to blame the sharp post-election rally in industrial metals prices on
President-elect Trump’s platform of lower taxation and higher public spending on
infrastructure. Instead, we would argue this rally was a continuation of a reflation
trend put in place at the start of 2016 by the Chinese through credit stimulus aimed at
infrastructure projects and policy driven supply curtailments in coal where they have
50% of global production. Although this was policy driven and a Trump victory
increases the odds of further fiscal policy stimulus, these policy actions all act as a
tailwind on a US economy in the later stages of a business cycle pushing near
capacity.
Historically, when the US and Chinese output gaps close and inflation begins to rise,
this has been a buy signal for commodities. While the knee jerk reaction of copper
and iron ore prices to a Trump victory was likely too much too quickly, we believe that
commodity markets are entering a cyclically stronger environment after a mid-cycle
pause as evidenced by the recent reacceleration in global PMIs . Near-term, oil,
natural gas, zinc, coking coal and nickel are all poised to benefit from a cyclically
stronger demand backdrop due to supply restrictions from either policy actions (oil,

stronger demand backdrop due to supply restrictions from either policy actions (oil,
coking coal and nickel) or economic reductions (natural gas and zinc). Accordingly,
we are upgrading our GSCI returns forecast to +9.0% /+11.0%/+6.0% on a 3, 6 and
12-month basis from -2.0%/+1.7%/+8.3%, and moving to an overweight
recommendation on commodities on a three and 12-month basis. We are also
initiating a 2017 Top 10 trading recommendation to go long the enhanced GSCI index.
It is often thought that commodity returns are linked to the rate of economic
expansion. Thus, the type of broad mid-cycle economic slowdown experienced during
2016 causes investors to assume commodity investments will perform poorly.
Historical evidence contradicts this traditional argument, as following a mid-cycle
pause, commodities have entered extended bull markets where they have
outperformed other asset classes (see Exhibits 1 and 2). The reason is that commodity
returns do not depend so much on the rate of economic growth as they do on the
level of demand relative to supply. Commodity production is characterized by limited
ability to expand capacity in the short run. Even for fast-cycle US shale it is 3-6
months. Thus, producers tend to “over” produce during business cycle lows, building
inventories and driving prices down. But as demand increases during the expansion
and supply is curtailed, demand eventually exceeds capacity and inventories are
drawn down and prices appreciate.
The mid-cycle pause tends to be a good marker of this transition from surplus to
insufficient capacity, as it follows from the central bank’s assessment that the
economy is running out of capacity and the need for a tightening of monetary policy.
This shift to a tighter policy creates a slowdown where the economy can move close
to a recession, perhaps with a single negative quarter or even a very mild recession
before the expansion reasserts itself. These brief slowdowns are usually accompanied
by some Federal Reserve easing, or as in the case of 2016 a more dovish stance. Such
pauses do not typically materially affect the level of commodity demand; rather, they
just slow the rate of growth. Thus, once growth is re-established after the mid-cycle
correction commodities are well positioned to produce sustained and significant
positive returns.
Exhibit 1: The mid-cycle pause is a goodmarker of transition from surplus toinsufficient capacity...
Exhibit 2: ...and commodities tend tooutperform other asset classes ascapacity constraints bite

An OPEC cut to normalize inventories makes economic sense
insufficient capacity...
GDP growth (%qoq, SA); Mid-cycle Pause toPeak of Cycle
Source: BEA, CBS, Goldman Sachs GlobalInvestment Research
capacity constraints bite
S&P GSCI performance relative to S&P 500(equities) and 10Y US Treasury (bonds) (%,total returns)
Source: S&P, Bloomberg, Goldman Sachs GlobalInvestment Research
Our upgrade to the near-term return forecasts is driven primarily by the increased
likelihood of an OPEC production cut that is aimed more at normalizing inventories to
reduce oil price volatility and create backwardation than to create sustainable price
increases (see Oil: Tactically bullish on stronger OPEC cut rationale). As a result, we are
not changing our 2017 WTI price forecast of $52.50/bbl, we are just shifting the
upside from late next year to the near-term, and moving some downside into late next
year.
Oil fundamentals have weakened sharply since OPEC announced a tentative
agreement to cut production in late September, pushing prices near our previous
target of $43/bbl, and absent such a cut we now expect a large surplus of 0.7 mb/d in
1Q17. Importantly though, the combination of stronger expected demand growth and
lower production from high-cost countries in decline, leave us more confident that the
global oil market will shift into deficit by 2H17 even at OPEC production above current
levels.
With greater certainty that deficits will finally materialize, there is now a stronger
economic incentive for OPEC producers to prevent a further rise in inventories in
1H17 and instead act to normalize the current high level of inventories through a short
duration production cut. We believe that such a cut will likely generate backwardation

The risk reward suggests getting long now
duration production cut. We believe that such a cut will likely generate backwardation
– helping them grow market share by sidelining higher-cost producers – as well as
reduce oil price volatility – which should increase the valuation of the debt and equity
they are issuing. In our view, the goal of normalizing inventories should however not
target elevated oil prices as the flattening of the cost curve and the unprecedented
velocity of the shale supply response would make such an endeavor rapidly self-
defeating above $55/bbl.
During 2H17, the key to investment returns in energy is the expected return to
backwardation driven by a successful OPEC cut. To understand why this would make
sense for OPEC to do in the New Oil Order where a flattening of the oil cost curve
incentivizes low-cost producers to grow revenues through increased market share, it
is important to emphasize that backwardation which is achieved though lower
inventories actually enables this strategy by removing the ability of higher-cost
producers to hedge their future production at a higher price. For example, looking at
three B+ rated US E&Ps, our HY energy analysts estimate that in a $45/bbl spot price
environment, a 1-yr contango of $5/bbl fully offsets the high cost of funding for that
period.
Should OPEC output average 33.0 mb/d in 1H17 before seasonally ramping up, we
expect OECD inventories (measured in days of demand coverage) to normalize to their
three-year average by 2Q17, at a level that warrants backwardation in the Brent crude
oil forward curve. Normalizing inventory levels leads us to raise our 3-month WTI price
forecasts to $55/bbl from $45/bbl. We are however reducing our 12-month WTI
forecasts to $50/bbl from $60/bbl on an expected resumption in OPEC production
growth, higher US shale supply response to the 1H17 rally as well as a further
strengthening of the US dollar.
If our assessment of the odds of a cut are wrong and OPEC fails to agree to a cut, we
would expect prices to decline from current levels as it implies greater sequential
production from the group in a battle for market share. The end outcome would
however likely still lead to our 2017 forecast of $52.50/bbl, with a path similar to what
we had previously published: low prices in 1Q17 generating a recovery in prices
through the year through further high-cost producer attrition. However, in this
environment the investment returns would likely be backend loaded as opposed to
front end loaded. Nonetheless, given today’s entry point and the now much higher
likelihood of an OPEC production cut, we believe the 9% expected near-term returns

Why higher commodity prices can be good for the world
likelihood of an OPEC production cut, we believe the 9% expected near-term returns
following an OPEC production cut more than offset the potential drag on returns from
a failed OPEC agreement of -2.0% on a 3-month horizon.
Exhibit 3: The risk reward from our current forecast now looks more attractive
Source: S&P, Goldman Sachs Global Investment Research
Not only does a production cut make economic sense for OPEC, but higher oil and
commodity prices also create better financial conditions for the world. We saw the
financial benefits that China derived this year from higher coal, iron ore and steel
prices by reducing default risks in the most leveraged industries, but we also saw this
year how low oil prices never provided the economic boost many thought would
materialize. Instead, we believe higher oil prices will give the US Federal Reserve more
runway in raising rates through improved financial conditions. This is the opposite of
what we saw in 2016 when lower oil prices weakened financial conditions as the Fed
tried to raise rates.
Going back to the early 2000s, despite warnings by economists that high oil prices
would slow growth, the global economy surged ahead even as oil prices climbed
above $100/bbl, and despite hopes of a growth tailwind due to lower oil prices since

above $100/bbl, and despite hopes of a growth tailwind due to lower oil prices since
2014, global growth slowed significantly when prices plunged toward $25/bbl earlier
this year. The experience from the 1970s created this deep rooted belief that, when oil
prices increased, the wealth transfer from the low-saving developed markets to the
high-saving emerging markets would slow growth due to the relatively lower marginal
propensity to consume in the emerging markets and do the opposite as oil prices
declined.
What this explanation failed to address was the high correlation between oil prices
and excess savings and the greater liquidity and credit availability that these excess
savings in the emerging markets created from 2002 to 2014 and eventually took away
post 2014. Unlike the 1970s, more sophisticated financial markets in the 2000s were
able to transform this excess savings into greater global liquidity that increased asset
values, lowered interest rates and improved credit conditions that spanned the globe.
The improved financial conditions generated from the excess savings that resulted in
part from higher oil prices more than offset the drag from a lower marginal propensity
to consume and vice versa as oil prices declined after 2014.
As oil prices surged and global trade boomed during the 2000s so did the size of
excess savings outside of the US (see Exhibit 4), growing from $1.0 trillion in 2001 to
a peak of $7.0 trillion in 2014 before oil prices rolled over in June of that year. Today,
excess savings stand at $5.8 trillion (this does not include at least another $3.5 trillion
which is held in sovereign wealth funds), and as a point of comparison, M2 in the US
is $13.0 trillion. These savings in turn drive asset values including homes and financial
assets which impacts a consumer’s assessment of their permanent income as well as
impacts their access to credit markets to borrow and smooth their consumption. In
other words, the difference between today and the 1970s is that oil creates global
liquidity through a far more sophisticated financial system.
Exhibit 4: EM excess savings peaked in June 2014 and have been decreasing since
bn $

Source: Haver, Goldman Sachs Global Investment Research
The key to this argument is twofold. First, oil prices are not simply a reflection of the
price of hydrocarbons, but rather on average the price of all traded goods (see Exhibit
5). The common denominator across nearly all traded goods is the US dollar due it
being the numeraire (currency of denomination) in global trade, and as the correlation
between the US dollar and oil rose in the 2000s, so did the correlation across the
prices of all commodities and traded goods. Driving this correlation between oil prices
and the US dollar was the excess savings itself. Higher oil prices led to more dollar
accumulation which put downward pressure on the dollar relative to other currencies
(see Exhibit 6).
Exhibit 5: Oil is highly correlated to theprice of all traded goods
index(lhs), $/bbl (rhs)
Source: CPB, Bloomberg, Goldman Sachs Global
Exhibit 6: Higher oil price leads togreater accumulation of excess savingsby EMs
Change in EM excess savings (%yoy, verticalaxis); Change in oil pirce (%yoy, horizontalaxis)

Source: CPB, Bloomberg, Goldman Sachs GlobalInvestment Research
Source: Haver, Bloomberg, Goldman Sachs GlobalInvestment Research
Although oil and commodities only represent 34% of global trade, the impact of
commodity prices on global savings is far larger than the commodity markets alone as
the prices of all traded goods denominated in dollars are correlated with the oil price
(see Exhibit 7). For example, the Korean export basket is priced relatively constant in
Korean Won, but because exports are transacted in US dollars and the price of oil is
correlated with the dollar, the dollar price of Korean exports are correlated with the
price of oil and so is their excess savings. Same goes for China and the rest of the EM.
As a result, oil prices are highly correlated with the accumulation and de-accumulation
of global excess savings, even in China (see Exhibit 8).
Exhibit 7: Dollar price of Korean exportsis correlated with oil
index (lhs), $/bbl (rhs)
Source: Haver, Bloomberg, Goldman Sachs GlobalInvestment Research
Exhibit 8: Even China's accumulation ofexcess savings is highly correlated withoil
Change in China excess savings (%yoy,vertical axis); Change in oil pirce (%yoy,horizontal axis)
Source: Goldman Sachs Global InvestmentResearch
Second, the credit multiplier on the excess savings (Eurodollar) is higher than the

Second, the credit multiplier on the excess savings (Eurodollar) is higher than the
domestic US credit multiplier (see Exhibit 9). Accordingly, higher oil prices amplify the
dollar liquidity outside of the US and vice versa. This implies that by creating credit
availability, higher oil prices improve global financial conditions while lower oil prices
tighten financial conditions (see Exhibit 10). In the current environment of lower oil
prices, slower global trade and weaker Chinese growth, this linkage between trade, oil
and liquidity would suggest that credit availability on a global basis is likely tighter
than what is commonly viewed. This is why higher oil and commodity prices from
current levels should be viewed as positive to global growth and that the Fed could
get more runway in raising rates from an OPEC production cut.
Exhibit 9: Ex-US (Eurodollar) moneymultiplier is currently higher than USdomestic multiplier
Source: BIS, Haver, Goldman Sachs GlobalInvestment Research
Exhibit 10: Higher oil price improvesdollar liquidity for EMs
bn $ (lhs), $/bbl (rhs)
Source: BIS, Haver, Goldman Sachs GlobalInvestment Research
Exhibit 11: Rising oil prices used to be adrag on US growth; now they have verylittle cumulative impact
VAR model impulse response of real GDP to 1SD oil price shock
Exhibit 12: Higher oil prices also nowease (not tighten) US financial conditions
VAR model impulse response of US FCI to 1SD oil price shock

We believe you can be both commodity and dollar bullish in 2017
Source: Goldman Sachs Global InvestmentResearch
Source: Goldman Sachs Global InvestmentResearch
Given the high negative correlation between commodity prices and the US dollar that
has existed since 2002 (see Exhibit 13) and given the bullish US dollar back drop post
the US election, it raises the question whether our FX strategists’ bullish dollar view is
consistent with our bullish commodity view. We believe so. To answer this question it
is useful to understand what drives the dollar-commodity correlations. At the core of
this correlation is once again the relationship between the price of oil and global
excess savings (see Exhibit 14).
Exhibit 13: Since 2002 there has been ahigh negative correlation betweencommodity prices and the US dollar...
USD Trade Weighted Index (LHS); BrentCrude Oil (RHS)
Source: ICE, Goldman Sachs Global InvestmentResearch
Exhibit 14: ...driven by global excesssavings
Global Excess Savings vs. USD vs Oilcorrelations
Source: CME, ICE

1. While we expect commodity prices to rise, we do not see them rising by enough to
significantly change the financial pressures on EM producers. In a world where
The underlying logic is quite simple. As the dollar is the numeraire for oil, commodities
and global trade, higher oil prices create excess savings in dollars which weigh on the
dollar and vice versa when declining oil prices reduce excess savings. We find that
statistically if the change in oil price leads to a change in excess savings, then there is
a negative correlation between the price of oil and the dollar (see Exhibit 15).
Exhibit 15: When oil is positively correlated with excess dollar savings it becomes negativelycorrelated with the dollar
Source: Goldman Sachs Global Investment Research, Haver, Bloomberg
Therefore, there are two ways to get positive commodity returns in a bullish dollar
environment. The first is to break the correlation between the dollar and oil by
breaking the correlation with oil and excess savings. The second is for returns to be
generated solely from backwardation without price changes, for which there is
precedent for in the late 1980s and mid 1990s, an environment that has been likened
to the upcoming environment. We believe that both forces will likely be at work in
2017:

$50/bbl to $55/bbl oil now looks to be the long-run equilibrium price, there are no
excessive windfall gains to be saved by commodity producers. Rather commodity
income is more likely to be seen as permanent income and hence spent
immediately, helping to finance both fiscal transfers (which remain much higher
than in the last phase of the commodity supply cycle) and efforts to diversify
excessively commodity-centric economies (see Exhibit 16);
2. Our more optimistic outlook for commodity returns during 2H17 is driven to a large
extent by “roll returns”. The benefit of this return is not seen by the commodity
producer (who sells longer dated options), or the commodity consumer (buying
near the front of the curve), but rather the investor who assumes the risk in
transferring between the two. Since roll returns are highly dependent on the level
of inventories, and the willingness to hold inventories is itself a function of the cost
of holding these inventories and hence funding costs, as interest rates rise with a
cyclically stronger backdrop the amount of inventory held should decline, boosting
commodity roll returns – even as the US dollar appreciates due to higher real
interest rate differentials. We expect that the positive roll return from
backwardation will offset the downward pressure from a strengthening dollar, as
has historically been the case (see Exhibit 17).
Exhibit 16: The correlation between oiland the trade weighted USD has alreadystarted to break down
Source: CME, Goldman Sachs Global InvestmentResearch
Exhibit 17: A stronger dollar hashistorically coincided with lower oilprices but not lower roll returns
WTI 1-yr return (spot or roll, % horizontal); 1-yr USD TWI return (% vertical), 1986-2016
Source: Goldman Sachs Global InvestmentResearch

Commodity returns depend more on supply and demand levels, not growth rates
A lesson for OPEC: How China benefited from supply management
Industrial metals markets are either already backwardated (aluminum and iron ore) or
very close (copper, zinc and nickel), which reduces the negative carry of being long
commodities. As the economic cycle matures next year higher demand levels will
likely stress the ability for some key industrial metals to meet demand and lead to a
decline in inventory and hence backwardation. The key is commodity returns do not
depend so much on the rate of economic growth as they do on the level of demand
relative to supply. So while property-related demand growth in China is slowing, the
level of demand is still very high requiring a high level of supply even if growth slows.
When commodity prices rallied in 2016, we learned a lot about the ability of
commodity supply to respond. In zinc and coking coal, sharply higher prices have
failed to create substantial new supplies. In oil, we gained confidence of a clear
delineation in global cost curve near $50/bbl given US drilling activity when prices
surged above that threshold, with $55/bbl or higher likely required to ramp up activity
for higher-cost producers. In copper, prices below $5000/t created supply
curtailments even as long-term price insensitive projects came online in late 2016.
Because we see near-term downside in copper and iron ore given the sharp rise in
these commodities post-election (see Metals' pricing of potential US infrastructure
spending: Too much too fast
(https://research.gs.com/content/research/en/reports/2016/11/12/1e221d6b-5ad9-
4bca-ac15-7145a656da4c.html)), we would view energy has the primary driver of
near-term returns with metals contributing more to returns in 2017H2 and beyond.
China demonstrated in 2016 the financial benefits of higher commodity prices. At the
beginning of the year, concerns about rising Chinese corporate debt levels and non-
performing loans were particularly acute. The potential macroeconomic policy
response of lowering interest rates was also concerning since this would create
downward pressure on the RMB and encourage capital outflows, potentially driving a
self-reinforcing negative loop for Chinese growth. The relatively blunt macroeconomic
action of lowering interest rates would also place further pressure on the balance
sheets of the banks carrying the non-performing loans.
Instead, China’s response was microeconomic and targeted. The government

Instead, China’s response was microeconomic and targeted. The government
implemented policies that stimulate the earnings of the corporates with the highest
credit risks – property and materials (Exhibit 18). It did this via supply side reforms
(coal mine working hour limitations, steel capacity closures) and property specific
credit easing (easier mortgage lending criteria), which drove coal, steel and housing
prices higher, which drove an improvement in both corporates' and the banks’
balance sheets, reducing non-performing loans and systemic risk (Exhibit 19). The
policies enacted have also at least temporarily ended a sustained period of producer
price deflation, and driven an increase in household wealth via property price
inflation.Although China’s still extremely high investment share of GDP and sharply
rising debt to GDP ratio and debt service burden remain concerning from a longer-
term macroeconomic perspective, these supply side reforms created runway for
growth in 2017.
Exhibit 18: The Chinese governmentimplemented policies to stimulateearnings of corporates with the highestcredit risks
Net debt/equity (vertical axis);EBITDA/interest expense (horizontal axis)
Source: Bloomberg, Goldman Sachs GlobalInvestment Research
Exhibit 19: In turn, this reduced non-performing loans and hence systemicrisk
Source: Goldman Sachs Global InvestmentResearch
For Chinese coal these production controls amount to an indirect bailout of the
Chinese coal industry that minimizes the impact on the government and the financial
sector, unlike more conventional methods such as subsidies and write-downs that

Upgrading iron ore forecast for 2017
sector, unlike more conventional methods such as subsidies and write-downs that
require direct injections of capital. In our view, active government intervention in the
domestic coal market may well continue until the end of decade given the significant
debt burden of the Chinese coal industry. Domestic production and inventory levels of
thermal coal are recovering following the gradual lifting of the 276-day limit on
operating hours, and recent contracts negotiated by state-owned miners at a
significant discount to spot prices increase our conviction that regulators are targeting
an equilibrium price in line with marginal cost. We expect inventories to normalize
during the first quarter of 2017, and the likely decline in Chinese demand for imported
coal should allow the Newcastle index to revert to US$60/t from 2Q onward. Although
the steep backwardation in the forward curve reflects market expectations of
restocking, we still see downward risks even after a c.15% sell-off in deferred prices.
We upgrade our 3/6/12-month iron ore price forecasts to $65/63/55 per tonne. In
particular, we believe the need for large cuts in seaborne supply has been postponed
to 2018 due to a combination of factors that moderate the surplus next year. First,
steel consumption is more resilient than expected and demand for iron ore is likely to
be supported further by incremental restocking across the steel supply chain. Second,
the pace of supply growth has slowed as a result of delayed capital expenditure and
operational challenges. Third, capital flows into the iron ore market are likely to
support prices as long as it provides speculative investors with a hedge against a
weaker CNY. We also revise our long-term equilibrium price to US$45/t on the back of
stronger commodity currencies. Rising inventories can offset the divergence between
supply and demand for the next twelve months, but this trend is unsustainable in the
long run and we still expect prices to revert back to the seaborne marginal cost of
production.
On the demand side, while real estate investment in China is expected
(https://research.gs.com/content/research/en/reports/2016/11/20/abb3205d-2385-
4a7a-a582-5ae4964b3150.html) to decelerate modestly in 2017 after the strong price
and sales gains in 2016, continued strength in infrastructure investment and heavy
machinery production are likely to persist. Our steel demand model, which takes
infrastructure investment, property investment, and excavator sales as inputs, predicts
a 2% year-over-year increase in Chinese steel consumption in 2017 (Exhibit 20). The
global macro backdrop is also supportive of steel demand. Our global economics
team projects
(https://research.gs.com/content/research/en/reports/2016/11/16/100ac98c-af5f-458a-

(https://research.gs.com/content/research/en/reports/2016/11/16/100ac98c-af5f-458a-
96a0-b8828627a838.html) global real GDP to growth 3.5% in 2017 vs. 3.0% in 2016.
More importantly, the pickup in fixed investment growth is more pronounced, from
1.5% in 2016 to 3.2% in 2017. Because fixed investment has a stronger link to capex
commodities, our global outlook further supports global demand for steel in 2017.
On the supply side, the Samarco disaster in late 2015 took 28Mt of iron ore
production out of the market and the timeframe for a resumption of operations
remains uncertain. The S11D project, which will have 90Mt annual capacity when fully
in production, is ramping up at a slower pace than anticipated. In China, domestic iron
ore production fell 10% in 2016. While we expect iron ore supply to rise in 2017, we
think this can be partly absorbed by inventory restocking. For example, steel inventory
held by traders and mills has remained at historically low levels in 2016 and we expect
it to return to historical normal levels. Iron ore port inventory has been rising in 2016
as the weakening of local currency drove steel mills to secure supply now for future
uses. As we expect RMB to depreciate another 5% in 2017, we think this dynamic can
continue and increases in port inventory also help take seaborne iron ore supply off
the market.
While the post-election rally appeared to be too much too fast to us and we expect
iron ore prices to decline from the current level of $73/t, the more favorable
fundamental demand and supply picture leads us to believe that iron ore prices can
stay above $60/t during the first half of 2017. In 2017 H2, however, rising supply
should begin to put downward pressure on iron ore prices as demand stays stable but
the inventory restocking process runs into physical constraints and market behavior
starts to reflect the downside price risk of an eventual contraction in Chinese steel
demand. Therefore, we forecast iron ore prices to fall to $55/t by the end of 2017
(Exhibit 21).
Exhibit 20: We predict a 2% year-over-year increase in Chinese steelconsumption in 2017
Exhibit 21: We see iron ore prices fallingto $55/t by end-2017
Downgrading gold price forecasts near term, longer term reiterate $1,250/oz
Source: Goldman Sachs Global InvestmentResearch
Source: Goldman Sachs Global InvestmentResearch
Before the US presidential election, many market participants, held the view that a
win by Mr. Trump would come as a large shock to 'policy uncertainty', resulting in risk
markets selling off and gold rallying. While 'risk off' was the initial reaction on election
night, with gold rallying to c.$1,335/oz, this all changed during his early morning
acceptance speech when he focused almost solely on his infrastructure spending
policy initiative. A rally in risk, rise in US long dated real interest rates (Exhibit 22), and
sell-off in gold continued from that point on - gold is now trading c.$130/oz (-c.10%)
below its election night peak, in the $1,205-$1,210/oz range.
Given we believe that Mr. Trump will pursue a pro-growth agenda, supporting a pick-
up in growth that was already underway, we are downgrading our near term 3 and 6-
mo gold price forecasts to $1,200/oz, from $1,280/oz (vs. spot $1,208/oz) (N.B. our
2017 forecast is now $1213/oz from $1261/oz previously). While gold has already sold
off sharply and real rates have risen substantially to reflect this thinking, we see the
very near-term price risks as skewed to the downside, owing primarily to our concerns
about the potential for physical ETF liquidation. Specifically, we estimate that the vast
bulk of this year’s ETF build is losing money at current prices (Exhibit 23) and that if
half of this was unwound this would result in a c.$60/oz sell-off in the gold price.
Having said this, our base case medium to longer-term outlook towards gold is
relatively agnostic since the outlook depends greatly on how the Fed responds to
potential US stimulus and inflation as the economy reaches full employment. Were
the Fed to be relatively dovish, this would see real rates remain low and be bullish for
gold, while the opposite would be true if the Fed raised rates more quickly.
Specifically, our economists expect US real rates to be broadly flat from current levels
over the next 12 months. At the same time, a number of other factors are likely to be
supportive for gold, at the margin, over the medium to long term. Valuation levels for

This past year was likely the mid-cycle pause, but patience is still required
supportive for gold, at the margin, over the medium to long term. Valuation levels for
alternative asset classes such as equities and bonds remain highly elevated by
historical standards, mine supply growth is likely to be weak over the next 12-24
months, and China's RMB is set to depreciate further, to 7.3 by year-end 2017 on our
FX team's forecast, potentially supporting gold ETF purchases (especially in the
context of a slowing growth in Chinese property prices). Overall, these considerations
result in us leaving our 12-mo and 2018 price forecasts of $1,250/oz unchanged.
Exhibit 22: Risk rallied after the USpresidential election
Source: Bloomberg
Exhibit 23: We estimate that the vastbulk of this year’s ETF build is losingmoney at current prices
Source: Bloomberg, Goldman Sachs GlobalInvestment Research
Despite the spring rally in commodity prices this past year, commodity returns have
been mostly flat in 2016, up 1.4% year to date. This suggests that despite the recent
cyclical improvement in macroeconomic data, investors have not missed the
opportunity to get long the reflation trade in commodities. However, we would
caution that although we currently have a significant number of signals that markets
are entering the third phase of the business cycle (above trend and growing) where
commodities perform the best relative to other asset classes, given the low economic
volatility we have experienced since the global financial crisis, we would remain
cautious. We have learned over the past eight years that markets have been slow to
react and that this reflation trade could take a while to play out. But most importantly,

Price action, Volatility and Forecasts
react and that this reflation trade could take a while to play out. But most importantly,
we view the risk reward today as now supporting a long position in commodities and
hence feel comfortable going overweight the asset class.
S&P GSCI® Enhanced Commodity Index and strategies’ total return and forecasts
Source: Goldman Sachs Global Investment Research
Performance of S&P GSCI® Enhanced Commodity Index and Strategies through Nov 18, 2016

Source: Goldman Sachs Global Investment Research
Price action, volatility and GS forecasts

Commodities in a Nutshell
Energy
Source: Goldman Sachs Global Investment Research
Crude Oil – 12m target $50/bbl
Oil fundamentals have weakened sharply since OPEC announced a tentative
agreement to cut production and we now expect a large surplus of 0.7 mb/d in 1Q17
in the absence of such a cut. Importantly though, data over the past two months leave
us more confident that the global oil market will shift into deficit by 2H17 even with
OPEC production above current levels, on the combination of stronger expected
demand growth and lower production from high-cost countries in decline.
With greater certainty that deficits will finally materialize, there is now a stronger
economic incentive for OPEC producers to prevent a further rise in inventories in
1H17 and instead act to normalize the current high level of inventories through a
short-duration production cut. In our view, the goal of normalizing inventories should,
however, not target elevated oil prices as the flattening of the oil cost curve and the
unprecedented velocity of the shale supply response would make such an endeavor
rapidly self-defeating above $55/bbl. Our base case is now that an OPEC production
cut will be announced and implemented and normalizing inventory levels will generate
backwardation by 2Q17. Political risks can still derail an otherwise economically sound
decision and we believe an outcome where OPEC does not agree to a cut is near-term
bearish – even from current price levels – as it implies greater sequential production
from the group in competition for revenues and market share.
RBOB Gasoline – 12m target $1.43/gal
Atlantic basin inventories have been drawing this year aided by strong growth in
global gasoline demand and higher than expected exports to Latin America – in
particular Mexico – due to persistent refinery issues in that region. Going forward, we

particular Mexico – due to persistent refinery issues in that region. Going forward, we
expect continued robust demand growth given our economists' forecast for strong
consumption expenditures growth. Furthermore, the current backwardation in
forward margins will incentivize too few runs to meet demand. As a result, we require
cracks to strengthen to lift margins to incentivize incremental refinery utilization. Given
our price outlook for crude oil and the requirement for margins to rise to incentivize
refinery runs, we expect summer 2017 gasoline cracks to average $20/bbl vs.
$15.50/bbl as the forward curve indicates. With our outlook for crude spreads to go
into backwardation by 2Q17 and with backwardated margins incentivizing too little
runs, we expect RBOB spreads to go into backwardation as barrels come out of
storage to meet short-term demand.
Heating Oil – 12m target $1.60/gal
Atlantic basin distillate stocks have remained high this year primarily because of weak
global demand, itself driven by the succession of a warm 1Q16 and lackluster global
industrial production. Going forward, however, an improved outlook for industrial
activity, higher commodity prices and the credit stimulus from China should drive
diesel demand higher next year. We see two upside risks to our forecasts: first, higher
metal and coal prices could support mining output with each 1% increase in global
mining activity raising diesel demand by 70 kb/d. Second, any incremental US
infrastructure spending beyond our US economists' base case of $50 bn would
increase US diesel demand, with our modeling pointing to a 10 kb/d demand increase
per $10 bn of infrastructure spending. Net, the current backwardation in forward
margins is incentivizing too few runs to meet improving demand. As a result, we
require cracks to strengthen to lift margins to incentivize incremental refinery
utilization. However, given higher starting inventory levels, we expect most of the
work to be done by gasoline with stronger than average RBOB-Heating oil differentials
keeping distillate cracks modestly higher than the current market. Given our outlook
for crude oil and the requirement for margins to increase to incentivize refinery runs to
meet demand, we expect 2017 cracks to average $1.50 / bbl higher than the forward
curve indicates.
Natural Gas – 12m target $3.00/mmBtu
Our expectation heading into 2017 was that low cost natural gas production growth
would be curtailed by a lack of new offtake capacity in Appalachia and low oil drilling
activity for associated gas. Mild temperatures so far this fall, record high gas
Industrial Metals
activity for associated gas. Mild temperatures so far this fall, record high gas
inventories and forecasts for continued above normal temperatures as a result pose
downside risk to our $3.30/mmBtu 3-mo forecast which was based on the need to
incentivize legacy shale gas drilling early next year. However, with four months of
winter weather still to play out, strong coal to gas switching on weaker gas and higher
coal prices and strong gas demand from exports (Mexico, LNG), we believe risks to
our 6-mo $3.00/mmBtu price forecasts are skewed to the upside, especially if
Northeast pipelines scheduled to come online in late 2017 get further delayed.
LNG – 12m forecast US$4.50/mmBtu
Power generation fuels have enjoyed a strong rally in the run-up to peak winter
demand. Although lower availability of nuclear plants and reduced hydro levels are
supporting conventional power generation in Europe and Asia, we believe that
Chinese policies to support domestic coal prices have created additional headroom for
the LNG market and are partly responsible for a rise to US$7.15/mmBtu in the JKM
index, up 30% in three months. We believe that further price upside is limited in the
short term because spot LNG is now close to parity with many oil-indexed contracts
that provide buyers with the option to increase deliveries. Moreover, the restart of US
exports following maintenance at Sabine Pass and the commissioning of new
liquefaction capacity in Australia and Malaysia should bring the global gas market
closer to surplus at a time when global coal prices are set for a sharp correction on the
back of rising Chinese coal output. The expansion of LNG capacity has another four
years to run and competition between fuels is therefore likely to intensify in 2017 –
particularly when hydro levels normalize in China and Scandinavia. We expect the
price premium of LNG over coal to shrink further in order to incentivize incremental
fuel switching, and spot prices should gradually converge towards the marginal cost
of supply set by Henry Hub.
Copper – 12m target $4,800/t
Copper prices have rallied sharply and net speculative positioning has reached its
highest level since 2005 over the past two months. We believe that while part of the
rally has been warranted, prices have rallied too much too soon, and we expect
copper will decline to c.$5,000/t on a 3-mo view. The market is, in our view,
positioned for a major acceleration in Chinese and/or global metals demand growth,
with our modelling estimates suggesting that the copper market is pricing a near-

tripling in global copper demand growth to c.6% in 2017. By contrast, we expect
Chinese copper demand growth will slow in the near term on Chinese property policy
tightening, and that Mr. Trump's stimulus is unlikely to impact metals demand directly
until it kicks in later in 2H17 or early 2018. Further, we are entering the seasonally
weak period for copper demand (1Q), during which period inventories normally build
to the tune of c.400kt even in a balanced market (and our base case is for a small-
moderate surplus market during 2017). For further details please see the following link
(https://research.gs.com/content/research/en/reports/2016/11/15/8d950326-3f0a-
4552-8cfa-035de2ccfad8.html).
Nickel – 12m target US$11,000/t
We continue to anticipate an announcement of large-scale Filipino mine suspensions
and resulting ore stocks drawdowns to low levels. We now expect this will drive
nickel prices up to c.$12,500/t over the next three months, relative to current pricing
of c.$10,800/t. The potential for nickel prices to rise more than our base case 3-mo
target of $12,500/t is high in our view, with upside in the bull case of larger and/or
more permanent than expected Philippines mine suspensions potentially driving
prices up to $15-16,000/t. The main downside risk is a substantial decline in Chinese
steel and coking coal prices, which could weigh on sentiment in the ferrous sector as
well as reduce costs of production. For further details please see the following link
(https://research.gs.com/content/research/en/reports/2016/11/15/8d950326-3f0a-
4552-8cfa-035de2ccfad8.html).
Aluminium – 12m target US$1,600/t
We continue to see the market in small deficit in 2016 and rebalancing in 2017. While
we do not forecast a surplus market in aluminium in 2017, we are modestly bearish
on prices taking a 3-12 month view, based on our forecast for Chinese production
cost deflation (our economists forecast the RMB to depreciate to 7.3 by year-end
2017) and on our view that thermal coal prices will decline from current levels.
Therefore, even if current margins in China were sustained, prices would likely
decline. Further, LME aluminium speculative positioning is at very high levels. For
further details please see the following link
(https://research.gs.com/content/research/en/reports/2016/11/15/8d950326-3f0a-
4552-8cfa-035de2ccfad8.html).
Zinc – 12m target US$2,800/t

Agriculture
Bulks
Zinc – 12m target US$2,800/t
We remain bullish on the outlook for cash zinc prices through 2017. We see zinc
rising to $2,800/t on a 12-mo view based on our forecast of a 500kt refined deficit for
2017, and our modelling of the inventory path on cash-5-year time spreads, and we
see the risks surrounding our 2017 zinc prices forecasts as skewed to the upside.
While net speculative length in zinc is significant, we believe it will be maintained
given our view that the forward fundamental will become incrementally bullish. The
mine supply tightness theme continues to play out on the back of price related supply
closures (Glencore and Chinese mines) and non-price related depletions (Century and
Lisheen mines) substantially tightening the market, and likely resulting in smelter
closures over the next three months. Environmental restrictions appear to be affecting
the ability of Chinese mines to respond to what are record high domestic mine prices.
Meanwhile, long dated (5 year forward) zinc prices are trading near their all-time
highs, which could be attractive from a producer hedging perspective. For further
details please see the following link
(https://research.gs.com/content/research/en/reports/2016/11/15/8d950326-3f0a-
4552-8cfa-035de2ccfad8.html).
Corn – 12m target $3.35/bu
Soybean – 12m target $8.85/bu
Despite concerns late last spring that La Nina weather conditions would weigh on
growing conditions, the US 2016/17 harvest ended up record large for both corn and
soybeans. Further, with only weak La Nina weather conditions currently, the
beginning of the South American growing season is so far taking place under
favorable conditions. As a result, we expect that under normal weather conditions
going forward corn and soybeans prices will decline back to their marginal costs of
production over the coming year to limit further inventory builds, with our 12-mo
forecast for both crops below the forward curve. Continued strong soybean demand
from China leaves us, however, forecasting that soybeans prices will continue to trade
at a historically elevated premium over corn prices to continue to incentivize acreage
allocation.
Iron Ore – 12m target $55/t

A combination of stronger Chinese steel demand, which was in turn driven by the
large credit injection earlier in the year, and lower-than-expected supply resulted in an
upward trend in iron ore prices in 2016. But demand and supply fundamentals cannot
explain all of the price run-up. Other factors such as surging coal and steel prices,
continued RMB depreciation, and optimism over President-elect Trump’s
infrastructure spending plan have also played a role. At $73/t, we think iron ore has
overshot its fair value implied by the supply and demand balance. For 2017, we see
the demand picture as supportive. Although there are downside risks in the Chinese
property market, steel demand should remain solid given the strong growth in
infrastructure investment. Outside of China, a cyclical recovery in investment globally
could also be supportive. However, we expect iron ore prices to fall over the next
several quarters for two reasons. First, a correction of the overvaluation mentioned
earlier should result in iron ore prices reverting towards marginal cost in the near
term. Second, as we look beyond 2017, a widening gap between stable to declining
demand and increasing mining capacity should drive inventories towards a historical
high and eventually force prices below marginal cost. At the same time, we expect
this downward trend to be anything but smooth, partly because a forward curve in
backwardation and a linkage to the USD has attracted speculative investors, and high
price volatility is likely to persist in 2017.
Metallurgical Coal – 12m target US$165/t FOB Australia
The steel sector has not been as fortunate as power utilities regarding its fuel supply.
Inventories remain low along the supply chain, and metallurgical coal production ex-
China is unlikely to fully offset the shortfall in the domestic market, partly because of a
lack of investment in the past five years and the risks associated with the financing of
mine restarts in a market with significant policy risk. We assume that inventories
continue to decline into the first quarter of 2017 due to the delayed response of
domestic mines and the focus of regulators on thermal coal supply. Healthy demand
and limited spot availability could drive prices for hard coking coal as high as
US$350/t in early 2017 before the eventual increase in Chinese coal production
reverses the significant de-stocking experienced this year. While our 2018 forecast of
US$125/t reflects normalized inventories and price parity with marginal cost in China,
production controls are a blunt policy instrument and the search for price stability in
the Chinese market may require successive tightening and loosening phases, causing
prices to over/undershoot repeatedly relative to the equilibrium price.

Thermal Coal – 12m forecast US$60/t FOB Newcastle
The market seems to have reached an inflection point: the global economy is not
short of mining capacity and the current windfall for producers was bound to be
short-lived. Chinese regulators have rolled back production limits in order to ensure
winter power and heating supply, and they have also provided clear guidance about
their price targets for 2017 via annual contracts signed recently by state-owned
producers at RMB 535/t. As inventories at Chinese power plants recover and a larger
number of domestic mines increase their operating hours, global coal prices have
declined across the curve and we believe that risks to Chinese demand for imported
coal in 2017 are skewed to the downside. Tightness in winter should therefore be
followed by sequentially stronger supply and weaker demand going into the
seasonally weaker second quarter of 2017, particularly given the growing competition
from LNG in both developed and emerging economies. Nonetheless, we believe that
Chinese policy will have a lasting impact on industry profitability because marginal
costs are higher in China than in other coal producing regions. However, policy risks
are significant. Potential measures to prioritize domestic coal at the expense of
imports would be likely to result in a price discount for seaborne coal relative to our
US$60/t estimate of the equilibrium price in an unconstrained market.
Investors should consider this report as only a single factor in making their investment
decision. For Reg AC certification and other important disclosures, see the Disclosure
Appendix, or go to www.gs.com/research/hedge.html
(http://www.gs.com/research/hedge.html).
Jeffrey Currie (/content/research/authors/f50f0e46-c1ae-11d5-8ba1-d5767450fa6b.html)+1 212 [email protected], Sachs & Co.
Damien Courvalin (/content/research/authors/9d1a3402-804b-11db-91b4-001185134607.html)+1 212 [email protected], Sachs & Co.
Michael Hinds (/content/research/authors/ea262e0a-b044-4ad5-8c29-ef70cdd73c3f.html)+1 212 357-7528

+1 212 [email protected], Sachs & Co.
Max Layton (/content/research/authors/3da678f2-0e7e-11e1-a4e6-00215acdb578.html)+44 20 [email protected] Sachs International
Christian Lelong (/content/research/authors/b487e668-41be-11e1-b4f9-00215acdb578.html)+1 212 [email protected], Sachs & Co.
Abhisek Banerjee (/content/research/authors/df20af82-d62a-4c68-a2ce-65e2cdb833b1.html)+44 20 [email protected] Sachs International
Hui Shan (/content/research/authors/5cc0436e-2740-11e1-8489-00215acdb578.html)+1 212 [email protected], Sachs & Co.
Yubin Fu (/content/research/authors/0a793db5-cfcd-42b8-8f0b-86c77b68902c.html)+44 20 [email protected] Sachs International
Amber Cai (/content/research/authors/e29f0d44-06c1-46da-8163-dd25a952930b.html)+852 [email protected] Sachs (Asia) L.L.C.
Chris Mischaikow (/content/research/authors/66db0b2c-6fab-4264-9ccf-8a5870914b8e.html)+1 212 [email protected], Sachs & Co.
Mikhail Sprogis (/content/research/authors/4b8fb3ca-789b-4f75-a8c7-96dde4b4b326.html)+44 20 [email protected] Sachs International
Huan Wei (/content/research/authors/c7efca6b-02e0-4409-8289-280b0d652039.html)+1 212 [email protected], Sachs & Co.
Callum Bruce (/content/research/authors/68097359-7334-493b-a4cb-d143ddad581e.html)+44 20 [email protected]