Embed Size (px)
Citation preview

What is New Hampshire? An overview of issues shaping the Granite State’s future
September 2015
If you found this report useful, consider supporting the Center today.
Any contribution works to help keep these reports coming! The Center’s continued independent and objective voice is only possible because of the
generosity of donors like you.
Authors Stephen Norton Executive Director Dennis Delay Economist Tyler Stoff Intern
About this paper The New Hampshire Center for Public Policy Studies compiled the information and analysis in this report for the use of Leadership New Hampshire, a program intended to introduce rising leaders to the people, strengths, and challenges of the Granite State. The Center is grateful for the opportunity to present this material to the Leadership New Hampshire participants and to all others seeking an overview of information about the state. The Center has produced this report with funds donated by individuals, foundations, and businesses from across New Hampshire. The Center’s supporters do not necessarily endorse, nor has the Center asked them to endorse, any of the materials included in this report. The Center, not Leadership New Hampshire, determined what to include in this report. This paper, like all of our published work, is in the public domain and may be reproduced without permission. Indeed, the Center welcomes individuals’ and groups’ efforts to expand the paper’s circulation. Copies are available at no charge on the Center’s web site: www.nhpolicy.org. Many of the pages that follow are excerpts from other Center reports, all of which are available at the same site. We have also prepared a selection of interactive maps and data sets that display much of the information detailed in this report. Those can be found on our website as well. Contact the Center at [email protected]; or call 603-226-2500. Write to: NHCPPS, 1 Eagle Square, Suite 510, Concord, NH 03301

WHAT IS NEW HAMPSHIRE?
2015 Edition
Table of Contents
INTRODUCTION: WHAT IS NEW HAMPSHIRE? .............................................................................................. 1
DEMOGRAPHIC CHANGE IN NEW HAMPSHIRE ............................................................................................ 2
NEW HAMPSHIRE’S ECONOMY .......................................................................................................................... 7
EDUCATION IN NEW HAMPSHIRE ................................................................................................................... 19
HEALTH CARE IN NEW HAMPSHIRE .............................................................................................................. 32
NEW HAMPSHIRE’S STATE BUDGET ............................................................................................................... 38
NEW HAMPSHIRE’S INFRASTRUCTURE ........................................................................................................ 48
ENERGY IN NEW HAMPSHIRE ........................................................................................................................... 56
CRIME AND CORRECTIONS IN NEW HAMPSHIRE ...................................................................................... 62
NEW HAMPSHIRE’S REGIONS ........................................................................................................................... 68
LIST OF TABLES Table 1: New Hampshire Employment and Wages by County Type, 2010 to 2013 .................... 11 Table 2: New Hampshire Economic Dashboard 2013 .................................................................. 16 Table 3: Administrative Costs for New Hampshire Districts by Enrollment ............................... 29 Table 4: Total state spending, 2001 and 2015 .............................................................................. 42 Table 5: General Fund Spending, 2001 and 2015 ......................................................................... 42 Table 6: 2023 New Hampshire Tax Revenue by Type ................................................................. 46 Table 7: Alternative - Deficit Assuming Historical Growth ......................................................... 47 Table 8: Infrastructure state indicators ......................................................................................... 49 Table 9: Estimated investment needs of water systems in selected states, including New Hampshire, over the next two decades. ........................................................................................ 53
LIST OF FIGURES Figure 1: Ten Year Percent Change in New Hampshire Population by Decade End ..................... 3 Figure 2: Net Migration in New Hampshire ................................................................................... 4 Figure 3: New Hampshire Population Age 65 and Over ................................................................ 4 Figure 4: Children in Poverty Growing ......................................................................................... 5 Figure 5: Average Annual Growth in Employment, 1970 to 2014 ................................................. 7 Figure 6: Change in New Hampshire Jobs from 2011 to 2013 by Average Wage ......................... 8 Figure 7: National, Regional, and State Unemployment Rates, 2005-2015 ................................... 8 Figure 8: United States and New Hampshire Real GDP Growth by Decade ................................. 9 Figure 9: Percent Change in Real GDP in BEA Regions ............................................................. 10 Figure 10: Percent Change of Labor Force in Regional Labor Market Areas, 2010 to 2014 ....... 10 Figure 11: Change in Employment by County Type, 2010 to 2013 ............................................. 11 Figure 12: Percent Change of Labor Force in National, Regional, and State Labor Markets, 2010 to 2014 .......................................................................................................................................... 12 Figure 13: New Hampshire Total Compensation Paid by Selected Industries (Thousands of Dollars) ......................................................................................................................................... 13 Figure 14: Projections of a Declining Workforce, Growth by Age Cohort .................................. 14 Figure 15: Regional Price Parities by State, 2013 (US = 100) ..................................................... 17 Figure 16: Percent of Students Scoring Proficient or Higher on State Reading Tests ................. 20 Figure 17: Third Grade Reading Scores by School District, 2013 ............................................... 20 Figure 18: Percent of High School Graduates Entering Post-Secondary Education, Class of 2014....................................................................................................................................................... 21 Figure 19: New Hampshire School District Revenue by Category, 2013-14 ............................... 21 Figure 20: Per-Pupil Education Spending by State, 2013-14 ....................................................... 22 Figure 21: State Support for Higher Education by System, FY2005 to FY2015 ......................... 23 Figure 22: State Support for Higher Education per $1,000 in Personal Income, FY2015 ........... 24 Figure 23: Average In-State Tuition and Fees at Public Four-Year Institutions by State, 2014-2015............................................................................................................................................... 24 Figure 24: Average Undergraduate Debt Load for In-State Students by Institution, 2007-2012 . 25 Figure 25: Three-Year Official Cohort Default Rates for New Hampshire Institutions .............. 26 Figure 26: New Hampshire Public Grade School Enrollment ...................................................... 27 Figure 27: Percent of Population Employed in Science and Engineering Fields, 2010 ............... 30 Figure 28: Growth in Medicaid Enrollment Associated with the Health Protection Act ............. 33

Figure 29: Share of New Hampshire GDP: Energy, Health Care, and the State Budget ........... 34 Figure 30: Annual Growth in Health Insurance Premiums .......................................................... 35 Figure 31: Average Family Health Insurance as a ........................................................................ 35 Figure 32: Per Capital Public Spending in 2013 .......................................................................... 38 Figure 33: Per Capita Spending in NH ........................................................................................ 39 Figure 34: Total Appropriations by Fund Source, FY2014-15 ..................................................... 40 Figure 35: General Fund Expenditures (Million USD), FY1990 to FY2015 ............................... 41 Figure 36: General Fund Revenues by Major Component 1988 Through 2013 .......................... 43 Figure 37: FY2013 General Fund Revenue Sources .................................................................... 44 Figure 38: General Fund Revenue as a Percentage of Gross State Product ................................. 44 Figure 39: State Appropriations by Category, 2014-15 (all fund sources) ................................... 45 Figure 40: State Spending by Category, 1982 (all fund sources) ................................................. 46 Figure 41: Per Pupil Primary and Secondary School Infrastructure Outlay for FY2013 ............. 50 Figure 42: Percent of Population without Household Broadband Internet Access by Region, 2010....................................................................................................................................................... 51 Figure 43: Percent of Population with Broadband Household Internet Access by County, 2015 51 Figure 44: Total Water Use Per Capita in Gallons/Day by State, 2010 ....................................... 52 Figure 45: Percent of Deficient Bridges by State, 2014 ............................................................... 54 Figure 46: Percent of Roads in Poor or Mediocre Condition, 2013 ............................................. 55 Figure 47: New Hampshire's Energy Use by Sector, 2013 ........................................................... 56 Figure 48: New Hampshire's Energy Consumption by Fuel Type, 1960 to 2013 (Millions of BTU) ............................................................................................................................................. 57 Figure 49: Energy Indicators ........................................................................................................ 58 Figure 50: Energy Indicator Rankings .......................................................................................... 59 Figure 51: Crime Rates per Hundred Thousand People by State, 2013 ....................................... 62 Figure 52: All Crime Rate, Crimes per 100,000 People, FBI Uniform Crime Reports ................ 63 Figure 53: New Hampshire Offenses Known to Law Enforcement ............................................. 64 Figure 54: New Hampshire State Prison Population by Major Offense ....................................... 65 Figure 55: New Hampshire State Prison Inmate Population under Justice Reinvestment ........... 66 Figure 56: NH's Regions .............................................................................................................. 68 Figure 57: People per Square Mile, 2010 ..................................................................................... 69 Figure 58: Property Value per Acre, 2013 .................................................................................... 70 Figure 59: Percent of Persons in Poverty, 2008-2012 .................................................................. 71 Figure 60: Percent of Adult Population with a Bachelor's Degree or Higher, 2008-2012 ........... 72

What is New Hampshire? 2015 Edition 1
Introduction: What is New Hampshire? Throughout its history, New Hampshire has worn many identities: agricultural outpost on the edge of New England; bustling engine of the Industrial Revolution; oasis for nature-seeking tourists; haven for tax-fleeing transplants. In the early years of the 21st Century, New Hampshire is still evolving amid shifting economic, demographic, social and political forces. Among the trends shaping the “new” New Hampshire: an aging population; increasing racial and ethnic diversity; a shift away from the high-growth economic model of the past; and continued demand on the state budget for public services. While the implications of these and other changes are still unclear, they do raise critical policy questions, including:
Economy: New Hampshire suffered the effects of the Great Recession less severely than many other states, but slow job growth continues to gnaw at the state’s economy. As of the summer of 2014, New Hampshire lagged behind the nation and the rest of New England in recovering jobs lost during the recession. What is the state’s economic development plan, especially in relation to demographic trends that show New Hampshire’s working age population actually declining in coming years? What specific industries or regions of New Hampshire will help shape the state’s economy in coming years? What regional approaches to economic development will find greatest success?
Demographic change: While New Hampshire is consistently rated one of the best places
in the country to raise children, our population as a whole continues to age. Meanwhile, our school enrollment continues on a decade-long decline, and several measures of youth well-being in the state show worrisome trends, including rising levels of childhood poverty. What are the implications of these developments on education policy, housing, public services and transportation?
Health care: New Hampshire’s health policy landscape faces great uncertainty amid
recent reforms at the national level, as well as continued rises in cost and the continued aging of the state’s population. What impact will the shifting health marketplace have on New Hampshire’s economy and the well-being of its residents?
Long-term planning: State policymakers face a long list of critical issues in coming
years: public infrastructure investment, education finance, corrections spending, health care, and energy policy, among others. Many of these require a long-term perspective and an understanding of multi-year trends. How will the state – which has a two-year budget cycle and a two-year term for all major state offices – manage to plan decades into the future?
This report is our annual survey of the major policy issues and critical questions shaping our future. The data explain where New Hampshire has been, forecast where it is heading, and explore how current trends and policy choices facing the state will affect the well-being of its citizens.
What is New Hampshire? 2015 Edition 2
Demographic change in New Hampshire New Hampshire had been the fastest growing state in the Northeast for years, fueled by high rates of domestic in-migration, largely from Massachusetts. With the arrival of these newcomers, the average educational attainment and income levels in New Hampshire increased over that period. Those trends, in turn, helped fuel the state’s strong economic growth of recent decades. But these migration patterns have changed over the course of the Great Recession, a fact that will have real implications for New Hampshire’s future. As we will see below, migration into New Hampshire has slowed considerably over the past decade, and the state is not expected to return to the past pattern of high growth for the foreseeable future.
New Hampshire’s people: By the numbers1 Compared to the rest of the country, New Hampshire’s population is older, less racially diverse, better educated, wealthier, and more likely to have moved here from another state.
Average age: o New Hampshire: 41.5 years o United States: 37.3 years
Percent of the population that is white: o New Hampshire: 96 percent o United States: 76 percent
Percent of the population with a high school diploma or higher: o New Hampshire: 91 percent o United States: 86 percent
Percent of housing units that are owner-occupied: o New Hampshire: 72 percent o United States: 65 percent
Median household income: o New Hampshire: $64,900 o United States: $53,000
Poverty rate: o New Hampshire: 8.4 percent o United States: 14.9 percent
Percent of state residents born in another state: o New Hampshire: 51 percent o United States: 27 percent
New Hampshire’s high growth years are in the past Through the 1970s, 1980s and 1990s, New Hampshire saw high rates of population growth, with three consecutive decades of growth of 20 percent or more. That pace of growth came in the middle of a period of economic expansion and rising wages.
1 Source: 2010 Census of Population and the American Community Survey 2009-2013
What is New Hampshire? 2015 Edition 3
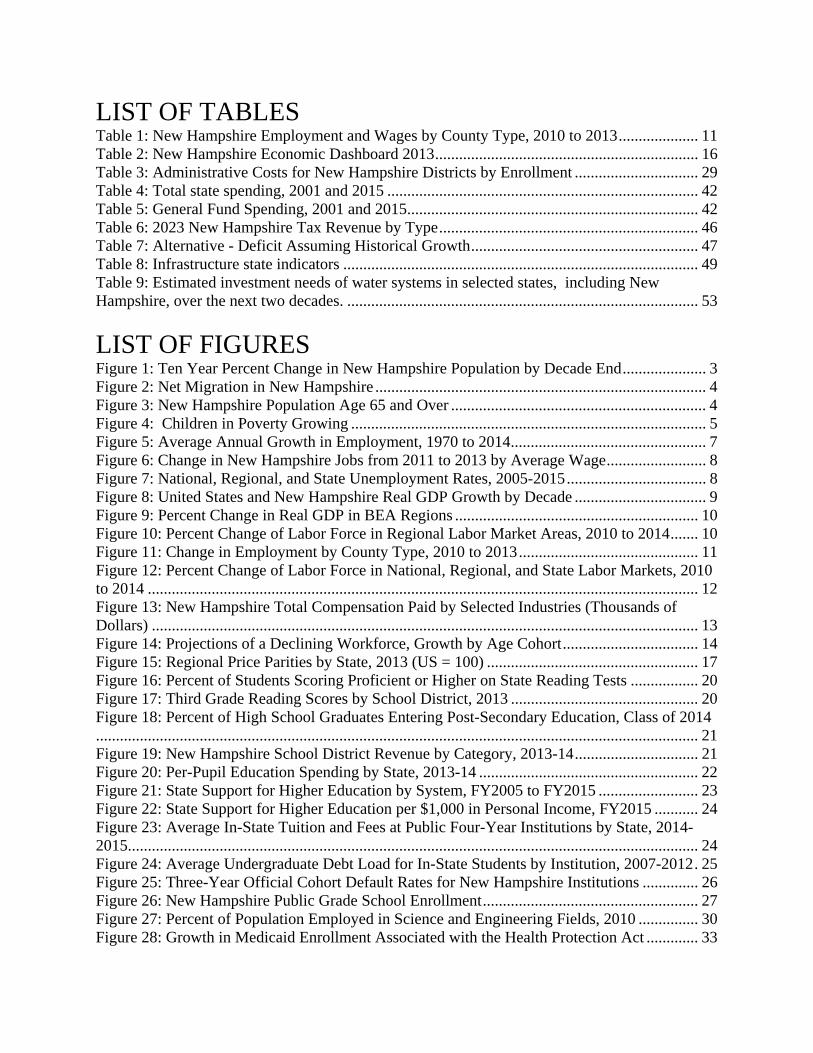
Since then, the state’s population growth rates have fallen steadily. For the decade between 2000 and 2010, New Hampshire’s growth rate fell to 6.5 percent, still the highest rate in the Northeast but the state’s slowest decade of growth since before World War II. The national percent change in population from 2000 to 2010 was 9.7 percent. What is the source of this decline? Put simply, fewer people have been moving into the state in recent years, and New Hampshire has even seen net out-migration in several of the past few years. Domestic migration has remained about the same from 2009 to 2011, with annual losses of roughly 2,000 people per year.
Figure 1: Ten Year Percent Change in New Hampshire Population by Decade End
For the forecast years beyond 2010, New Hampshire population growth rates are expected to continue to decline – with 3.3 percent growth from 2010 to 2020 and 3.8 percent growth from 2020 to 2030 according to the New Hampshire Office of Energy and Planning’s 2012 population projections.2 Growth in the decade beyond that (2030 to 2040) is forecast to be essentially flat, at just over 1 percent for the period.
From Massachusetts to Florida: New Hampshire Migration At the end of July, 2015 the IRS released new data for the 2012 Filing Year, which show migration based on address changes for tax filers from the tax year 2011 filings to tax year 2012
2 Population data are from the Census Bureau’s annual census and from the Office of Energy and Planning’s 2012 population projections unless otherwise noted. Those projections can be found here: https://www.nh.gov/oep/data-center/documents/2013-projections-state-counties.pdf
8.5%
13.8%
21.5%
24.8%
20.5%
11.4%
6.5%
3.3% 3.8%
1.1%
1950 1960 1970 1980 1990 2000 2010 2020 2030 2040
ActualForecast
What is New Hampshire? 2015 Edition 4
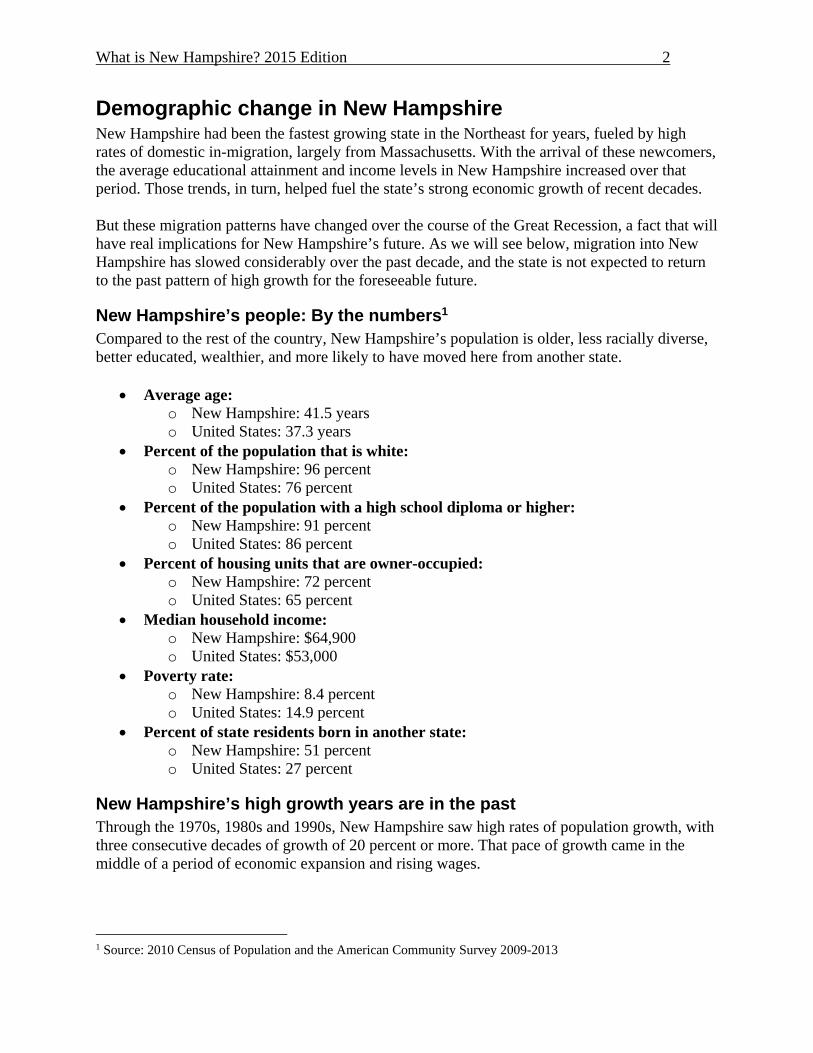
filings. With this release the IRS is also reporting aggregate migration flows at the state level, by the size of adjusted gross income (AGI) and age of the primary taxpayer. As shown in the following chart, after five successive years of New Hampshire experiencing net out migration, the 2011 to 2012 data shows that New Hampshire migration has turned positive again, but not by much. According to the IRS data NH gained a net 83 people (based on number of claimed exemptions) from the 2011 Filing Year to the 2012 Filing Year. A look at state to state net migration flows shows that over the period 2001 to 2012 New Hampshire had a net gain of almost 70,000 former Massachusetts residents. However the migration from Massachusetts slowed considerably over the time period, from over 10,000 per year in the early part of the last decade, to about 1,500 a year more recently. New Hampshire also gained residents from Connecticut, New York, New Jersey and Rhode Island from 2001 through 2012. The State of Florida had the largest increase from net New Hampshire outmigration, gaining over 23,000 former New Hampshire residents from 2001 to 2012. Former New Hampshire residents also moved to Maine, North Carolina, South Carolina and Texas.
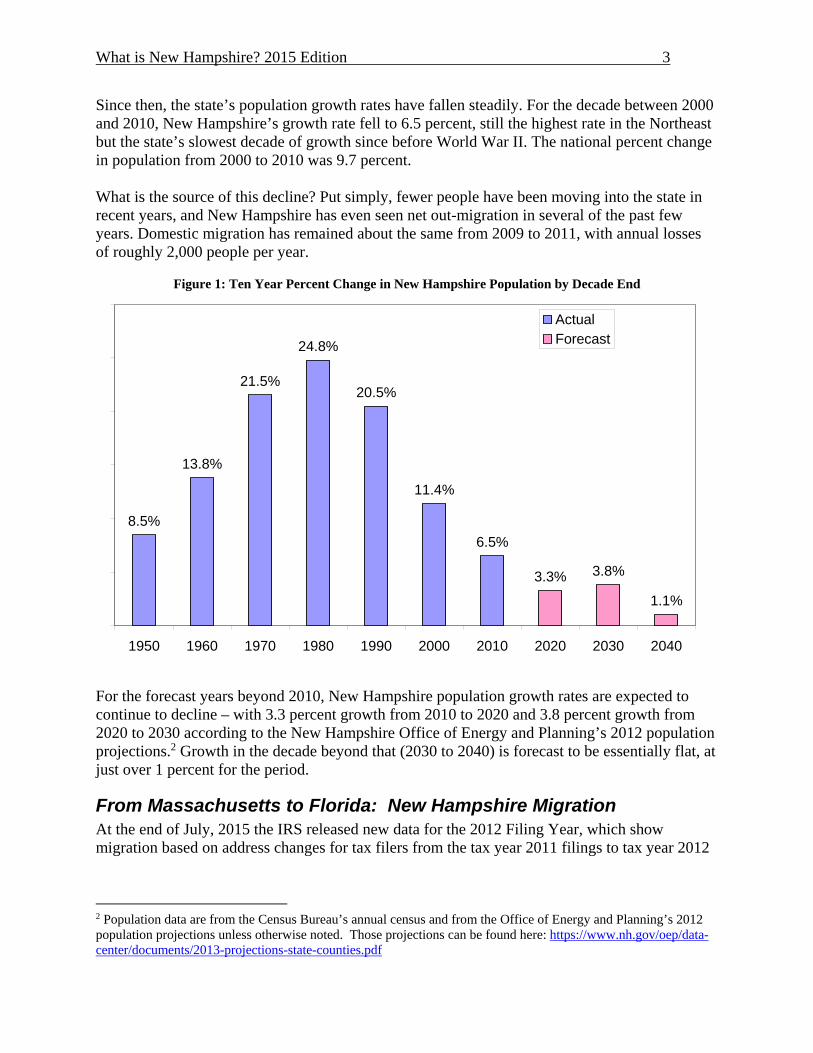
New Hampshire will grow older with fewer young people Population projections for New Hampshire shown in Figure 3 show that the year 2020 will see the beginning of a shift in New Hampshire’s population towards the over-65 population. By then, residents 65 years and older will account for nearly 20 percent of the state population, up from 13.5 percent in 2010. This will be due in large part to the aging of the “Baby Boom” generation – generally speaking, those people born between 1946 and 1964. The growth rate from 2030 to 2040 in the above-65 population (9.7 percent) is predicted to be the lowest growth rate since the decade preceding 1920. The likely causes of this lower growth are the last of
0
50,000
100,000
150,000
200,000
250,000
300,000
350,000
400,000
450,000
500,000
1900 1910 1920 1930 1940 1950 1960 1970 1980 1990 2000 2010 2020 2030 2040
0%
10%
20%
30%
40%
50%
60%
70%
80%
90%
100%
65+ Pop 65+ Pop as a % of Total Pop
Figure 3: New Hampshire Population Age 65 and Over
10,681
7,851
5,852
3,1872,646
2,236
-298 -884
-2,320 -2,329 -1,926
83
-4,000
-2,000
0
2,000
4,000
6,000
8,000
10,000
12,000
00-01 01-02 02-03 03-04 04-05 05-06 06-07 07-08 08-09 09-10 10-11 11-12
To
tal E
xem
pti
on
s
Total Net Migration Of NH (State to State and Foreign)
Figure 2: Net Migration in New Hampshire

What is New Hampshire? 2015 Edition 5
the “Baby Boomer” generation having entered into the 65+ cohort during the preceding decade and the already significant amount of people age 65 and over.
Looking ahead
Measures of child well-being show troublesome trends Child poverty in New Hampshire has been growing over the past decade, and at a rate faster than the nation as a whole. According to data from the U.S. Census’s annual American Community Survey, the New Hampshire child poverty rate in 2013 was almost 11 percent, up from approximately 8% in 2003. This suggests that the child poverty rate is growing more quickly in New Hampshire. Other measures of childhood poverty, including the share of New Hampshire students eligible for free or reduced school lunches, also show steady increases in recent years. This trend is troubling for obvious reasons. Research indicates that growing up in poverty can impede a child’s cognitive development, and children from low-income households typically fare worse on measures of academic success, such as test scores and high school graduation rates.
An aging population will reshape the state’s healthcare system The aging of the population in New Hampshire will put pressure on virtually every dimension of the state’s health care system. If we assume that the elderly population in New Hampshire eligible for the state’s Medicaid program in 2020 will use services at the same rate as the elderly do today, the number of individuals participating in the program will increase rapidly, increasing slightly more than 30 percent over the next 10 years. These trends will put pressure on the state to rethink how it finances long term care services, including institutional and home and community-based services. Additional resources from the Center on aging in New Hampshire can be found here:
“New Hampshire's Silver Tsunami: Aging and the Healthcare System,” NHCPPS, Sept.
2011. http://www.nhpolicy.org/UploadedFiles/Reports/aging_and_the_healthcare_system_final.pdf “Aging and the Public Long Term Care System,” NHCPPS, Sept. 2012.
http://www.nhpolicy.org/UploadedFiles/Reports/Aging_and_the_LTC_Systemv5test.pdf
7.8
10.9
0.0
2.0
4.0
6.0
8.0
10.0
12.0
14.0
16.0
2003 2004 2005 2006 2007 2008 2009 2010 2011 2012 2013
New Hampshire - Poverty RateThose Under 18
Figure 4: Children in Poverty Growing
What is New Hampshire? 2015 Edition 6
New Hampshire’s housing stock is not well matched to demographic change and NH’s future needs3 In the decades before the Great Recession, New Hampshire’s housing market was a major driver of the state’s expanding economy. But with recent shifts in the state’s demographic and economic trends, New Hampshire’s current housing infrastructure could end up becoming a drag on future economic growth and stability. The reasons are multiple: an aging population, shifts in housing preferences among younger generations, a misalignment between housing supply and future demand, and changes in traditional financing paths for homeownership. In the 1970s, 1980s, and 1990s, housing demand was driven by Baby Boomers moving to New Hampshire. But as we have seen in many policy areas, much of New Hampshire’s housing industry (builders, planners, public officials, etc.) has yet to fully transition away from the mindset of the past, in which consistent rates of high population growth was the norm. Instead, they need to prepare for a housing model defined by less growth overall, more senior households, fewer young households, financially strained first-time buyers, and changing lending standards. Public policy initiatives can do more than respond to such demographic changes: They can help shape them. Local zoning ordinances that seek to limit the number of new housing units, increase mandatory lot sizes, or dictate the type of units that can be built, for example, may drive up the cost of housing. Higher housing prices, in turn, can create difficulties for new arrivals and current residents seeking affordable homes, which may deter young people and working families from moving to the state. Additional resources from the Center on housing and demographic change in New Hampshire can be found here: “Big Houses, Small Households” NHCPPS, March 2014.
http://www.nhpolicy.org/report/housing-in-nh-pt-1-big-houses-small-households “Housing in New Hampshire: Senior Perspectives,” NHCPPS, March 2014.
http://www.nhpolicy.org/report/housing-in-nh-pt-2-senior-perspectives “Housing in New Hampshire: The Evolving Environment,” NHCPPS, March 2014.
http://www.nhpolicy.org/report/housing-in-nh-pt-3-the-evolving-environment
3 Excerpted from “Big Houses, Small Households” NHCPPS, March 2014. http://www.nhpolicy.org/report/housing-in-nh-pt-1-big-houses-small-households\

What is New Hampshire? 2015 Edition 7
New Hampshire’s Economy
The state’s economic model is changing significantly By many measures, New Hampshire’s economy rests on strong foundations. With high levels of educational attainment, a competitive tax structure, relatively low poverty rates, proximity to the Greater Boston economic market, and an overall high quality of life, the state has many enviable assets that boosted economic growth and prosperity over the past several decades. But New Hampshire faces considerable disadvantages in other areas, especially when compared to areas of the country that are seeing more robust economic growth. These challenges go beyond the economic disruption caused by the Great Recession. Recent developments such as declining rates of in-migration and an aging workforce are upending the model that defined the state’s economy since the 1980s – consistent population growth, increased productivity, and a more resilient economy than our competitors. The shift away from long-held assumptions of consistent growth will reshape the state’s policies on job creation, tax policy, land use, social services, and other areas.
Job growth has slowed New Hampshire’s job growth has declined considerably over the past decade. For instance, while the number of jobs in the state increased annually on average by 4.1 percent during the 1970s, the state actually saw small annual decreases in jobs from 2000 to 2010. That decrease was less than for New England and the nation as a whole (0.3 percent and 0.1 percent, respectively, in average annual job loss). However, over the past three years, New Hampshire has been regaining lost jobs at a slower pace than both the New England region and
the nation. Since 2010, annual job growth has
averaged just under 1 percent in New Hampshire, compared to 1.6 percent nationally and 1.2 for all of New England. The period since 2010 is the first in more than 40 years in which annual job growth in New Hampshire lagged behind the national and Economic Research Division regional rates. The United States and
The years since 2010 are the first period in more than 40 years in which annual job growth in New Hampshire has lagged behind the national and regional rates.
2.5%
1.9% 1.9%
-0.1%
1.6%1.9%
1.5%
1.0%
-0.3%
1.2%
4.1%
2.8%
2.0%
0.0%
0.9%
-1.0%
-0.5%
0.0%
0.5%
1.0%
1.5%
2.0%
2.5%
3.0%
3.5%
4.0%
4.5%
1970-80 1980-90 1990-00 2000-10 2010-14
United States New England New Hampshire
Figure 5: Average Annual Growth in Employment, 1970 to 2014

What is New Hampshire? 2015 Edition 8
New England have recovered all of the jobs lost in the recession, while New Hampshire still lags in returning to pre-recession job levels. Most of the recent growth in employment, especially in the service sector, has been in industries that do not require highly skilled workers. Accommodation and food services industries added the most jobs from 2011 to 2013, and most of the positions in this industry require a high school diploma or less for employment. Low skill industries tend to pay wages that are below average. The quality of the jobs created has been mediocre, because two thirds of the jobs created pay below average wages.
Figure 6: Change in New Hampshire Jobs from 2011 to 2013 by Average Wage
Source: Quarterly Census of Wages and Employment
Over 7,000 of the jobs created in New Hampshire from 2011 to 2013 were below the average wage of jobs in the state, with only 5,803 jobs created at an above average wage.
Figure 7: National, Regional, and State Unemployment Rates, 2005-2015
Source: U.S. Bureau of Labor Statistics
5,803
7,089
0
1,000
2,000
3,000
4,000
5,000
6,000
7,000
8,000
Above Average Wage Below Average Wage
0%1%2%3%4%5%6%7%8%9%
10%11%
Apr
il 20
05
Aug
ust 2
005
Dec
emb
er 2
005
Apr
il 20
06
Aug
ust 2
006
Dec
emb
er 2
006
Apr
il 20
07
Aug
ust 2
007
Dec
emb
er 2
007
Apr
il 20
08
Aug
ust 2
008
Dec
emb
er 2
008
Apr
il 20
09
Aug
ust 2
009
Dec
emb
er 2
009
Apr
il 20
10
Aug
ust 2
010
Dec
emb
er 2
010
Apr
il 20
11
Aug
ust 2
011
Dec
emb
er 2
011
Apr
il 20
12
Aug
ust 2
012
Dec
emb
er 2
012
Apr
il 20
13
Aug
ust 2
013
Dec
emb
er 2
013
Apr
il 20
14
Aug
ust 2
014
Dec
emb
er 2
014
Apr
il 20
15
United States New England New Hampshire
What is New Hampshire? 2015 Edition 9
Despite job growth lagging behind national and regional rates, New Hampshire continues to enjoy a lower unemployment rate than the nation or New England as a whole. The past ten years have seen fluctuations largely in line with national and regional trends, but with a narrowing over-performance compared to the rest of the nation.
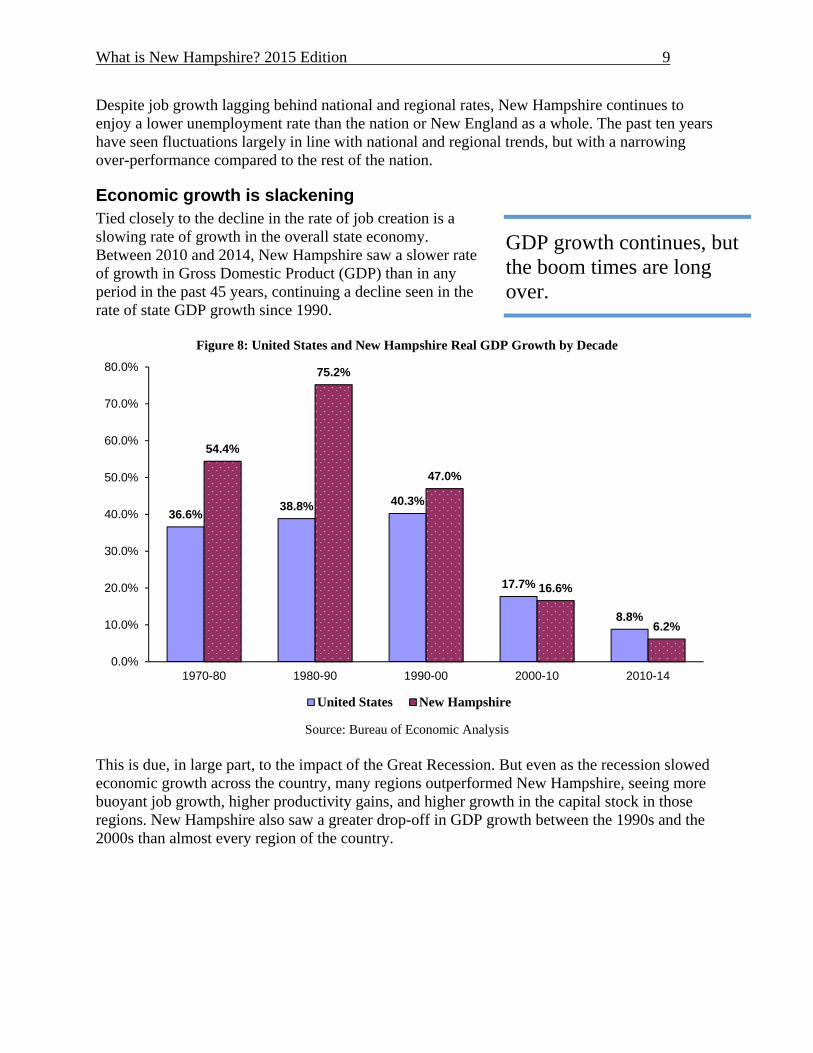
Economic growth is slackening Tied closely to the decline in the rate of job creation is a slowing rate of growth in the overall state economy. Between 2010 and 2014, New Hampshire saw a slower rate of growth in Gross Domestic Product (GDP) than in any period in the past 45 years, continuing a decline seen in the rate of state GDP growth since 1990.
Figure 8: United States and New Hampshire Real GDP Growth by Decade
Source: Bureau of Economic Analysis
This is due, in large part, to the impact of the Great Recession. But even as the recession slowed economic growth across the country, many regions outperformed New Hampshire, seeing more buoyant job growth, higher productivity gains, and higher growth in the capital stock in those regions. New Hampshire also saw a greater drop-off in GDP growth between the 1990s and the 2000s than almost every region of the country.
36.6%38.8% 40.3%
17.7%
8.8%
54.4%
75.2%
47.0%
16.6%
6.2%
0.0%
10.0%
20.0%
30.0%
40.0%
50.0%
60.0%
70.0%
80.0%
1970-80 1980-90 1990-00 2000-10 2010-14
United States New Hampshire
GDP growth continues, but the boom times are long over.

What is New Hampshire? 2015 Edition 10
Figure 9: Percent Change in Real GDP in BEA Regions4
Source: Bureau of Economic Analysis
Some New Hampshire metropolitan areas growing faster than others Employment growth in New Hampshire’s labor market areas is varied, though not quite as varied as a sampling of similarly-sized regions across New England. Though much is said about economic growth in Portsmouth on the seacoast, Manchester continues to have the fastest-growing employment among New Hampshire’s largest labor market areas, with 6.9% growth over the past four years versus Portsmouth’s 5.0% growth. This represents an increase of 7,800 jobs for Manchester from 2010 to 2014 and 4,300 jobs for Portsmouth. Nashua’s employment levels have grown by 3.8% in the same period. The state-leading growth in Manchester is driven primarily by increases in professional, education, and health services. Portsmouth’s growth, by contrast, has come from the manufacturing, finance, and
4 Source: U.S. Department of Commerce, Bureau of Economic Analysis
47.0%
33.0%30.0%
40.2% 41.1%
48.5%
62.4%
73.5%
39.5% 40.3%
16.6%13.0%
15.9%
3.1%
16.5% 16.8%
25.6%22.9%
19.7%17.7%
6.2% 4.8% 5.7% 6.6% 7.3%4.9%
18.0%
8.8% 8.4% 8.8%
0.0%
10.0%
20.0%
30.0%
40.0%
50.0%
60.0%
70.0%
80.0%
1990 to 2000 2000 to 2010 2010 to 2014
0.5%
2.0%
3.1%3.3%3.7%3.8%
4.7%4.8%5.0%
6.9%6.9%7.2%7.3%7.7%
0.0%1.0%2.0%3.0%4.0%5.0%6.0%7.0%8.0%9.0%
Figure 10: Percent Change of Labor Force in Regional Labor Market Areas, 2010 to 2014

What is New Hampshire? 2015 Edition 11
insurance industries. Manchester’s increases in educational and health employment may be a less visible growth in contrast to Portsmouth’s booming manufacturing trade. While New Hampshire’s metropolitan areas have seen employment growth across the board, it is necessary to note large declines in the numbers of federal, state, and local government employees statewide. Additionally, Nashua in particular has seen a large decline in its manufacturing sector, depressing that city’s economic recovery. The following table compares employment and wages for 2010 and 2013 in New Hampshire with a summary for metro counties and non-metro counties. Metro counties in New Hampshire are Hillsborough, Rockingham and Strafford, while the remaining seven counties are considered non-metro counties.5
Table 1: New Hampshire Employment and Wages by County Type, 2010 to 2013
2010 2010 2010 2013 2013 2013
Total, Private plus Government Units
Average Annual
Employment
Average Weekly Wage Units
Average Annual
Employment
Average Weekly Wage
Change in Employment, 2010 to 2013
Percent Change
Jobs
Percent Change Wages
Metro Counties 23,478 360,664 $920.73 23,777 373,452 $977.46 12,788 3.5% 6.2%
Non-Metro Counties
15,507 225,326 $779.77 15,385 229,382 $826.55 4,056 1.8% 6.0%
State 38,985 585,990 $866.53 39,162 602,834 $920.04 16,844 2.9% 6.2%
Source: Quarterly Census of Employment and Wages As can be seen in the above table, the metro counties in New Hampshire not only contain the majority of the jobs in the state, but employment growth has been faster in the metro counties than in the non-metro counties.
Figure 11: Change in Employment by County Type, 2010 to 2013
Source: Quarterly Census of Employment and Wages
5 Metro, non-metro and rural definition from the United States Department of Agriculture, Economic Research Service.
3.5%
1.8%
2.9%
0.0%
0.5%
1.0%
1.5%
2.0%
2.5%
3.0%
3.5%
4.0%
Metro Counties Non-Metro Counties State

What is New Hampshire? 2015 Edition 12
When examining New Hampshire’s employment growth since 2010 in comparison to New England and the nation as a whole, it is clear that the economic recovery has been somewhat weaker in the Granite State than the region or the country with 3.7% statewide employment growth compared to 4.7% and 6.7% for New England and the United States respectively. This does not mean that New Hampshire is in a worse off state economically than the region or the nation. Rather, New Hampshire entered the recession from a place of much greater economic strength and lower unemployment, so lower job growth is to be expected with fewer people out of work and looking for jobs to begin with.
Figure 12: Percent Change of Labor Force in National, Regional, and State Labor Markets, 2010 to 2014
Source: U.S. Bureau of Labor Statistics, Federal Reserve Bank of St. Louis
Though New Hampshire’s economic growth no longer evokes memories of the boom times decades past, its post-recession recovery continues its respectability both within New England and the nation. Furthermore, cities like Manchester and Portsmouth are witnessing growth that outstrips both the New Hampshire and New England averages and circles the national employment growth average. New Hampshire added over 20,000 jobs in the past four years, with nearly half of that growth coming from the Manchester labor market area alone. As they push the state forward, New Hampshire’s cities continue to be centers of the state’s economic recovery.
Government and health care join manufacturing as NH’s largest sectors The dominant industry in New Hampshire for many years has been the manufacturing sector. Of particular importance for New Hampshire’s economic activity is the smart manufacturing/high
6.7%
4.7%
3.7%
0.0%
1.0%
2.0%
3.0%
4.0%
5.0%
6.0%
7.0%
8.0%
United States Average New England Average New Hampshire Average
The state’s cities are still hubs of growth, though New Hampshire’s best is just keeping in line with the national recovery.
What is New Hampshire? 2015 Edition 13
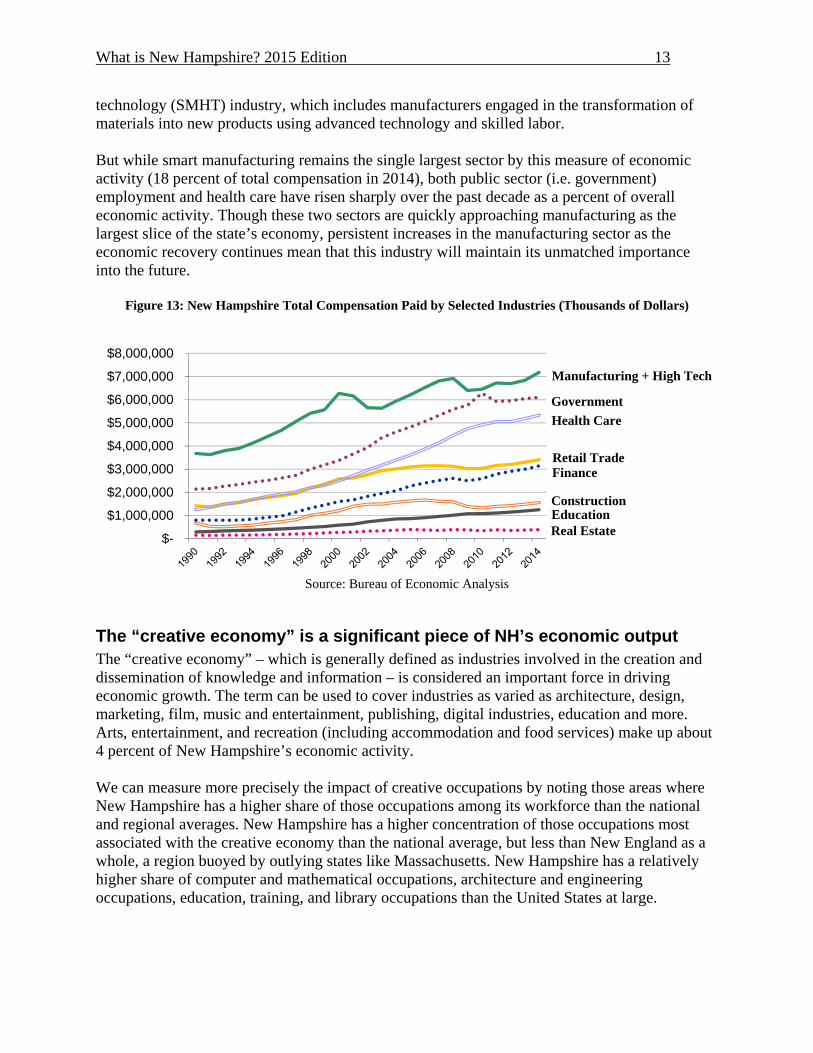
technology (SMHT) industry, which includes manufacturers engaged in the transformation of materials into new products using advanced technology and skilled labor. But while smart manufacturing remains the single largest sector by this measure of economic activity (18 percent of total compensation in 2014), both public sector (i.e. government) employment and health care have risen sharply over the past decade as a percent of overall economic activity. Though these two sectors are quickly approaching manufacturing as the largest slice of the state’s economy, persistent increases in the manufacturing sector as the economic recovery continues mean that this industry will maintain its unmatched importance into the future.
Figure 13: New Hampshire Total Compensation Paid by Selected Industries (Thousands of Dollars)
Source: Bureau of Economic Analysis
The “creative economy” is a significant piece of NH’s economic output The “creative economy” – which is generally defined as industries involved in the creation and dissemination of knowledge and information – is considered an important force in driving economic growth. The term can be used to cover industries as varied as architecture, design, marketing, film, music and entertainment, publishing, digital industries, education and more. Arts, entertainment, and recreation (including accommodation and food services) make up about 4 percent of New Hampshire’s economic activity. We can measure more precisely the impact of creative occupations by noting those areas where New Hampshire has a higher share of those occupations among its workforce than the national and regional averages. New Hampshire has a higher concentration of those occupations most associated with the creative economy than the national average, but less than New England as a whole, a region buoyed by outlying states like Massachusetts. New Hampshire has a relatively higher share of computer and mathematical occupations, architecture and engineering occupations, education, training, and library occupations than the United States at large.
$-
$1,000,000
$2,000,000
$3,000,000
$4,000,000
$5,000,000
$6,000,000
$7,000,000
$8,000,000
Manufacturing + High Tech
Health Care
Retail TradeFinance
ConstructionEducationReal Estate
Government

What is New Hampshire? 2015 Edition 14
By contrast, agriculture and related industries that rely on natural resources make up a relatively small part of the New Hampshire economy. New Hampshire ranks 44th among the states in the portion of economic activity associated with agriculture, forestry, fishing and hunting. Though New Hampshire lags behind New England as a whole in its creative economy, it has become even more creative than the national average over the past decade. Though such a trend may seem like an increase for New Hampshire, here it indicates that the nation has been suffering a stagnation in the relative size of its creative class to a greater extent than the state and region at large. From 2004 to 2014, New Hampshire’s creative class increased from 15% to 16% of the population, a negligible change while the nation saw its creative class remain at 13% of the population.
Attracting the “creative class” With declining rates of in-migration, lower birth rates, and the resultant decline in young residents, New Hampshire must grapple with the challenge of attracting and developing a skilled workforce. The share of the state’s population between the ages of 35 and 44, arguably those in their period of highest productivity, declined by slightly more than 4 percent between 2000 and 2010. Only two states saw a bigger decline over the same period. This ongoing demographic shift must shape how policymakers think about coming workforce needs. As shown below, the traditional workforce cohort (those aged 20 to 64 years) in New Hampshire is projected to decline between 2010 and 2040. These same projections suggest a doubling in the population over 65 over the same time span.
Figure 14: Projections of a Declining Workforce, Growth by Age Cohort
Source: Office of Energy and Planning
0
100,00
200,00
300,00
400,00
500,00
600,00
700,00
800,00
900,00
2010 2015 2020 2025 2030 2035 2040
19 and under
New Hampshire appears strong as it develops a creative economy in a stagnant nation, but underlying problems remain.
20 to 64
65+

What is New Hampshire? 2015 Edition 15
These trends raise important questions for New Hampshire. First, what are the factors that will best attract a workforce to New Hampshire, and what does that mean for public policy? In addition, how can the state take advantage of the human capital associated with the aging of the Baby Boomers and incorporate that in the state’s economic growth?
Looking ahead
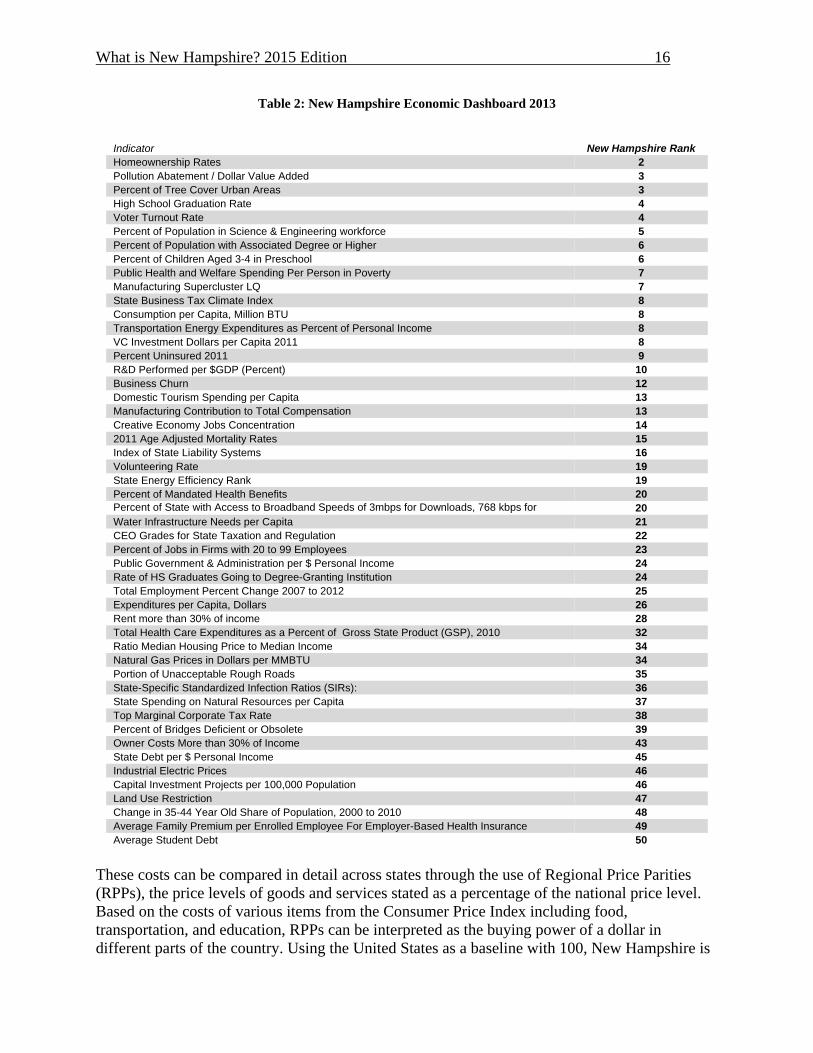
New Hampshire faces challenges in developing a future workforce While many of New Hampshire’s economic indicators reflect the decades-long period of growth and prosperity that began in the 1970s, some measures of future prospects are less promising. This can be seen in an analysis the Center developed to assist the Business and Industry Association of New Hampshire in its development of a strategic economic plan for the state. Each “indicator,” or measure of some aspect of the state’s economy, is placed into a broader category: healthcare, education and workforce, energy, infrastructure, etc.6 The table below ranks these measures according to New Hampshire’s position among the other 49 states, from best to worst. Viewed this way, we can divide many of the indicators into two broad categories: those that point to past or current conditions, and those that relate more to future growth. Many of the indicators where New Hampshire fares well, including high education levels and a robust science and engineering workforce, reflect the impact of past trends or current conditions. On the other hand, the table shows that in more “future-oriented” measurements – the change in the 35-to-44-year-old share of the population, average student debt, housing costs, and capital investment –New Hampshire fares quite poorly. These measures are directly linked to a state’s ability to attract and retain young people and arm them with the skills needed to compete for good jobs in coming years. Other areas in which the state ranks near the bottom of the country include many measures of business costs: industrial electric prices, corporate tax rate, health care costs, and land use restrictions. These, too, may constrain future economic growth, as other regions of the country can offer low-cost alternatives to organizations seeking a favorable businesses climate.
6 This is excerpted from “New Hampshire’s Economic Climate: Key Indicators,” NHCPPS, October 2013. http://www.nhpolicy.org/report/new-hampshireamp39s-economic-climate-key-indicators
What is New Hampshire? 2015 Edition 16
Table 2: New Hampshire Economic Dashboard 2013
Indicator New Hampshire Rank Homeownership Rates 2 Pollution Abatement / Dollar Value Added 3 Percent of Tree Cover Urban Areas 3 High School Graduation Rate 4 Voter Turnout Rate 4 Percent of Population in Science & Engineering workforce 5 Percent of Population with Associated Degree or Higher 6 Percent of Children Aged 3-4 in Preschool 6 Public Health and Welfare Spending Per Person in Poverty 7 Manufacturing Supercluster LQ 7 State Business Tax Climate Index 8 Consumption per Capita, Million BTU 8 Transportation Energy Expenditures as Percent of Personal Income 8 VC Investment Dollars per Capita 2011 8 Percent Uninsured 2011 9 R&D Performed per $GDP (Percent) 10 Business Churn 12 Domestic Tourism Spending per Capita 13 Manufacturing Contribution to Total Compensation 13 Creative Economy Jobs Concentration 14 2011 Age Adjusted Mortality Rates 15 Index of State Liability Systems 16 Volunteering Rate 19 State Energy Efficiency Rank 19 Percent of Mandated Health Benefits 20 Percent of State with Access to Broadband Speeds of 3mbps for Downloads, 768 kbps for 20 Water Infrastructure Needs per Capita 21 CEO Grades for State Taxation and Regulation 22 Percent of Jobs in Firms with 20 to 99 Employees 23 Public Government & Administration per $ Personal Income 24 Rate of HS Graduates Going to Degree-Granting Institution 24 Total Employment Percent Change 2007 to 2012 25 Expenditures per Capita, Dollars 26 Rent more than 30% of income 28 Total Health Care Expenditures as a Percent of Gross State Product (GSP), 2010 32 Ratio Median Housing Price to Median Income 34 Natural Gas Prices in Dollars per MMBTU 34 Portion of Unacceptable Rough Roads 35 State-Specific Standardized Infection Ratios (SIRs): 36 State Spending on Natural Resources per Capita 37 Top Marginal Corporate Tax Rate 38 Percent of Bridges Deficient or Obsolete 39 Owner Costs More than 30% of Income 43 State Debt per $ Personal Income 45 Industrial Electric Prices 46 Capital Investment Projects per 100,000 Population 46 Land Use Restriction 47 Change in 35-44 Year Old Share of Population, 2000 to 2010 48 Average Family Premium per Enrolled Employee For Employer-Based Health Insurance 49 Average Student Debt 50
These costs can be compared in detail across states through the use of Regional Price Parities (RPPs), the price levels of goods and services stated as a percentage of the national price level. Based on the costs of various items from the Consumer Price Index including food, transportation, and education, RPPs can be interpreted as the buying power of a dollar in different parts of the country. Using the United States as a baseline with 100, New Hampshire is

What is New Hampshire? 2015 Edition 17
one of a handful of states with a greater RPP (105.9) than the national average. This means that costs in New Hampshire are 5.9% higher than the mean of the United States.
Figure 15: Regional Price Parities by State, 2013 (US = 100)
Source: U.S. Department of Commerce, Bureau of Economic Analysis
Though New Hampshire frequently perceives itself as having an unusually business-friendly climate, this is mostly true in regards to costs only when compared to the rest of New England. Competition with states from other regions of the nation is significantly fiercer.
Policymakers need to prioritize economic development investments In the past, when considering economic development options, New Hampshire policymakers have focused on those areas where the state ranks high in state-by-state surveys: the creation of a low-tax environment, with a focus on high quality of life measures, such as a clean environment, low poverty and low crime. But in order to maintain a competitive advantage against other states, should policymakers here redirect their focus on areas where New Hampshire has typically fallen short, including healthcare and energy costs, infrastructure and public higher education spending?
New Hampshire, 105.9
86 88 90 92 94 96 98 100 102 104 106 108 110 112 114 116 118
MississippiArkansas
South DakotaAlabama
West VirginiaKentuckyMissouri
OhioOklahoma
IowaNebraska
South CarolinaTennessee
KansasLouisiana
IndianaNorth Dakota
North CarolinaGeorgia
IdahoWisconsinMichiganMontana
New MexicoWyoming
TexasArizona
UtahMinnesota
MaineRhode Island
NevadaPennsylvania
OregonFlorida
VermontIllinois
DelawareColorado
VirginiaWashington
New HampshireAlaska
MassachusettsConnecticut
MarylandCalifornia
New JerseyNew York
Hawaii

What is New Hampshire? 2015 Edition 18
Will investments in these or other areas yield better returns on economic growth? The answer, for now, is unclear. But what is clear is that New Hampshire can no longer rely on the demographic trends that have propelled it to economic prosperity over the past three decades. Should the state focus on certain regions of the state? For example, a pro-growth model might focus on the five communities with the highest level of economic productivity, which includes Nashua, Manchester, Concord, Portsmouth, and Rochester. Together, these cities accounted for more than 60 percent of the state’s wages in 2012. Encouraging continued growth in the existing manufacturing sector may provide additional returns to other parts of the state. There is no single, simple response to this new set of circumstances; policymakers will have to weigh various options. These include investing in human capital (an area where we rank relatively high, as measured by educational attainment), redesigning the state’s tax structure (where New Hampshire enjoys one of the lowest per-capita tax collection rates in the country but maintains high corporate taxes), or investing in improved infrastructure and transportation (an area in which the state ranks relatively poorly). The likely return-on-investment of these and other options should be part of that decision-making process, as well.
Additional resources “From Tailwind to Headwind: New Hampshire’s Shifting Economic Trends,” NHCPPS,
September 2012. http://www.nhpolicy.org/report/from-tailwind-to-headwind-new-hampshireamp39s-shifting-economic-trends
“New Hampshire’s Economic Climate: Key Indicators,” NHCPPS, October 2013. http://www.nhpolicy.org/report/new-hampshireamp39s-economic-climate-key-indicators
“Real Personal Incomes for States and Metropolitan Areas, 2013,” Bureau of Economic Analysis, July 2015. http://www.bea.gov/newsreleases/regional/rpp/rpp_newsrelease.htm
“New Hampshire’s Economy at a Glance,” Bureau of Labor Statistics. http://www.bls.gov/eag/eag.nh.htm
What is New Hampshire? 2015 Edition 19
Education in New Hampshire
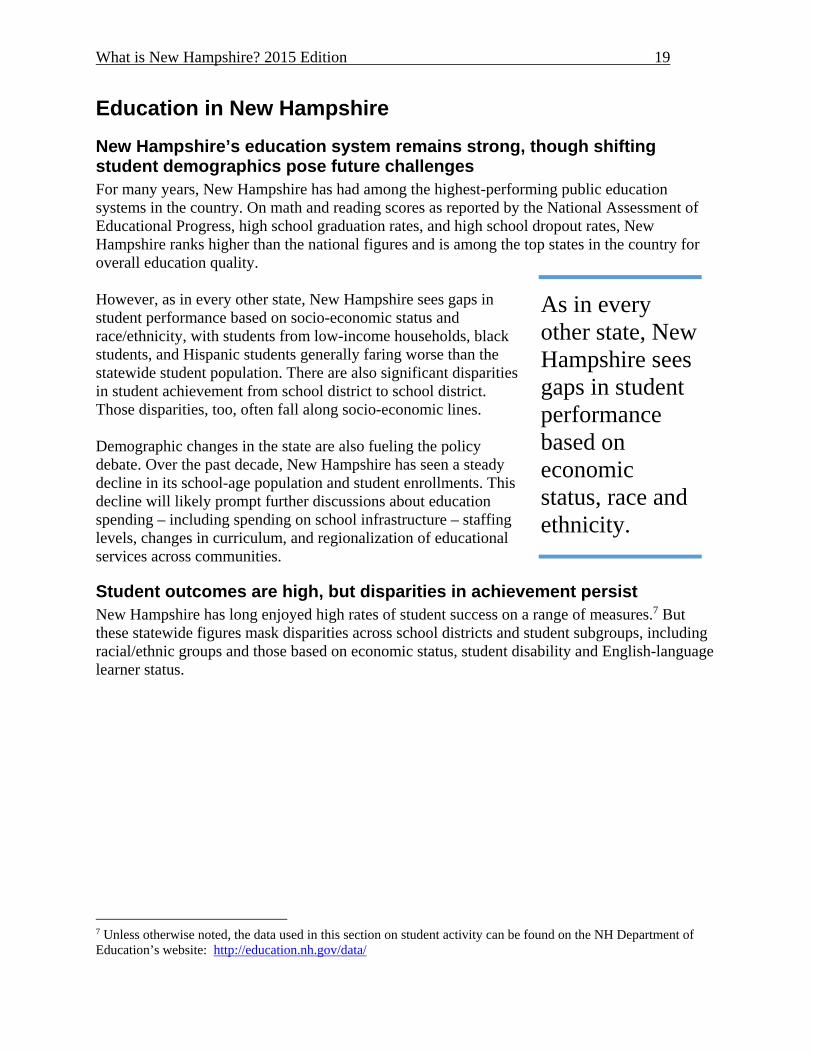
New Hampshire’s education system remains strong, though shifting student demographics pose future challenges For many years, New Hampshire has had among the highest-performing public education systems in the country. On math and reading scores as reported by the National Assessment of Educational Progress, high school graduation rates, and high school dropout rates, New Hampshire ranks higher than the national figures and is among the top states in the country for overall education quality. However, as in every other state, New Hampshire sees gaps in student performance based on socio-economic status and race/ethnicity, with students from low-income households, black students, and Hispanic students generally faring worse than the statewide student population. There are also significant disparities in student achievement from school district to school district. Those disparities, too, often fall along socio-economic lines. Demographic changes in the state are also fueling the policy debate. Over the past decade, New Hampshire has seen a steady decline in its school-age population and student enrollments. This decline will likely prompt further discussions about education spending – including spending on school infrastructure – staffing levels, changes in curriculum, and regionalization of educational services across communities.
Student outcomes are high, but disparities in achievement persist New Hampshire has long enjoyed high rates of student success on a range of measures.7 But these statewide figures mask disparities across school districts and student subgroups, including racial/ethnic groups and those based on economic status, student disability and English-language learner status.
7 Unless otherwise noted, the data used in this section on student activity can be found on the NH Department of Education’s website: http://education.nh.gov/data/
As in every other state, New Hampshire sees gaps in student performance based on economic status, race and ethnicity.

What is New Hampshire? 2015 Edition 20
Figure 16: Percent of Students Scoring Proficient or Higher on State Reading Tests
Scores on the annual NECAP exams, the state’s standardized tests of student achievement, vary greatly across districts. For instance, the percent of 3rd grade students scoring “proficient” or higher for reading last year ranged from 50 percent in one district to 100 percent for several others, as shown in Figure 17.
Figure 17: Third Grade Reading Scores by School District, 2013 (Percent of Students Scoring "Proficient" or Higher)
40%
45%
50%
55%
60%
65%
70%
75%
80%
85%
90%
2005 2006 2007 2008 2009 2010 2011 2012 2013
All students Asian
Black Hispanic
Low-income White
0%
10%
20%
30%
40%
50%
60%
70%
80%
90%
100%

What is New Hampshire? 2015 Edition 21
Graduation rates also vary considerably across the state. While the overall state graduation rate is comparatively high, with the majority of New Hampshire high schools graduating between 77 percent and 95 percent of their students in 2011, a handful of schools show stubbornly low graduation rates – with nearly one-third of students in some high schools failing to graduate on time in 2011. College enrollment rates among high school graduates in 2014 ranged from less than 50 percent at some schools to 100 percent at one school.
Figure 18: Percent of High School Graduates Entering Post-Secondary Education, Class of 2014 (Each bar represents a school district in New Hampshire.)
Source: New Hampshire Department of Education
Education funding is largely a local affair School district revenue is raised through a number of different sources. The major source of district revenue is generated through property taxes.
Figure 19: New Hampshire School District Revenue by Category, 2013-148
8 Source: New Hampshire Department of Education, New Hampshire Department of Administrative Services
State Average, …
0%
10%
20%
30%
40%
50%
60%
70%
80%
90%
100%
Local Property …
Statewide Property …
State Foundation/ Adequacy
Aid, 19%
Federal Aid, 6%
Other State Aid, 3% Tuition, Food, …

What is New Hampshire? 2015 Edition 22
State education aid (not counting the statewide property tax) represents roughly 31 percent of total school district revenue. The share of state aid varies considerably from community to community across New Hampshire. This revenue model reflects the growing efforts to “target” state education aid to communities with less ability to generate school district revenue through local taxation. However, the extent to which targeting is allowed to drive state education spending remains a topic of considerable debate. Compared to the rest of the nation, New Hampshire ranks in the bottom third in terms of state contributions to education. In 2011-12 (the most recent year for which comparable national data is available), the state contributed 36 percent of total school district revenue (including the statewide property tax), compared to the national average of 45.5 percent. In terms of total spending, however, New Hampshire school districts spent more per pupil than the national average. Though as a percent of the overall economy, New Hampshire’s education spending has been below the national rate. During the 2013-14 school year, New Hampshire school districts spent an average of $13,721 per pupil, well above the national average of $10,700 per pupil.
Figure 20: Per-Pupil Education Spending by State, 2013-149
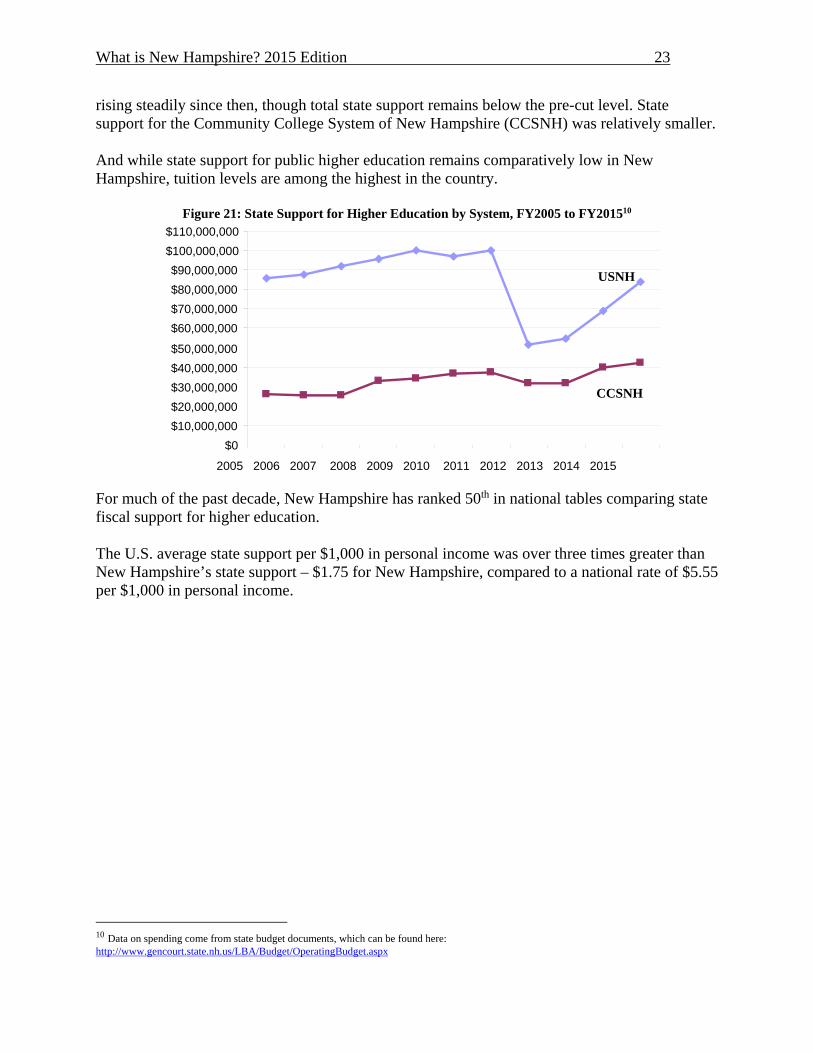
New Hampshire’s funding for higher education is the lowest in the country The past decade has witnessed significant changes in state fiscal support for higher education, much of it driven by financial pressures from the Great Recession. State funding for the University System of New Hampshire (USNH) fell by nearly 50 percent in FY2012, but has been
9 Annual Survey of School System Finances 2013
New Hampshire, $13,721
$0
$2,000
$4,000
$6,000
$8,000
$10,000
$12,000
$14,000
$16,000
$18,000
$20,000
What is New Hampshire? 2015 Edition 23
rising steadily since then, though total state support remains below the pre-cut level. State support for the Community College System of New Hampshire (CCSNH) was relatively smaller. And while state support for public higher education remains comparatively low in New Hampshire, tuition levels are among the highest in the country.
Figure 21: State Support for Higher Education by System, FY2005 to FY201510
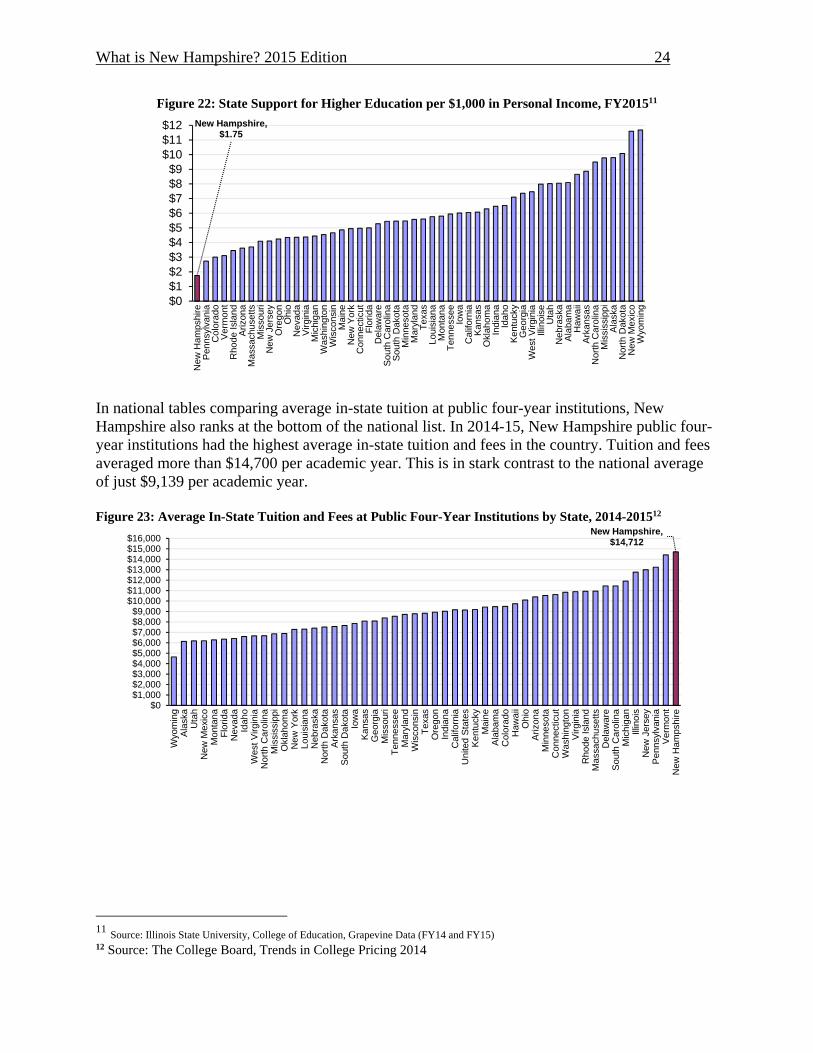
For much of the past decade, New Hampshire has ranked 50th in national tables comparing state fiscal support for higher education. The U.S. average state support per $1,000 in personal income was over three times greater than New Hampshire’s state support – $1.75 for New Hampshire, compared to a national rate of $5.55 per $1,000 in personal income.
10 Data on spending come from state budget documents, which can be found here: http://www.gencourt.state.nh.us/LBA/Budget/OperatingBudget.aspx
$0
$10,000,000
$20,000,000
$30,000,000
$40,000,000
$50,000,000
$60,000,000
$70,000,000
$80,000,000
$90,000,000
$100,000,000
$110,000,000
2005 2006 2007 2008 2009 2010 2011 2012 2013 2014 2015
USNH
CCSNH
What is New Hampshire? 2015 Edition 24
Figure 22: State Support for Higher Education per $1,000 in Personal Income, FY201511
In national tables comparing average in-state tuition at public four-year institutions, New Hampshire also ranks at the bottom of the national list. In 2014-15, New Hampshire public four-year institutions had the highest average in-state tuition and fees in the country. Tuition and fees averaged more than $14,700 per academic year. This is in stark contrast to the national average of just $9,139 per academic year. Figure 23: Average In-State Tuition and Fees at Public Four-Year Institutions by State, 2014-201512
11 Source: Illinois State University, College of Education, Grapevine Data (FY14 and FY15) 12 Source: The College Board, Trends in College Pricing 2014
New Hampshire, $1.75
$0$1$2$3$4$5$6$7$8$9
$10$11$12
New
Ham
pshi
reP
enns
ylva
nia
Col
orad
oV
erm
ont
Rho
de Is
land
Ariz
ona
Mas
sach
uset
tsM
isso
uri
New
Jer
sey
Ore
gon
Ohi
oN
evad
aV
irgin
iaM
ichi
gan
Was
hing
ton
Wis
cons
inM
aine
New
Yor
kC
onne
ctic
utF
lorid
aD
elaw
are
Sou
th C
arol
ina
Sou
th D
akot
aM
inne
sota
Mar
ylan
dT
exas
Loui
sian
aM
onta
naT
enne
ssee
Iow
aC
alifo
rnia
Kan
sas
Okl
ahom
aIn
dian
aId
aho
Ken
tuck
yG
eorg
iaW
est V
irgin
iaIll
inoi
seU
tah
Neb
rask
aA
laba
ma
Haw
aii
Ark
ansa
sN
orth
Car
olin
aM
issi
ssip
piA
lask
aN
orth
Dak
ota
New
Mex
ico
Wyo
min
g
New Hampshire, $14,712
$0$1,000$2,000$3,000$4,000$5,000$6,000$7,000$8,000$9,000
$10,000$11,000$12,000$13,000$14,000$15,000$16,000
Wyo
min
gA
lask
aU
tah
New
Mex
ico
Mon
tana
Flo
rida
Nev
ada
Idah
oW
est V
irgin
iaN
orth
Car
olin
aM
issi
ssip
piO
klah
oma
New
Yor
kLo
uisi
ana
Neb
rask
aN
orth
Dak
ota
Ark
ansa
sS
outh
Dak
ota
Iow
aK
ansa
sG
eorg
iaM
isso
uri
Ten
ness
eeM
aryl
and
Wis
cons
inT
exas
Ore
gon
Indi
ana
Cal
iforn
iaU
nite
d S
tate
sK
entu
cky
Mai
neA
laba
ma
Col
orad
oH
awai
iO
hio
Ariz
ona
Min
neso
taC
onne
ctic
utW
ashi
ngto
nV
irgin
iaR
hode
Isla
ndM
assa
chus
etts
Del
awar
eS
outh
Car
olin
aM
ichi
gan
Illin
ois
New
Jer
sey
Pen
nsyl
vani
aV
erm
ont
New
Ham
pshi
re

What is New Hampshire? 2015 Edition 25
Student debt continues to climb Mounting student debt has become a critical policy issue on both the national and the state level. The total amount of student debt held by U.S. graduates is more than $1 trillion – with almost 40 million Americans carrying student debt.13 According to current estimates, the average New Hampshire college student graduates with more than $32,000 in student loan debt – the highest in the nation.14 If the cost of higher education continues to climb and loans remain one of the primary sources of self-funding, student debt will likely continue to climb. Average student debt is increasing at all USNH institutions.15 Figure 24: Average Undergraduate Debt Load for In-State Students by Institution, 2007-2012
Source: UNH, Keene, and Plymouth Office of Institutional Research
Despite increasing debt loads among in-state students attending New Hampshire institutions, students enjoy lower default rates on their student loans when compared to the national average. When examining the default rate on student loans of students cohorts three years after leaving their schools (a reasonable measure for a student’s ability to pay off their loans), New Hampshire’s private universities both eclipse and trail its public schools, highlighting the difficult decision students face in choosing between public and private post-secondary education.
13 Consumer Financial Protection Bureau, “Student Loan Affordability: Analysis of Public Input on Impact and Solutions”, May 8, 2013. 14 Institute for College Access & Success, The Project on Student Debt: http://projectonstudentdebt.org. The Project on Student Debt collects data from both private and public colleges and does not distinguish between resident and non-resident students. 15 Data may not include all private loans that students or their parents take out. This only includes loan information received or reported to the institution.
$0
$5,000
$10,000
$15,000
$20,000
$25,000
$30,000
$35,000
2007 2008 2009 2010 2011 2012
UNH KSC
PSU

What is New Hampshire? 2015 Edition 26
Figure 25: Three-Year Official Cohort Default Rates for New Hampshire Institutions16
The last three years of cohort data show student loan default rates generally remaining consistent within institutions, with the greatest variation occurring between institutions. The University of New Hampshire enjoys the lowest student loan default rate of New Hampshire’s public schools, just 2.9% in 2014, while Granite State College experiences among the worst student loan default rate in New Hampshire at 10.3% the same year. Business Administration and Management is the most popular major at both of these schools, so differing returns on investment from the selection of a major is not enough to account for this discrepancy in the student loan default rate. The amount in-state students pay for bachelor’s degrees at public schools in New Hampshire is similar between schools, averaging near $100,000, while private schools may be nearly twice that price. Even with higher costs, however, graduates of certain private universities may see a greater return on their investment depending on which institution they attend. Looking ahead
New Hampshire should expect continued declines in student population Over the past decade, New Hampshire has seen several changes in its student population, including a steady decline in public school enrollment, growth in the charter school and home school population17, and growing racial and ethnic diversity among school children, as well as increases in measures of economic hardship among young people.
16 Source: U.S. Department of Education 17 New Hampshire legalized the operation of charter schools, which are funded by tax dollars but have more leeway in administration and curricula than traditional schools, beginning with the 2004-05 school year.
0.0%
2.0%
4.0%
6.0%
8.0%
10.0%
12.0%
14.0%
16.0%
2009 2010 2011

What is New Hampshire? 2015 Edition 27
These trends will help shape future education policy discussions at the state and local level, including conversations about staffing levels, funding formulas, investment in school facilities, curriculum offerings, and the achievement gap.
Figure 26: New Hampshire Public Grade School Enrollment
In 2002-03, total public school enrollment peaked at about 207,000 students. By the 2014-15 school year, total public school enrollment had decreased to 183,604 – a decline of 11.6 percent from the 2002-03 high. This decline raises questions for school districts about the possible need to consolidate functions across schools, including combining school districts and SAUs.
Considering cost reduction through school consolidation18 With demographic pressure, declining state aid, and increased pressure for reporting assessment, and accountability on districts from state and federal governments, arguments have been made for school consolidation. These arguments usually rest on a handful of assumptions. Most common is the basic concept of economies of scale, whereby adding students to a district will reduce per pupil costs if the additional students do not result in an increase in fixed costs. In addition, it is often argued that larger districts will be able to support more specialized teaching staff, thereby providing a wider, more diverse education to students. There are often, however, other factors which can undercut any potential savings or advantages assumed in the above arguments. For one, average transportation costs may increase through consolidation, as a district or SAU must transport more students over a larger geographic area. Consolidation may also result in higher personnel costs, especially if new salary agreements result in lower-paid staff from one district becoming newly eligible for higher wages and benefits once they are employed by a larger district.
18 Excerpted from: “School Consolidation in NH: Some Points for Consideration” NHCPPS, April 2015. http://www.nhpolicy.org/report/school-consolidation-in-nh-some-points-for-consideration
63,142 64,458 66,828 67,347 67,384 66,413 64,961 64,392 62,882 61,494 60,114 58,733 58,158
42,077 41,672 40,514 39,747 38,646 38,022 36,880 36,726 35,923 34,714 34,696 34,187 33,743
90,772 89,077 87,034 85,788 84,636 83,234 82,313 81,086 80,200 79,528 78,065 77,397 76,576
9,757 9,989 10,116 10,360 10,375 10,489 10,968 11,969 11,922 11,904 11,888 11,602 11,570
0
25,000
50,000
75,000
100,000
125,000
150,000
175,000
200,000
225,000
High School Middle School Elementary Kindergarten

What is New Hampshire? 2015 Edition 28
Still, it must be said: Research offers few firm conclusions about the impact of consolidation. In most instances, the impacts (whether financial, educational or community) of school/district consolidation vary widely according to the particular circumstances of each case. One important note: A distinction must be drawn between the consolidation of school districts, and consolidation of SAUs. A school district is a distinct political subdivision, with a single controlling school board. An SAU, on the other hand, can cover just a single school district or include multiple districts. School district costs include the usual things associated with education expenses: instruction, transportation, facilities maintenance, teacher salaries and benefits, etc. The costs associated with an SAU office are largely administrative, usually limited to the personnel costs associated with the superintendent office staff. In terms of cost savings from consolidation, this means that combining existing SAUs will likely result in lesser savings unless that shift is accompanied by a parallel consolidation, to some degree, among the member school districts. In addition, the fact that superintendents in multi-district SAUs must report to multiple school boards has been raised numerous times in past discussions as a barrier to streamlining administrative responsibilities in the state’s public schools. Attempts to quantify costs savings associated with consolidation typically cover the following areas:
Financial savings from consolidation are most likely when dealing with relatively small educational units. There is, however, wide disagreement about what constitutes a “small” school or district.19
Transition costs are often associated with consolidation, though they may decline over
time. These transition costs may include new construction costs to accommodate the shift in student population that results from consolidation.
Research indicates that increasing school size initially brings positive returns both on cost savings and student outcomes, but these trends are reversed as size continues to increase beyond a certain point. Defining that point with precision, however, is subject to disagreement within the research literature.20
Consolidation plans often overlook impacts beyond education costs, including residents’ connections with existing schools, housing prices and economic activity in the wider community associated with a local school.
19 Craig Howley, Jerry Johnson & Jennifer Petrie, “Consolidation of Schools and Districts: What the Literature Says and What it Means,” National Education Policy Center, February 2011, and Ulrich Boser, “Size Matters: A Look at School-District Consolidation,” Center for American Progress, 2013. 20 John Slate & Craig H. Jones, “Effects of School Size: A Review of the Literature with Recommendations,” Essays in Education, vol. 13, 2005. Joshua Barnett, Gary Ritter & Christopher Lucas, “Does Size Matter? School Consolidation Policy Issues in Arkansas,” University of Arkansas, Office for Education Policy,” 2004.

What is New Hampshire? 2015 Edition 29
Table 3: Administrative Costs for New Hampshire Districts by Enrollment
We see in New Hampshire that, as enrollment increases, general administrative expenses (those associated with district or SAU-wide functions) steadily decrease. In fact, general administration consumes more than twice as much of a district budget for districts with 100 students or fewer than it does for those districts with 3,000 students or more. However, school-level administration costs remain relatively similar regardless of district-wide enrollment, varying between 4.7 percent and 5.6 percent of each enrollment category. This seems to indicate that cost savings are most evident, not through combining individual schools, but by combining smaller districts into larger districts.
The Common Core is bringing big changes in curriculum and assessments The 2014-15 academic year marked the first year of full implementation of the Common Core State Standards (CCSS) in New Hampshire schools. These standards (often referred to simply as the “Common Core”) are a set of expectations about what students should know and be able to demonstrate at each grade level. The standards set goals for student learning and benchmarks against which to measure that learning. The CCSS were developed by education leaders across the country to provide a uniform set of standards from state to state. The goal is to have the same set of expectations for students, no matter where they go to school. The CCSS emphasize “higher-order” skills, such as critical thinking and problem-solving, that are supposed to better equip students for success in higher education and the workplace. The CCSS focus on two areas: mathematics and language arts. While New Hampshire has adopted its own state standards for other subject areas, those for math and language arts mirror those of the CCSS. Among the changes ushered in by the Common Core is a new set of standardized tests. New Hampshire is one of 24 states administering the SMARTER Balanced exams as part of the Common Core implementation. These new standardized tests, which replace the NECAP exams
District Enrollment
# of districts*
Gen. Admin expenses as
% of total expenses
School Admin expenses as %
of total expenses
Gen Admin
per pupil
School Admin
per pupil
<100 students 26 6.3% 5.6% $2,155 $1,923
100‐300 28 4.6% 4.7% $1,116 $1,141
300‐500 25 4.2% 4.7% $865 $979
500‐1,000 27 4.2% 5.3% $768 $971
1,000‐3,000 41 4.2% 5.4% $666 $862
3,000‐5,000 12 3.1% 5.2% $443 $751
5,000+ 2 2.7% 5.1% $325 $608
Statewide 161 3.8% 5.2% $605 $829
*14 New Hampshire districts that do not operate schools are not included here.

What is New Hampshire? 2015 Edition 30
that have been in place since 2005, were first administered to New Hampshire students in spring 2015. Students take these new exams online, with computers, and, because of quicker result turnaround times, are designed to provide more useful information to teachers to tailor instruction to meet the needs of each student. Dependent on approval of federal regulators, some New Hampshire schools may opt to replace administration of the SMARTER Balanced assessment with the SAT or ACT exams to satisfy testing requirements following recent changes to state law. The most visible issues in this first year of CCSS implementation has been the participation rates of students at higher grade levels. In Nashua, for instance, 99% of students in grades three through seven participated in this year’s SMARTER Balanced exams, but a mere 55% of eleventh graders took the exam, resulting in a district-wide participation level of 92%. This falls below the federal government’s required participation level by three percent. New Hampshire’s largest school district, Manchester, also did not meet federal requirements for participation levels. It is thought that beyond parental resistance to the new standards, students at higher grade levels may wish to avoid these stringent, additional tests. Beyond ensuring that new curricula and teaching methods align with these new exams, meeting desired participation levels among students will be among the challenges facing educators in the 2015-16 school year.
How can public education help address the needs of the future economy? New Hampshire has a higher share of its population employed in science and engineering fields than much of the rest of the country (3.9 percent compared to 2.5 percent nationwide), ranking the fifth-highest state in the country (and behind the District of Columbia).
Figure 27: Percent of Population Employed in Science and Engineering Fields, 2010
Source: Population Reference Bureau, Trends in Science and Engineering Labor Force Project
0.00%
1.00%
2.00%
3.00%
4.00%
5.00%
6.00%
Mis
siss
ippi
Ark
ansa
sN
evad
aK
entu
cky
Loui
sian
aW
est V
irgin
iaO
klah
oma
Wyo
min
gF
lorid
aT
enne
ssee
Sou
th C
arol
ina
Ala
bam
aM
onta
naS
outh
Dak
ota
Indi
ana
Nor
th D
akot
aN
ew Y
ork
Haw
aii
Mis
sour
iG
eorg
iaO
hio
Mai
neIo
wa
Nor
th C
arol
ina
Neb
rask
aA
rizon
aIll
inoi
sP
enns
ylva
nia
Kan
sas
Mic
higa
nT
exas
Uni
ted
Sta
tes
Idah
oW
isco
nsin
New
Mex
ico
Ala
ska
Ore
gon
Del
awar
eV
erm
ont
Rho
de I
slan
dU
tah
Cal
iforn
iaC
onne
ctic
utN
ew J
erse
yM
inne
sota
Was
hing
ton
New
Ham
pshi
reC
olor
ado
Mas
sach
uset
tsV
irgin
iaM
aryl
and
Dis
tric
t of
New Hampshire
U.S.

What is New Hampshire? 2015 Edition 31
But our science and engineering labor force is also older, on average, than the rest of the country. Among that sector of the labor force, 21.8 percent of workers are over the age of 55, compared to 18.1 percent nationally. This raises questions about the state’s ability to replace that older cohort of science and engineering field workers as they retire over the coming decade. Additional Resources
“School Consolidation in NH: Some Points for Consideration” NHCPPS, April 2015. http://www.nhpolicy.org/report/school-consolidation-in-nh-some-points-for-consideration
“Manchester’s Education Benchmarks” NHCPPS, September 2014. http://www.nhpolicy.org/report/manchesteramp39s-education-benchmarks
“Public Colleges, Public Dollars: Higher Education in New Hampshire” NHCPPS, March 2014. http://www.nhpolicy.org/report/public-colleges-public-dollars-higher-education-in-nh
“Student-Centered Learning in New Hampshire: An Overview and Analysis” NHCPPS, February 2013. http://www.nhpolicy.org/report/student-centered-learning-in-nh-an-overview-and-analysis

What is New Hampshire? 2015 Edition 32
Health care in New Hampshire
New Hampshire’s health care system is in the midst of great change New Hampshire’s health care policy landscape faces great change – and great uncertainty – as the state grapples with several intertwining trends in health care financing, demographic change and national policy. The most critical issues in health care in New Hampshire today include:
The implementation of the sweeping federal health care reform effort known as the Patient Protection and Affordable Care Act (ACA) is transforming many elements of New Hampshire’s health care system, and has resulted in significant increases in health insurance coverage.
Recent state reforms, including changes to the state’s disproportionate share program, assessments of the state’s certificate of need process, implementation of Medicaid managed care program, and the expansion of the Medicaid program through the New Hampshire Health Protection Act have introduced a new level of uncertainty into the health care marketplace.
New Hampshire’s aging population is increasing pressure on policymakers to consider reforms to the health delivery and financing system.
The following questions are likely to dominate the policy debate in the immediate future:
Has the implementation of the Affordable Care Act – including the subsidization of private insurance and the state’s expansion of Medicaid to low income adults - helped reduce the number of uninsured residents, or lowered uncompensated care costs to New Hampshire hospitals?
Have incentives designed to encourage the development of accountable care organizations resulted in consolidation within the health care industry and have any of those changes lowered health care costs?
Have the enormous changes in the health care marketplace had a positive or negative impact on the health and productivity of New Hampshire residents?
Health care reform is reshaping New Hampshire’s health care marketplace The Patient Protection and Affordable Care Act, enacted in March 2010, set forth two ambitious goals for the nation’s health system: extend health coverage to the uninsured, and slow the growth in health care costs. The Act is being phased in gradually over several years, but the legislation promises to fundamentally change health care delivery in New Hampshire.21 The major components of the Act are:
the enactment of a number of health insurance reforms; providing insurance premium subsidies for some individuals not eligible for Medicaid
with incomes between 138 percent and 400 percent of the federal poverty level; providing the states with an option to expand the state’s Medicaid program to adults with
incomes less than 138 percent of the federal poverty level;
21 A full implementation timeline can be found here: http://kff.org/interactive/implementation-timeline/

What is New Hampshire? 2015 Edition 33
requiring that all individuals secure health insurance or else pay a fine. The Act mandates a series of structural changes in the market as well – including the development of health insurance exchanges and the introduction of pilot programs encouraging the development of integrated health systems called Accountable Care Organizations (ACOs) to improve the cost-effectiveness of care through the Medicare program. Some of the major components of the Act have already been implemented. As of September 2010, health insurance plans in New Hampshire are now required to provide dependent coverage for anyone under age 26. Insurance companies are now also required to insure children younger than 19 who have pre-existing conditions. In 2014, the state created the Health Protection Plan, which expands the state’s Medicaid program through a series of public, and eventually all private, insurance options.22 With the introduction of federal insurance subsidies for people with incomes above 138 percent of the federal poverty level, and the expansion of Medicaid for those with incomes below 138 percent of the federal poverty level, it is anticipated that a significant number of individuals will have coverage who did not have any in the past. An anticipated increase in coverage – as many as 100,000 New Hampshire residents – has already transformed the New Hampshire health insurance market, with two new insurance providers scheduled to offer insurance in New Hampshire in 2015. One of the goals of the ACA was to decrease the number of people lacking health insurance. At the end of the most recent enrollment period (March of 2015), 45,000 people in New Hampshire had sought coverage through the federal health insurance exchange. During that same time period (from March of 2014 through March of 2015), the total number of individuals enrolled in the Medicaid program increased by almost 40,000 individuals (See Figure 28 below).
Figure 28: Growth in Medicaid Enrollment Associated with the Health Protection Act23
22 For a description of the program see: http://www.dhhs.state.nh.us/ombp/nhhpp/index.htm 23 Data was provided by the NH Department of Health and Human Services in its monthly caseload report.
020,00040,00060,00080,000
100,000120,000140,000160,000180,000200,000
Mar
-14
Apr
-14
May
-14
Jun-
14
Jul-1
4
Aug
-14
Sep
-14
Oct
-14
Nov
-14
Dec
-14
Jan-
15
Feb
-15
Mar
-15
Apr
-15
May
-15
Jun-
15
Medicaid (Excluding NH HPP) NH HPP (Part of Medicaid)

What is New Hampshire? 2015 Edition 34
Many analysts argued that the primary impact of the Affordable Care Act and the expansion in the state’s Medicaid program would be to increase the share of the population that has insurance coverage, improve the financial condition of those individuals, lower uncompensated care costs to those providers which served the uninsured in the past, and improve the financial status of those providers that are now receiving payment for services that have historically gone unreimbursed. We will have to wait to understand the impact of these changes. Because of lags in survey data, we will not have a good measure of the impact of these changes on health insurance coverage until the fall of 2015, when data becomes available that allows states to analyze changes in insurance coverage through 2014. Understanding the impact of these changes on health care providers will be similarly delayed until audited financial statements which cover the period of change can be reviewed and analyzed.
Health care continues to be a growth industry in New Hampshire Growth in health care spending in New Hampshire is outpacing growth in other consumer expenses, including energy costs and taxation levels. Since 1970, locally raised taxes (slightly more than 2 percent of gross domestic product) and energy spending (now approximately 9 percent of gross domestic product) have remained relatively constant as a share of personal income. Health care, on the other hand, has taken up an increasing share of personal income – up from 8 percent of gross domestic product in 1970 to approximately 17 percent today. As mentioned previously, health care is one of the most important parts of our economy and the primary source of job growth in New Hampshire. However, the rapid growth in health care has paused. After growing rapidly through the 2000s, health care as a share of the state’s output as measured by gross domestic product has remained relatively constant at 17% since the great recession.
New Hampshire’s Health Care System is High Cost In the Center’s analysis of various aspects of New Hampshire’s business environment in a national context – which included an assessment of health care, energy, workforce, housing, and natural and cultural resources among others – the New Hampshire health care system fared poorly, ranking 37th lowest in the country based on various measures of cost, access, health and quality. Only one other Northern New England state - Maine – ranked worse.
0%
2%
4%
6%
8%
10%
12%
14%
16%
18%
197
0
197
2
197
4
197
6
197
8
198
0
198
2
198
4
198
6
198
8
199
0
199
2
199
4
199
6
199
8
200
0
200
2
200
4
200
6
200
8
201
0
201
2
Healthcare Energy GF +ETF Revenue as % of GSP
Figure 29: Share of New Hampshire GDP: Energy, Health Care, and the State Budget

What is New Hampshire? 2015 Edition 35
New Hampshire resides in a high cost part of the country, which explains in part the relatively low ranking nationally. In 2013, the average annual premium for single person coverage in New Hampshire (including the portion paid by the employer) was $6,249 – 12.1 percent higher than the national average.
The average premium for family coverage in New Hampshire was $17,024 – 6.2 percent above the national average.
The average premium for two-person coverage in New Hampshire was $12,651 – 15.1 percent above the national average.
For both single coverage and family coverage paid by the employee, the average annual rate of increase in premiums in New Hampshire between 2000 and 2013 was about 9 percent, well above the rate of inflation in the same period.
Figure 30: Annual Growth in Health Insurance Premiums
New Hampshire United States
2000 2013 Annual Increase 2000 2013 Annual Increase Single Coverage $470 $1,415 8.85% $450 $1,170 7.63%Family Coverage $1,752 $4,592 7.69% $1,614 $4,421 8.06%
2-Person Coverage n/a $3,177 - n/a $2,940 -
Source: The Medical Expenditure Panel Survey (MEPS)
Rising health insurance costs mean that health insurance consumes a larger portion of the family budget. Since 2000, health insurance premiums as a share of family income have grown from 10 percent to approximately 17 percent. (See Figure 31 below.) And the role of health care spending in the overall economy has grown at a similar pace. Moreover, New Hampshire businesses perennially identify health care as one of the most important policy questions.
Figure 31: Average Family Health Insurance as a Percentage of Mean Family Income in New Hampshire
Source: The Medical Expenditure Panel Survey (MEPS) and American Community Survey (ACS)
18.2%
14.0%
10.2%
15.4%16.9%
17.4%
0%
2%
4%
6%
8%
10%
12%
14%
16%
18%
20%
1998 1999 2000 2001 2002 2003 2004 2005 2006 2008 2009 2010 2011 2012
Year

What is New Hampshire? 2015 Edition 36
For additional information on the New Hampshire health care sector, look here:
“Measuring the Health of the Healthcare System, “NHCPPS, NH’s Healthcare Dashboard 2012. http://www.nhpolicy.org/report/measuring-the-health-of-the-healthcare-system-nhamp39s-healthcare-dashboard-2012
“Getting What We Pay For? Healthcare Spending in New Hampshire,” NHCPPS, January 2013. http://www.nhpolicy.org/report/getting-what-we-pay-for-healthcare-spending-in-nh
“Health and Equity in New Hampshire,” NHCPPS, February 2013. http://www.nhpolicy.org/report/health-and-equity-in-new-hampshire-2013-report-card
“New Hampshire’s Economic Climate: Key Indicators,” NHCPPS, October, 2013. http://www.nhpolicy.org/UploadedFiles/Reports/dashboard.pdf
An aging population is putting pressure on the health care system24 Among the impacts of an aging population will be a change in the demand for health care services, as older residents tend to spend a significantly higher share of their income on health care. This change in demand will vary considerably across sectors of the health care system, with Medicaid, Medicare, and private pay insurance companies experiencing the impact of an aging population in different ways. In addition, impacts will vary considerably across the state, as certain regions of New Hampshire age quicker than others. Some will see an increase in the elderly population because of in-migration, while others will age in place, with current residents growing older. With the aging of the population, some number of people will shift private market insurance to Medicare. This will put pressure on the health system to provide more with less. The reason: Medicare reimbursement rates are lower than average patient expenses, which means health care providers will receive less money for providing services. Medicare’s increasing market share will likely lead to future reimbursement reductions. Medicaid will increasingly become an insurer of the elderly. Currently, Medicaid provides health insurance for a wide range of individuals, including the poor, those with disabilities, and the elderly. That balance will shift considerably towards the over-65 population in coming years. Roughly 25 percent of total direct medical expenditures made by Medicaid today are accounted for by those over the age of 65. By 2020, that number will rise to more than 50 percent. These trends will put pressure on the state to reevaluate the existing moratorium on the construction of nursing homes, as well as budgetary limits on home-and-community-based care services. Planning for these changes has hardly begun. Pressure on private insurance premiums will grow. As noted earlier, health care premiums have been growing quickly in New Hampshire. An aging population will accelerate that growth
24 Excerpted from: “New Hampshire’s Silver Tsunami: Aging and the Healthcare System,” NHCPPS, September 2011. http://www.nhpolicy.org/report/nhamp39s-silver-tsunami-aging-and-the-healthcare-system
What is New Hampshire? 2015 Edition 37
for two reasons. First, older individuals use more – and more expensive – health care. Second, as the market share of Medicare increases, hospitals and other providers will try to shift the cost of losses associated with Medicare to the private premium. For additional information on aging and the health care system in New Hampshire, look here:
“New Hampshire’s Silver Tsunami: Aging and the Healthcare System,” NHCPPS,
September 2011. http://www.nhpolicy.org/report/nhamp39s-silver-tsunami-aging-and-the-healthcare-system
State action The focus of health care policy making in the past 5 years has been dominated by the state’s Medicaid program, which accounts for over $1 billion in spending. Beginning in 2011, state policymakers started implementing a managed care system for New Hampshire’s Medicaid program, which could ultimately impact 170,000 individuals. The first phase – which shifted medical care services into the managed care program – has been completed. Much remains to be done, however, as the final phases – which would shift services provided to the elderly and the disabled into managed care – have not yet started. From a fiscal perspective, the single largest policy concern was the state’s $200 million Hospital Disproportionate Share program, served to provide federal funds to the state and to specific hospitals. The program – often called ‘Medi-Scam’ – has brought in billions of dollars into New Hampshire since the 1990s. A 2012-13 budget change to the program resulted in significant losses to many hospitals in the Southern part of the state, which resulted in litigation. The litigants argued that the Medicaid Enhancement Tax was unconstitutional. A court finding that the Medicaid Enhancement Tax was unconstitutional put at risk both existing payments made to hospitals and approximately $90 million in funds currently being used to fund existing state services. The potential loss of these dollars resulted in a long period of negotiations between New Hampshire hospitals and the legislature and executive branch. In the resulting settlement, 25 of the state’s 26 hospitals agreed to drop the lawsuit in exchange for additional resources being directed to hospitals. This $90 million dollar change was agreed upon and funded by the Governor’s Office, the House and the Senate, in each of the budgets that they individually introduced. Finally, significant energy has been, and will continue to be devoted to, the implementation of the state’s Medicaid expansion program, the New Hampshire Health Protection Act. After months of negotiations between the Republican Senate, the Democrat House and the Governor’s Office, the legislature passed SB 413, a bill which expanded Medicaid to individuals with incomes up to 138% of the federal poverty level. This program – which is currently providing coverage to an estimated 40,000 individuals – will end effective December 31, 2015 absent additional legislative action. As part of the budget process, the House and Senate indicated that further information was needed to understand the impact of the Medicaid program on individuals and the health care system before additional action could be taken.

What is New Hampshire? 2015 Edition 38
New Hampshire’s State Budget Every two years, the New Hampshire Legislature draws up a budget to fund state activities. This spending plan covers a wide range of services, including public education, highway maintenance, prisons, environmental protection, health care for tens of thousands of people, and many more. Behind the dollar amounts in the budget document are thousands of policy decisions: which programs to fund, where to invest resources or scale back investments. Thus, in a sense, analyzing the state budget is one of the best ways to understand the state’s public policy priorities. In aggregate New Hampshire is a low spending state, but this may be driven by demand for services as opposed to a stingy state government 25
Each year, the Census Bureau reports information on total spending across the states. Figure 32 below shows variation in per-capita spending across the United States. The map shows clear geographic differences in per capita spending, with the South largely spending less per capita, and the Northeast, Northern parts of the Midwest, and the Pacific Northwest as being particularly high spending. New Hampshire stands out as spending relatively less among its neighbors in the North East.
Figure 32: Per Capital Public Spending in 201326
25 Excerpted from: “Looking Down the Fiscal Road: NH’s Long Term Finances, January 2015 http://www.nhpolicy.org/report/looking-down-the-fiscal-road-nhamp39s-long-term-finances 26 US Census Bureau, Population Estimates and Annual Survey of State Spending

What is New Hampshire? 2015 Edition 39
What explains these differences? To tease out these different explanations for New Hampshire’s spending patterns, we created a budget dashboard (based on the Census data on spending in 2013) that provides policymakers with a snapshot of how much New Hampshire is spending normalized to reflect the underlying demand for those services. Where appropriate or available, we normalized aggregate spending data by measures of the underlying demand. For example, we normalized state corrections spending with the number of inmates in state prisons. We also controlled for underlying cost of living differences in the states using a standard cost of living adjustor created by the Bureau of Labor Statistics. This type of display provides a clear, simple picture of the trade-offs that come from the various spending decisions made by state policymakers. Figure 33 below shows that per-capita spending is lower in New Hampshire than in the country as a whole (more than 20 percent below the national average) and that it grew much more slowly between 2002 and 2012 than in the rest of the country (more than 40 percent lower than the growth rate in the rest of the country). Total spending as a share of GDP, government administration per capita, education spending per child, and spending on natural resources and parks per capita were all below the national average.
Figure 33: Per Capita Spending in NH
But not all spending areas were below the national average. There are some expenditure areas where, when normalized for the underlying demand for services, spending is equal to or higher than the national average. Spending on police protection per crime, public welfare spending per
0% 20% 40% 60% 80% 100% 120% 140% 160% 180% 200%
Natural Resources and Parks Per Capita
Change in Total Spending 2002‐2012
Total Spending Per Capita
Education Spending Per Child
Governmental Administration Per Capita
Total Spending as a Percent of Income
Highway Spending Per Mile of Road
Correction Spending Per Prisoner
Public Welfare Spending Per Person in Poverty
Police Protection Spending Per Crime
Per Capita Interest on General Debt
NH State Spending Dashboard ‐ NH Value as Percent of National Average
NationalAverage
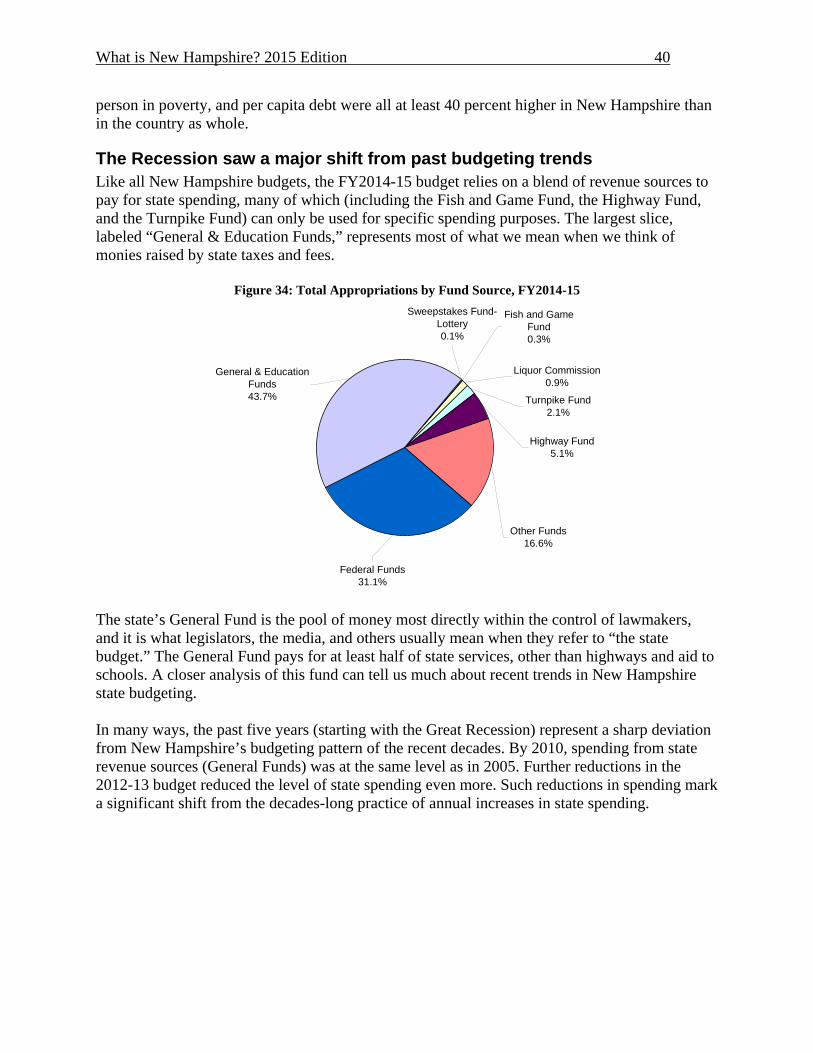
What is New Hampshire? 2015 Edition 40
person in poverty, and per capita debt were all at least 40 percent higher in New Hampshire than in the country as whole.
The Recession saw a major shift from past budgeting trends Like all New Hampshire budgets, the FY2014-15 budget relies on a blend of revenue sources to pay for state spending, many of which (including the Fish and Game Fund, the Highway Fund, and the Turnpike Fund) can only be used for specific spending purposes. The largest slice, labeled “General & Education Funds,” represents most of what we mean when we think of monies raised by state taxes and fees.
Figure 34: Total Appropriations by Fund Source, FY2014-15
The state’s General Fund is the pool of money most directly within the control of lawmakers, and it is what legislators, the media, and others usually mean when they refer to “the state budget.” The General Fund pays for at least half of state services, other than highways and aid to schools. A closer analysis of this fund can tell us much about recent trends in New Hampshire state budgeting. In many ways, the past five years (starting with the Great Recession) represent a sharp deviation from New Hampshire’s budgeting pattern of the recent decades. By 2010, spending from state revenue sources (General Funds) was at the same level as in 2005. Further reductions in the 2012-13 budget reduced the level of state spending even more. Such reductions in spending mark a significant shift from the decades-long practice of annual increases in state spending.
Turnpike Fund2.1%
Fish and Game Fund0.3%
Sweepstakes Fund-Lottery0.1%
Liquor Commission0.9%
Highway Fund5.1%
Other Funds16.6%
General & Education Funds43.7%
Federal Funds31.1%
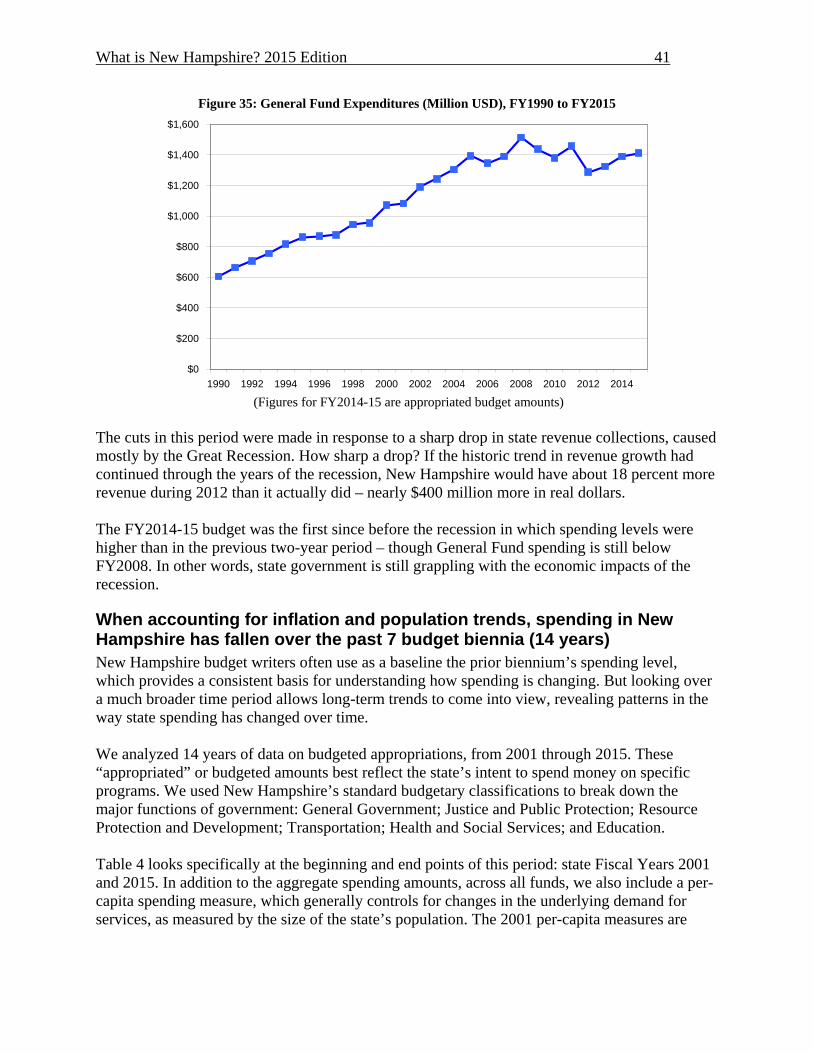
What is New Hampshire? 2015 Edition 41
Figure 35: General Fund Expenditures (Million USD), FY1990 to FY2015
(Figures for FY2014-15 are appropriated budget amounts)
The cuts in this period were made in response to a sharp drop in state revenue collections, caused mostly by the Great Recession. How sharp a drop? If the historic trend in revenue growth had continued through the years of the recession, New Hampshire would have about 18 percent more revenue during 2012 than it actually did – nearly $400 million more in real dollars. The FY2014-15 budget was the first since before the recession in which spending levels were higher than in the previous two-year period – though General Fund spending is still below FY2008. In other words, state government is still grappling with the economic impacts of the recession.
When accounting for inflation and population trends, spending in New Hampshire has fallen over the past 7 budget biennia (14 years) New Hampshire budget writers often use as a baseline the prior biennium’s spending level, which provides a consistent basis for understanding how spending is changing. But looking over a much broader time period allows long-term trends to come into view, revealing patterns in the way state spending has changed over time. We analyzed 14 years of data on budgeted appropriations, from 2001 through 2015. These “appropriated” or budgeted amounts best reflect the state’s intent to spend money on specific programs. We used New Hampshire’s standard budgetary classifications to break down the major functions of government: General Government; Justice and Public Protection; Resource Protection and Development; Transportation; Health and Social Services; and Education. Table 4 looks specifically at the beginning and end points of this period: state Fiscal Years 2001 and 2015. In addition to the aggregate spending amounts, across all funds, we also include a per-capita spending measure, which generally controls for changes in the underlying demand for services, as measured by the size of the state’s population. The 2001 per-capita measures are
$0
$200
$400
$600
$800
$1,000
$1,200
$1,400
$1,600
1990 1992 1994 1996 1998 2000 2002 2004 2006 2008 2010 2012 2014

What is New Hampshire? 2015 Edition 42
inflated to 2015 dollars. Finally we include annualized rates of change in both aggregate spending and per-capita spending.
Table 4: Total state spending, 2001 and 2015
Across this time period, total state spending grew at approximately 2.9 percent per year, with the highest rate of growth in the categories of Justice and Public Protection (i.e. corrections and prison spending) and General Administration of state government. Education and Transportation stand out as two areas where aggregate spending grew less quickly (at 1.3 percent and 1.0 percent respectively). But while total spending increased over this period, on a per-capita, inflation-adjusted basis, state spending actually fell slightly between 2001 and 2015 – from $4,134 per-capita in 2001 to $4,107 per-capita in 2015.
Table 5: General Fund Spending, 2001 and 2015
The same analysis of General Fund spending tells a slightly different story. As shown in Table 5, aggregate General Fund spending fell in Resource Protection and Development, and Transportation, while total fund spending in those categories increased. On average, spending from General Funds increased more slowly than for total funds (2.2 percent annual increase vs.
Total Funds
Per Capita
in 2015
Dollars Total Funds
Per Capita
(in 2015
Dollars)
Annual
Change in
Aggregate
Spending
Annual Change
in Per Capita
Spending (Infl.
Adj.)
General Government $290,266,891 $311 $496,813,557 $377 4.6% 1.6%
Admin of Justice and Public Prtn $310,024,229 $333 $589,415,730 $448 5.5% 2.5%
Resource Protection and Development $178,979,974 $192 $270,638,138 $206 3.5% 0.6%
Transportation $489,454,322 $525 $548,529,445 $417 1.0% ‐1.9%
Health and Human Services $1,355,941,373 $1,454 $2,070,088,151 $1,572 3.6% 0.7%
Education $1,230,006,209 $1,319 $1,431,345,606 $1,087 1.3% ‐1.6%
Total $3,854,672,998 $4,134 $5,406,830,627 $4,107 2.9% ‐0.1%
Source: Total Fund Appropriations from HB1
20152001 Change 2001‐2015
Total Funds
Per Capita
in 2015
Dollars Total Funds
Per Capita
(in 2015
Dollars)
Annual
Change in
Aggregate
Spending
Annual
Change in
Per Capita
Spending
(Infl. Adj.)
General Government $226,401,343 $243 $267,399,052 $203 1.4% ‐1.5%
Admin of Justice and Public Prtn $174,330,881 $187 $225,403,305 $171 2.2% ‐0.7%
Resource Protection and Development $38,867,823 $42 $33,444,407 $25 ‐1.2% ‐4.0%
Transportation $2,886,323 $3 $946,709 $1 ‐8.9% ‐11.5%
Health and Human Services $474,234,782 $509 $667,291,437 $507 2.9% 0.0%
Education $176,743,564 $190 $218,296,042 $166 1.8% ‐1.1%
Total $1,093,464,716 $1,173 $1,412,780,952 $1,073 2.2% ‐0.7%
Source: Total Fund Appropriations from HB1
2001 2015 Change 2001‐2015

What is New Hampshire? 2015 Edition 43
2.9 percent), suggesting that spending increases were disproportionately borne by the federal government, the largest source of budget dollars outside of the General Fund.
The search for new revenue sources is a constant pressure Over the last two and a half decades, New Hampshire has relied on fresh sources of revenue to meet growing state budget expenditures. The state General Fund collected just under $600 million in 1988. If taxes and rates that year had remained unchanged, those same sources would have generated $995 million in the year 2013. However, in reality, General Fund revenues were $1.4 billion in 2013. The more than $400 million difference ($1.4 billion minus $995 million) came from new taxes (like the Business Enterprise Tax), increases in tax rates for existing taxes (including increases in the meals and rooms tax and tobacco tax), and non-tax sources such as the tobacco settlement and the Medicaid Enhancement Tax. Almost one third of new revenue growth between 1998 and 2013 came from new taxes, increased tax rates, and/or non-tax sources.
Figure 36: General Fund Revenues by Major Component 1988 Through 2013
The large number of relatively small contributors to total General Fund revenue, with eight individual tax sources each contributing less than 5 percent to the fund, is rather unique to New Hampshire. In many states, the two largest revenue sources (most often a sales tax and an income tax) make up 75 percent to 80 percent of the total.
$0
$200
$400
$600
$800
$1,000
$1,200
$1,400
$1,600
1988
1990
1992
1994
1996
1998
2000
2002
2004
2006
2008
2010
2012
State Fiscal Year
Mil
lio
ns
of
Do
llar
s
Taxes and rates in place in 1988
Medicaid Enhancement New taxesIncreased rates
$995m
$1,414m

What is New Hampshire? 2015 Edition 44
Figure 37: FY2013 General Fund Revenue Sources
The largest contributors to New Hampshire’s General Fund are:
Business profits tax (18.9 percent) Meals and rooms taxes (16.9 percent) Profits from state liquor sales (9.3 percent)
When we take a long-term view of changes in the General Fund relative to overall economic growth in New Hampshire, we see a multi-year decline over the course of the Recession in the portion of the state’s economy that is tapped as revenue for public spending through the General Fund – from nearly 2.5 percent in 2008 to slightly less than 2 percent in 2013.
Figure 38: General Fund Revenue as a Percentage of Gross State Product
Business Profits Tax18.9%
Communications Tax4.0%
Beer Tax0.9%
Meals and Rooms Tax16.9%
Liquor Sales9.3%
Tobacco Tax8.7%
Interest & Dividends Tax
6.5%
Business Enterprise Tax
5.5%
"Medicaid Enhancement"
Revenue5.4%
Other Revenues5.2%
Real Estate Transfer Tax
4.4%
Securities Revenue2.7%
Board and Care Revenue
1.9%
Tobacco Settlemen1.6%
Utilities Tax0.4%
Court Fines & Fees0.9%
Insurance Tax6.7%
0.00%
0.50%
1.00%
1.50%
2.00%
2.50%
3.00%
3.50%
4.00%
1988
1990
1992
1994
1996
1998
2000
2002
2004
2006
2008
2010
2012

What is New Hampshire? 2015 Edition 45
Social services spending remains the primary driver of state spending By dividing spending into the major categories (as defined by state budget writers), we get a big-picture view of how New Hampshire spends public dollars.
Figure 39: State Appropriations by Category, 2014-15 (all fund sources)
The diagram makes clear that most state spending is in the role of provider of social services to the public. We also see the large role that education plays in the expenditure of public dollars; this covers both the K-12 system, as well as the university and community college systems. By analyzing this division of state spending across categories of government over a longer time span, we can see broader trends and patterns in the way spending has changed27. For instance, the Figure below shows the distribution of state spending along the same broad categories of government in 1982, more than 30 years ago.28 While direct comparisons of spending are difficult, you can see that spending on Health & Social Services, Education, and Justice and Public Protection have grown as a share of total state spending, while Transportation saw the biggest decline, falling from 19 percent of total state spending in 1982 to 10 percent in the current budget. Spending on Health and Human Services, by contrast, grew from 31 percent to 39 percent of total state spending since 1982.
27 A completely apples-to-apples comparison of 1982 to 2012 is difficult because programs and responsibilities shift between the major functions of state government. The classifications of funds often change over time as well, making a true apples-to-apples comparison difficult. But in general, the data provide a broad picture of shifts in state spending by major function over this span and illustrate the larger role that health and other social programs play in New Hampshire’s budget compared to 30 years ago. 28 Data for 1982 comes from ‘1982 Operating Budget N.H. Laws of 1981, Chapter 568’. Director of Legislative Services, Concord, NH, 1981. Data for 2014 comes from HB1 for 2014-2015 as published by the Legislative Budget Office. http://www.gencourt.state.nh.us/legislation/2013/HB0001.pdf
Justice & PublicProtection
11%
Education26%
Health & SocialServices
39% Resource Protection & Development
5%
General Government 9%
Transportation 10%

What is New Hampshire? 2015 Edition 46
Figure 40: State Spending by Category, 1982 (all fund sources)
State revenues unlikely to meet future demand given existing service levels and historic growth The Center developed a forecast for state revenue through 2023 (Table 6), assuming that per-unit taxes keep their rates unchanged, while other tax revenues increase at the assumed future rate of growth of the economy (4.2 percent per year).29 Our simulation suggests that the state will see natural revenue growth of 2.8 percent per year.
Table 6: 2023 New Hampshire Tax Revenue by Type30
29 This is equal to the most recent economic growth forecast from the Congressional Budget Office: “The Budget and Economic Outlook: 2014 to 2024,” Congressional Budget Office, February 2014 30 Per unit revenues come from taxes on quantity, like the beer tax, whose rate has remained unchanged for decades. Other per unit taxes, like the cigarette tax, have seen ever higher rates, and are included in the “Per unit changed” revenue type. Ad Valorem revenues come from taxes on value. Stable Ad Valorem revenues keep pace with overall economic growth, and include the meals and rooms tax. Unstable Ad Valorem revenues include the Interest and Dividend tax, the Real Estate Transfer Tax and Business Taxes, which can vary significantly relative to prevailing economic conditions.
Resource Protection & Development
3%
General Government
15%
Transportation19%
Justice & Public Protection
8%
Education24%
Health and Social Services
31%
Potential Revenue in10 years
4.2% AnnualNH Revenue Type 2013 Share 2023 GrowthPer Unit Unchanged $853.402 38.9% $853.4 0.0%Per Unit Changed $205.900 9.4% $310.7 4.2%Ad Valorem Stable $464.348 21.2% $700.7 4.2%Ad Valorem Unstable $738.174 33.7% $1,113.9 4.2%
$2,261.824 $2,978.7 2.8%

What is New Hampshire? 2015 Edition 47
What does this mean? Without either changes to the state’s revenue structure, a return to historic economic growth, or a significant decrease in spending growth, state budget writers will likely face unbalanced budgets in coming budget cycles. As an example, Table 7 shows what would happen if total expenditures grew at their historic rate (4.2 percent per year) and revenues grew “naturally” – that is, without any adjustments in rates or new taxes. Under these assumptions, over the next ten years, one could expect a significant budget deficit, as much as $450 million, by 2023.
Table 7: Alternative - Deficit Assuming Historical Growth
Of course, future predictions like this require assumptions and come with great uncertainty. State policymakers have made adjustments to both spending and revenue in order to solve budget issues in the past. Policymakers will likely have to rely on a mix of approaches – changes in taxation and spending – in order to maintain services demanded by the public. Looking ahead Balancing a budget is relatively straightforward at the state level, as state spending is required to equal revenues. The challenges (and, occasionally, opportunities) come when there is an imbalance – that is, when revenues grow more slowly than spending, or vice versa. State revenues are unlikely to grow at levels sufficient to meet existing demands, creating a continuing conversation about the level of state spending. Additional Resources
Understanding Changes in the House’s FY16/17 budget” April, 2015. http://www.nhpolicy.org/report/policy-note-understanding-changes-in-the-houseamp39s-fy1617-budget
“Looking Down the Fiscal Road: NH’s Long Term Finances, January 2015 http://www.nhpolicy.org/report/looking-down-the-fiscal-road-nhamp39s-long-term-finances.
“State Revenue Forecast, 2014-15” January 2013. http://www.nhpolicy.org/report/policy-note-state-revenue-forecast-2014-2015
“Turbulent Times: New Hampshire’s State Budget, 2008 to 2013,” NHCPPS, May 2013. http://www.nhpolicy.org/report/turbulent-times-nhamp39s-state-budget-2008-to-2013
“Counting on the Future: New Hampshire’s State Revenue Estimates,” NHCPPS, May 2011. http://www.nhpolicy.org/report/counting-on-the-future-new-hampshireamp39s-state-revenue-estimates
2013 2023NH Revenue $2,261.824 $2,895.3 2.5%NH Expenditures $2,216.159 $3,344.1 4.2%
2023 Surplus/(Deficit) ($448.77)

What is New Hampshire? 2015 Edition 48
New Hampshire’s Infrastructure Infrastructure is key to the well-being of any society, allowing smooth transit, healthy living, and a quality of life where the economy grows, so it is no small surprise that infrastructure investment continues to be a primary public policy conversation. And the state has many different tools at its disposal to support infrastructure development. The gas tax is used to fund the road infrastructure, the state has a revolving loan fund to support water infrastructure, and the state’s school building aid program has been used to upgrade, and construct new, schools. How should state and local policy makers prioritize capital investment in water versus other infrastructure needs? The first step would be to get a better understanding of how the capital needs vary. Yet there is no source of information on the ‘age of plant’ of each of NH’s major infrastructures. To begin to develop a set of tools to help policy makers understand the relative health of the state’s varied infrastructure, the Center developed national rankings on a series of indicators, including transportation infrastructure, drinking water and wastewater facilities, and communications infrastructure. Indicators used to rank New Hampshire relative to the nation and to certain economic competitor states were developed as part of work the Center conducted with the Business and Industry Association.31 The indicators are: Transportation energy expenditures as percent of personal income, 2011 – A measure of all transportation sector primary energy expenditures, divided by total state personal income.32 States are ranked from lower to higher values. Percent of bridges rated “deficient” or “obsolete,” 2010 – Percent of state bridges classified as “structurally deficient” (i.e. bridge’s condition contains at least one significant defect) or “functionally obsolete” (i.e. bridge was built to standards no longer in effect or its design is not suitable for its current use).33 States are ranked from lower to higher values. Portion of unacceptable rough roads, 2009 – Percent of state road miles classified as unacceptably rough according to grading by International Roughness Index. Road miles include interstates, other principal arterials, rural minor arterials, and roads in the National Highway System.34 States are ranked from lower to higher values. Percent of state with access to broadband – Percent of state residents with access to broadband speeds of 3mbps for downloads and 768 kbps for uploads.35
31 The following is excerpted in part from: “New Hampshire’s Economic Climate: Key Indicators,” NHCPPS, October 2013. http://www.nhpolicy.org/report/new-hampshireamp39s-economic-climate-key-indicators 32 U.S. Energy Information Administration; U.S. Bureau of Economic Analysis http://www.eia.gov/state/seds/data.cfm?incfile=/state/seds/sep_sum/html/sum_ex_tra.html&sid=US 33 American Society of Civil Engineers; Federal Highway Administration, National Bridge Inventory 34 Federal Highway Administration, Highway Statistics 2009: http://www.bts.gov/publications/state_transportation_statistics/state_transportation_statistics_2011/index.html 35 U.S. Census Bureau; Federal Communications Commission

What is New Hampshire? 2015 Edition 49
Water infrastructure needs per capita – 20-year capital investment needs for public and community drinking water, wastewater and storm water systems, on a per capita basis.36 States are ranked from lower to higher values. Table 8 below shows the values for each of the indicators for the four Northern New England States as well as some of the key competitors for what has been a cornerstone of NH’s economy, advanced high tech manufacturing industry.
Table 8: Infrastructure state indicators
In what follows, we take a more in depth look at New Hampshire’s school, Internet, water, bridge, and road infrastructures to highlight key areas of difficulty and opportunity as New Hampshire grows to meet 21st century needs. Aging school buildings require refurbishment Though student enrollment has declined in recent years, New Hampshire’s 487 public primary and secondary schools still require ongoing maintenance and refurbishment. According to the American Society of Civil Engineers 2011 Report Card for New Hampshire’s Infrastructure, 78% of these schools have at least one unsatisfactory environmental condition (e.g. heating and ventilation) and 59% have at least one inadequate building feature (e.g. roof, floor, windows, doors, plumbing, heating). Replacement or extensive repair is required in 39% of school buildings. State reports from the American Society of Civil Engineers are not universally conducted in the same year, so perfect comparisons to these metrics in other states are not possible.
36 American Society of Civil Engineers, 2013 Report Card for America's Infrastructure; Environmental Protection Agency, 2007 Drinking Water Infrastructure Needs Survey and Assessment, and 2008 Clean Watershed Needs Survey
State Indicator
Transportation energy
expenditures as percent of
personal income
Percent of bridges
deficient or obsolete
Portion of unacceptable
rough roads
Percent of state with access to
broadband speeds of 3mbps for
downloads and 768 kbps for
uploads.
Water infrastructure
needs per capita
New Hampshire 4.7% 31.0 21.7 98.1% $1,554.92
Maine 6.6% 32.2 25.4 98.1% $1,159.32Massachusetts 3.5% 49.8 13.7 99.9% $2,260.36Vermont 5.6% 31.7 35.8 93.1% $1,072.33
North Carolina 5.6% 27.5 7.1 97.8% $1,740.87South Carolina 7.5% 21.6 13.2 97.3% $468.29Texas 6.8% 17.8 7.4 98.4% $1,491.32Virginia 5.2% 25.4 4.7 96.0% $1,624.79

What is New Hampshire? 2015 Edition 50
Figure 41: Per Pupil Primary and Secondary School Infrastructure Outlay for FY2013
Source: U.S. Census Bureau (Construction, Land and Existing Structures, and Equipment Spending)
New Hampshire is ranked low among the fifty states in terms of per pupil infrastructure spending. Infrastructure spending for FY2013 was calculated as the sum of new construction, building and grounds maintenance, and equipment purchases for public schools in each state. Despite having the nation’s fourth lowest amount, $390 spent on school infrastructure per-pupil in FY2013, New Hampshire still has the fourth highest level of school infrastructure funding per pupil in New England. Maine and Rhode Island have the third and second lowest levels of school infrastructure outlay respectively. This variation is likely driven by a number of different factors. School building consolidation, varying material and labor costs for construction, varying maintenance costs, and increased or decreased past infrastructure spending may all be reasons for variation in current spending levels beyond the ideological ranking of school infrastructure spending within fiscal constraints. Household internet access is widespread yet incomplete for some rural areas New Hampshire trails the New England average for broadband, or high-speed (25 Mbps+), household Internet access, though it stays in line with national trends. Household Internet access is defined as current usage of the Internet at home and not the availability to households of Internet access to purchase. New Hampshire has the twenty-fifth highest level of broadband household Internet access in the nation.
New Hampshire, $390
$0
$200
$400
$600
$800
$1,000
$1,200
$1,400
$1,600
$1,800
$2,000
$2,200
$2,400
$2,600
Idah
oR
hode
Isla
ndM
aine
New
Ham
pshi
reN
orth
Car
olin
aN
evad
aA
rizon
aF
lorid
aT
enne
ssee
Mis
siss
ippi
Ore
gon
Wis
cons
inM
ichi
gan
Ver
mon
tN
ew J
erse
yM
onta
naH
awai
iO
klah
oma
Indi
ana
Pen
nsyl
vani
aV
irgin
iaA
laba
ma
Col
orad
oC
onne
ctic
utLo
uisi
ana
Mis
sour
iIll
inoi
sG
eorg
iaN
ebra
ska
Cal
iforn
iaW
est V
irgin
iaK
entu
cky
Ark
ansa
sM
aryl
and
Uta
hS
outh
Car
olin
aO
hio
Min
neso
taD
elaw
are
Kan
sas
Mas
sach
uset
tsW
ashi
ngto
nS
outh
Dak
ota
Tex
asN
ew Y
ork
New
Mex
ico
Iow
aA
lask
aN
orth
Dak
ota
Wyo
min
g

What is New Hampshire? 2015 Edition 51
Figure 42: Percent of Population without Household Broadband Internet Access by Region, 2010
Source: U.S. Census Bureau
Broadband household Internet access is highest in New Hampshire’s more urbanized and suburban counties near the Massachusetts border and declines as one moves north. Belknap County proves an exception to this trend, however, with fully 77% of households in the 2010 U.S. Census lacking access to broadband Internet at their residences.
Figure 43: Percent of Population with Broadband Household Internet Access by County, 2015
Source: U.S. Census Bureau, Federal Communications Commission
24%
17%
24%
0%
5%
10%
15%
20%
25%
30%
United States New England New Hampshire

What is New Hampshire? 2015 Edition 52
Though high-speed household Internet access is far from universal, this is not equivalent to either a lack of available broadband Internet service at home or a lack of access to high-speed Internet service for residents outside their homes in public places such as libraries and schools.
New Hampshire is a relatively “low-use” state for water On a per capita basis, use of water in New Hampshire is relatively low. New Hampshire’s relatively limited water use is a function of the fact that our economy does not rely extensively on water-intensive industry, nor do we have significant levels of agricultural use, which drive demand in much of the rest of the country.
Figure 44: Total Water Use Per Capita in Gallons/Day by State, 2010
Source: USGS, Estimated Use of Water in the United States in 2010
And demand pressure on New Hampshire’s public and private drinking water systems has declined on an average per capita basis over the past 30 years. In addition, peak use has remained relatively stable, though in the most recent 10 year period (2002 –2012) total pumpage has declined slightly in the major public water supply systems. Estimating future demand by state residents is complicated by the uncertainty regarding industrial use trends, state population projections, and the utilization of new efficiency technologies. Between 1970 and 2000, the population in New Hampshire nearly doubled. But during that same period (and since) residential water use per capita has declined. At the same time, the decline of water-intensive industry in New Hampshire has meant even lower use of available resources. While domestic pressure on the state’s water system is likely to increase only slightly, and few water systems have been forced to implement water control initiatives, peak monthly demand has
New Hampshire, 917 Gallons/Day
0
2,000
4,000
6,000
8,000
10,000
12,000
Mai
neR
hode
Isla
ndM
assa
chus
etts
Geo
rgia
New
Yor
kP
enns
ylva
nia
New
Jer
sey
Ver
mon
tM
inne
sota
Was
hing
ton
Sou
th D
akot
aF
lorid
aD
elaw
are
Ohi
oO
klah
oma
New
Ham
pshi
reC
onne
ctic
utH
awai
iA
rizon
aV
irgin
iaN
evad
aT
exas
Ken
tuck
yIo
wa
Cal
iforn
iaIll
inoi
sW
isco
nsin
Mic
higa
nT
enne
ssee
Mar
ylan
dN
orth
Car
olin
aM
issi
ssip
piIn
dian
aK
ansa
sM
isso
uri
Sou
th C
arol
ina
New
Mex
ico
Ala
ska
Uta
hO
rego
nLo
uisi
ana
Nor
th D
akot
aW
est V
irgin
iaA
laba
ma
Col
orad
oA
rkan
sas
Neb
rask
aM
onta
naW
yom
ing
Idah
o

What is New Hampshire? 2015 Edition 53
seen an increase during the summer months. While on average the peak demand has remained relatively constant, the three highest demand months since 2000 have occurred in the past four years. Future investment needs for public water systems are significant The American Society of Civil Engineers, in its 2013 “Report Card for America’s Infrastructure,” estimated the investment needed in drinking water and wastewater systems in each state over the next two decades. The table below takes those estimates and calculates the needed investment on a per-capita basis for New Hampshire, other Northern New England states, and a handful of other states identified as economic competitor states by the New Hampshire Business and Industry Association. As it shows, New Hampshire is in the middle of the pack when it comes to per-capita water system needs in the next two decades.
Table 9: Estimated investment needs of water systems in selected states, including New Hampshire, over the next two decades.
There is significant variation in what consumers in New Hampshire pay for water, as well as significant investment requirements for water infrastructure due to age of facilities. If consumer use continues to decline, and fixed costs remain the same, the price of water to consumers and local tax payers will increase. Future costs of the water infrastructure are not built into rates in most communities, as currently structured. With declining state aid to municipalities and increasing demand for other services, the implications for rate payers and local property tax payers could be significant.
Nearly one-third of New Hampshire’s bridges are deficient New Hampshire’s deficient bridges, meaning those classified as structurally deficient or functionally obsolete, account for 31% of bridges in the state, a number seven points higher than
20 year water infrastructure needs (in millions of $)
StateDrinking water
(in millions)Waste water (in millions)
Total water infrastructure
needs (in millions)2010
population
Water infrastructure
needs per capita
NH $847 $1,200 $2,047 1,316,470 $1,555Mass $6,800 $8,000 $14,800 6,547,629 $2,260VT $453 $218 $671 625,741 $1,072Maine $540 $1,000 $1,540 1,328,361 $1,159
Texas $26,000 $11,500 $37,500 25,145,561 $1,491NC $10,000 $6,600 $16,600 9,535,483 $1,741SC $1,600 $566 $2,166 4,625,364 $468Virginia $6,100 $6,900 $13,000 8,001,024 $1,625Colo $6,400 $1,500 $7,900 5,029,196 $1,571
Source: ASCE 2013 Report Card for America's Infrastructure

What is New Hampshire? 2015 Edition 54
Figure 45: Percent of Deficient Bridges by State, 2014
Source: U.S. Department of Transportation, Federal Highway Administration
the national average. While structural deficiency means that a bridge may require specific monitoring, inspection, and maintenance to remain safe, functionally obsolete bridges are bridges not built to current standards, meaning they may have inadequate lane and shoulder widths, insufficient vertical clearances, and be subject to occasional flooding. Over 50% of New Hampshire’s bridges are over 50 years old, and 23% of these 50-plus year old bridges are structurally deficient and 23% are functionally obsolete. 78% of structurally deficient bridges and 65% of functionally obsolete bridges are over 50 years old. The U.S. Department of Transportation estimates the cost to rehabilitate New Hampshire’s structurally deficient bridges at approximately $174 million and the cost to replace New Hampshire’s structurally deficient bridges at approximately $256 million, or $131 and $193 per capita respectively.
A majority of New Hampshire’s roads are in poor or mediocre condition Compared to a national average of 32%, 54% of New Hampshire’s roads are in poor or mediocre condition, costing New Hampshire motorists approximately $259 each per year in additional repairs and operating costs, according to the American Society of Civil Engineers. Road condition ratings are derived from the International Roughness Index and Present Serviceability rating. The International Roughness Index measures the vertical movement of a vehicle on a road, or the road’s “bumpiness,” and the Present Serviceability Index is based on observations of ride quality from tests conducted over the road in question.
New Hampshire, …
0%
5%
10%
15%
20%
25%
30%
35%
40%
45%
50%
55%
60%
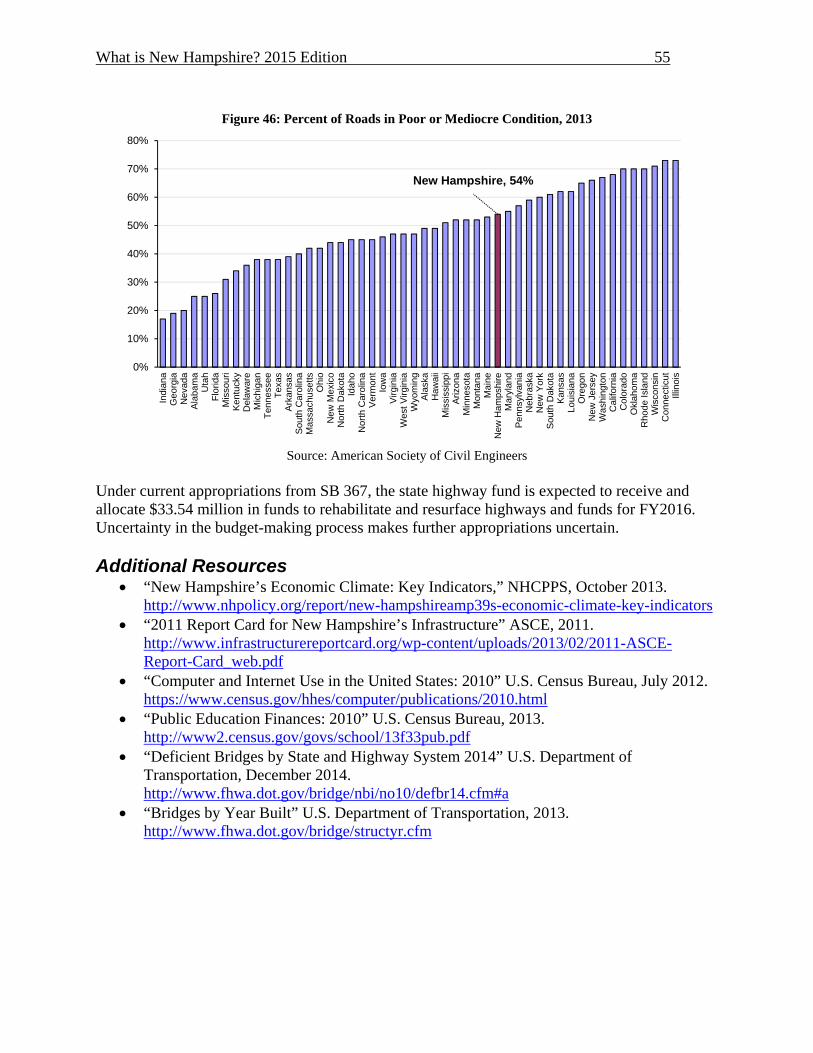
What is New Hampshire? 2015 Edition 55
Figure 46: Percent of Roads in Poor or Mediocre Condition, 2013
Source: American Society of Civil Engineers
Under current appropriations from SB 367, the state highway fund is expected to receive and allocate $33.54 million in funds to rehabilitate and resurface highways and funds for FY2016. Uncertainty in the budget-making process makes further appropriations uncertain. Additional Resources
“New Hampshire’s Economic Climate: Key Indicators,” NHCPPS, October 2013. http://www.nhpolicy.org/report/new-hampshireamp39s-economic-climate-key-indicators
“2011 Report Card for New Hampshire’s Infrastructure” ASCE, 2011. http://www.infrastructurereportcard.org/wp-content/uploads/2013/02/2011-ASCE-Report-Card_web.pdf
“Computer and Internet Use in the United States: 2010” U.S. Census Bureau, July 2012. https://www.census.gov/hhes/computer/publications/2010.html
“Public Education Finances: 2010” U.S. Census Bureau, 2013. http://www2.census.gov/govs/school/13f33pub.pdf
“Deficient Bridges by State and Highway System 2014” U.S. Department of Transportation, December 2014. http://www.fhwa.dot.gov/bridge/nbi/no10/defbr14.cfm#a
“Bridges by Year Built” U.S. Department of Transportation, 2013. http://www.fhwa.dot.gov/bridge/structyr.cfm
New Hampshire, 54%
0%
10%
20%
30%
40%
50%
60%
70%
80%
Indi
ana
Geo
rgia
Nev
ada
Ala
bam
aU
tah
Flo
rida
Mis
sour
iK
entu
cky
Del
awar
eM
ichi
gan
Ten
ness
eeT
exas
Ark
ansa
sS
outh
Car
olin
aM
assa
chus
etts
Ohi
oN
ew M
exic
oN
orth
Dak
ota
Idah
oN
orth
Car
olin
aV
erm
ont
Iow
aV
irgin
iaW
est V
irgin
iaW
yom
ing
Ala
ska
Haw
aii
Mis
siss
ippi
Ariz
ona
Min
neso
taM
onta
naM
aine
New
Ham
pshi
reM
aryl
and
Pen
nsyl
vani
aN
ebra
ska
New
Yor
kS
outh
Dak
ota
Kan
sas
Loui
sian
aO
rego
nN
ew J
erse
yW
ashi
ngto
nC
alifo
rnia
Col
orad
oO
klah
oma
Rho
de Is
land
Wis
cons
inC
onne
ctic
utIll
inoi
s

What is New Hampshire? 2015 Edition 56
Energy in New Hampshire
New Hampshire is a high-cost, low-use state when it comes to energy New Hampshire has among the highest retail electricity rates in the nation. States with high energy costs, like New Hampshire and the other Northeastern states, tend to also have low energy consumption (as measured by energy consumption per dollar of state gross domestic product) as shown on the following charts. States with lower energy prices, including net energy exporting states like North Dakota and Wyoming, tend to consume more energy per dollar of economic activity. New Hampshire was the ninth lowest per capita consumer of energy among the states in 2011. This is due in part to the state’s relatively low proportion of energy-intensive heavy industry. In 2013, the industrial sector represented only 13 percent of energy use in the state as shown in the following chart.
Figure 47: New Hampshire's Energy Use by Sector, 2013
Source: U.S. Department of Energy Information Administration
Unlike some other parts of the country, New Hampshire has no in-state sources of fossil fuels or uranium. Thus, to meet the energy needs of state businesses and residents, most energy must be imported. In 2012, New Hampshire had to import 90 percent of energy used. With such a large percentage of the state’s energy resources met through imported sources, the state’s energy supply is vulnerable to disruptions from weather, price volatility, changing dynamics in the commodities market, political unrest, and other factors beyond our control.
An emphasis on “clean” energy is shifting New Hampshire’s energy mix New Hampshire is second only to Maine in the percentage of forested land. Forest products, including wood pellets for space heating, are an important part of the state economy and the
Residential, 31%
Commercial, 23%Industrial, 13%
Transportation, 33%

What is New Hampshire? 2015 Edition 57
mainstay of New Hampshire's biomass energy industry. Nearly 1 in 12 households depends on wood products as the primary heat source.37 Over five decades, the energy consumption mix in New Hampshire has changed in response to policies aimed at reducing carbon emissions. Most recently, New Hampshire has decreased its dependence on coal and distillate fuel oil, and is relying more on natural gas and nuclear electric power.
Figure 48: New Hampshire's Energy Consumption by Fuel Type, 1960 to 2013 (Millions of BTU)
Source: U.S. Department of Energy Information Administration
Energy costs remain a drag on New Hampshire’s economy Numerous rankings that stack New Hampshire against other states have noted our relatively high prices for industrial electricity and natural gas. This is an especially critical issue for businesses and the state economy, as low state energy costs can offer a significant competitive edge against other locations. The following table compares New Hampshire with our New England neighbor states across several measures of different prices of energy within New Hampshire, the level of consumption of energy, total expenditures associated with energy use, and energy efficiency efforts in the state.
37 U.S. Energy Information Administration, May 2015, http://www.eia.gov/state/analysis.cfm?sid=NH
0
50000
100000
150000
200000
250000
300000
350000
400000
450000
1960
1961
1962
1963
1964
1965
1966
1967
1968
1969
1970
1971
1972
1973
1974
1975
1976
1977
1978
1979
1980
1981
1982
1983
1984
1985
1986
1987
1988
1989
1990
1991
1992
1993
1994
1995
1996
1997
1998
1999
2000
2001
2002
2003
2004
2005
2006
2007
2008
2009
2010
2011
2012
2013
Biomass Hydroelectric Power Nuclear Electric Power Other PetroleumResidual Fuel Oil Motor Gasoline LPG Jet FuelDistillate Fuel Oil Natural Gas Coal
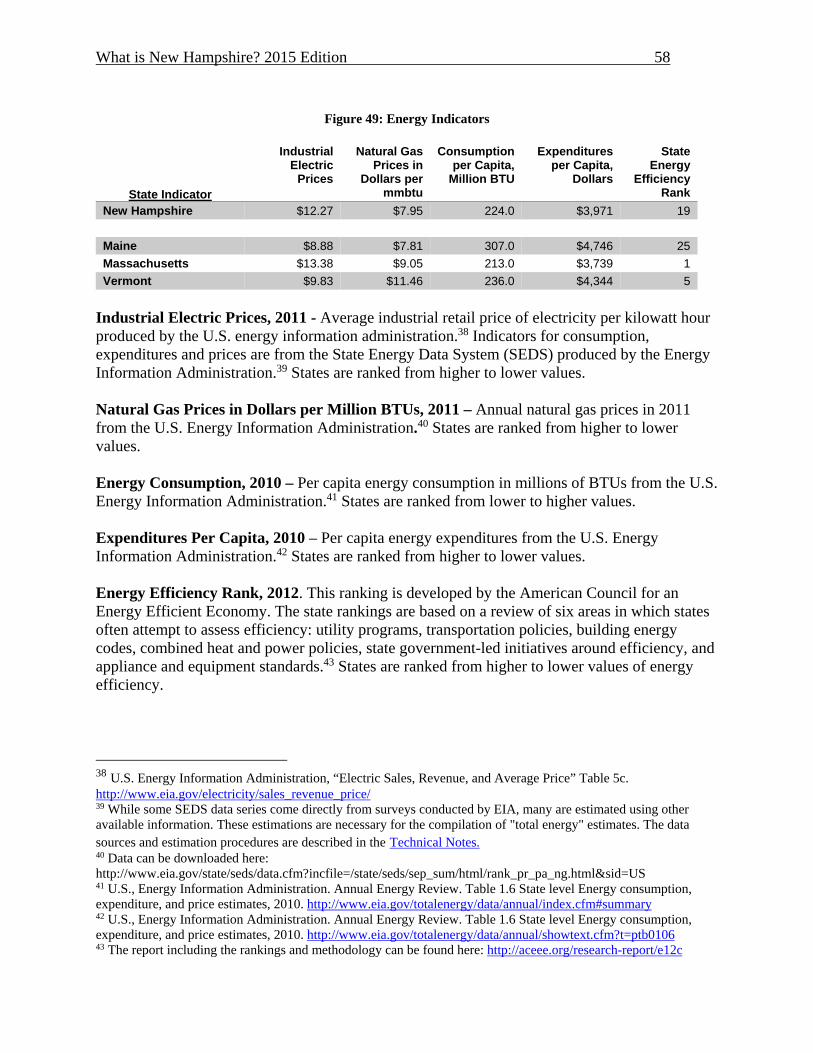
What is New Hampshire? 2015 Edition 58
Figure 49: Energy Indicators
State Indicator
Industrial Electric
Prices
Natural Gas Prices in
Dollars per mmbtu
Consumption per Capita,
Million BTU
Expenditures per Capita,
Dollars
State Energy
Efficiency Rank
New Hampshire $12.27 $7.95 224.0 $3,971 19
Maine $8.88 $7.81 307.0 $4,746 25
Massachusetts $13.38 $9.05 213.0 $3,739 1
Vermont $9.83 $11.46 236.0 $4,344 5
Industrial Electric Prices, 2011 - Average industrial retail price of electricity per kilowatt hour produced by the U.S. energy information administration.38 Indicators for consumption, expenditures and prices are from the State Energy Data System (SEDS) produced by the Energy Information Administration.39 States are ranked from higher to lower values. Natural Gas Prices in Dollars per Million BTUs, 2011 – Annual natural gas prices in 2011 from the U.S. Energy Information Administration.40 States are ranked from higher to lower values. Energy Consumption, 2010 – Per capita energy consumption in millions of BTUs from the U.S. Energy Information Administration.41 States are ranked from lower to higher values. Expenditures Per Capita, 2010 – Per capita energy expenditures from the U.S. Energy Information Administration.42 States are ranked from higher to lower values. Energy Efficiency Rank, 2012. This ranking is developed by the American Council for an Energy Efficient Economy. The state rankings are based on a review of six areas in which states often attempt to assess efficiency: utility programs, transportation policies, building energy codes, combined heat and power policies, state government-led initiatives around efficiency, and appliance and equipment standards.43 States are ranked from higher to lower values of energy efficiency.
38 U.S. Energy Information Administration, “Electric Sales, Revenue, and Average Price” Table 5c. http://www.eia.gov/electricity/sales_revenue_price/ 39 While some SEDS data series come directly from surveys conducted by EIA, many are estimated using other available information. These estimations are necessary for the compilation of "total energy" estimates. The data sources and estimation procedures are described in the Technical Notes. 40 Data can be downloaded here: http://www.eia.gov/state/seds/data.cfm?incfile=/state/seds/sep_sum/html/rank_pr_pa_ng.html&sid=US 41 U.S., Energy Information Administration. Annual Energy Review. Table 1.6 State level Energy consumption, expenditure, and price estimates, 2010. http://www.eia.gov/totalenergy/data/annual/index.cfm#summary 42 U.S., Energy Information Administration. Annual Energy Review. Table 1.6 State level Energy consumption, expenditure, and price estimates, 2010. http://www.eia.gov/totalenergy/data/annual/showtext.cfm?t=ptb0106 43 The report including the rankings and methodology can be found here: http://aceee.org/research-report/e12c
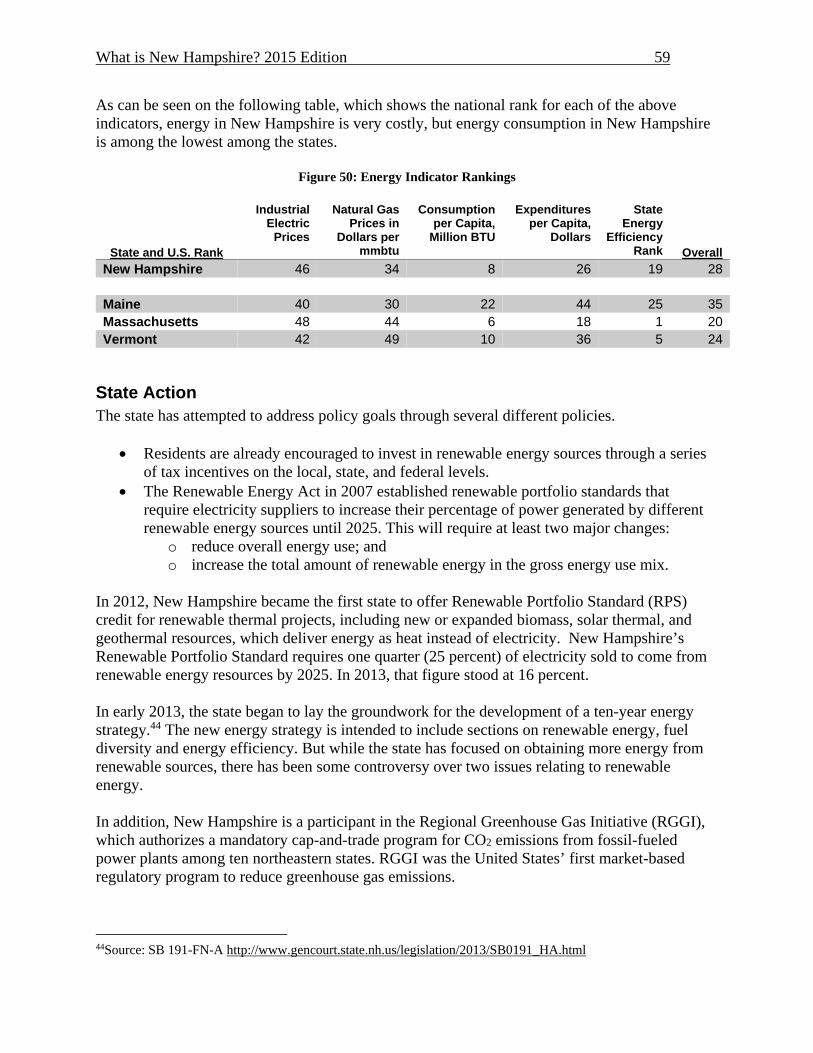
What is New Hampshire? 2015 Edition 59
As can be seen on the following table, which shows the national rank for each of the above indicators, energy in New Hampshire is very costly, but energy consumption in New Hampshire is among the lowest among the states.
Figure 50: Energy Indicator Rankings
State and U.S. Rank
Industrial Electric
Prices
Natural Gas Prices in
Dollars per mmbtu
Consumption per Capita,
Million BTU
Expenditures per Capita,
Dollars
State Energy
Efficiency Rank Overall
New Hampshire 46 34 8 26 19 28 Maine 40 30 22 44 25 35Massachusetts 48 44 6 18 1 20Vermont 42 49 10 36 5 24
State Action The state has attempted to address policy goals through several different policies.
Residents are already encouraged to invest in renewable energy sources through a series of tax incentives on the local, state, and federal levels.
The Renewable Energy Act in 2007 established renewable portfolio standards that require electricity suppliers to increase their percentage of power generated by different renewable energy sources until 2025. This will require at least two major changes:
o reduce overall energy use; and o increase the total amount of renewable energy in the gross energy use mix.
In 2012, New Hampshire became the first state to offer Renewable Portfolio Standard (RPS) credit for renewable thermal projects, including new or expanded biomass, solar thermal, and geothermal resources, which deliver energy as heat instead of electricity. New Hampshire’s Renewable Portfolio Standard requires one quarter (25 percent) of electricity sold to come from renewable energy resources by 2025. In 2013, that figure stood at 16 percent. In early 2013, the state began to lay the groundwork for the development of a ten-year energy strategy.44 The new energy strategy is intended to include sections on renewable energy, fuel diversity and energy efficiency. But while the state has focused on obtaining more energy from renewable sources, there has been some controversy over two issues relating to renewable energy. In addition, New Hampshire is a participant in the Regional Greenhouse Gas Initiative (RGGI), which authorizes a mandatory cap-and-trade program for CO2 emissions from fossil-fueled power plants among ten northeastern states. RGGI was the United States’ first market-based regulatory program to reduce greenhouse gas emissions.
44Source: SB 191-FN-A http://www.gencourt.state.nh.us/legislation/2013/SB0191_HA.html

What is New Hampshire? 2015 Edition 60
New Hampshire had been receiving between $3 million and $4 million per quarter from the RGGI auctions, an amount determined by the auction price of carbon in the RGGI market. As of June 2015 New Hampshire received a total of over $80 million. The auction proceeds are funneled towards projects aimed at improving energy efficiency or reducing demand. These projects can engage non-profits, utilities, businesses, residents, municipalities, universities, and schools to reduce emissions and increase energy education efforts. Critics of the RGGI point to New Jersey dropping out of the agreement in 2011 as a sign that the RGGI compact would soon dissolve. However, the RGGI price to emit carbon dioxide in the Northeast rose by a third after the region’s cap-and-trade program revised its rules to cut the supply of permits in early 2014, breathing new life into the program.
Looking ahead
New Sources: Northern Pass and a new pipeline? The Northern Pass, a proposed project to build power lines transmitting energy from hydroelectric plants in Canada to a converter terminal and substation in Central New Hampshire, has encountered heavy opposition from groups who see the lines as harmful to New Hampshire’s environment and natural beauty. Others worry that private land could be seized under eminent domain. In July of 2015, the U.S. Department of Energy issued its draft Environmental Impact Statement (EIS) on the Northern Pass project. The EIS noted that the proposed project of mostly overhead transmission lines would be the cheapest alternative at roughly $1 billion, but would also have the greatest environmental and visual impact. Burying the transmission lines would double the cost of the project to $2 billion, but would reduce the potential negative impacts on the environment and tourism. The public has 90 days to comment on the draft report before the DOE issues its final report. Efforts at expanding the natural gas capacity in New Hampshire have been met with serious local concern. Kinder Morgan has proposed a multi-billion natural gas pipeline that would enter western Massachusetts and traverse through 13 New Hampshire communities, but has seen local opposition to their proposal in both states.
Addressing the supply and demand of energy remains a challenge But what are the state’s goals in energy policy? If we want lower costs, New Hampshire clearly has a long way to go. Every current public policy effort is steering markets away from oil and coal, and focusing on energy independence and a green(er) economy rather than on the cost of energy. This policy focus is exemplified in the Renewable Portfolio Standard, which requires electricity providers to meet customer load through renewable energy sources. The Independent System Operator for New England (ISO-NE) has noted that the existing natural gas pipeline system in New England is reaching maximum capacity more often, especially in

What is New Hampshire? 2015 Edition 61
winter.45 ISO-NE believes that new gas pipeline infrastructure is needed, but new construction is not guaranteed. First, the natural gas pipeline companies are reluctant to build unless they have some assurance that new customers will commit to buying up the increased gas supply (most existing gas customers in New England purchase on the spot market). Second, getting more natural gas to New England will mean gas pipelines that traverse through other New England states, which will likely be met with local resistance. As mentioned, Kinder Morgan has proposed a multi-billion natural gas pipeline that would enter western Massachusetts from the heart of Pennsylvania gas country. Already a dozen Massachusetts and New Hampshire towns along the proposed route have passed non-binding resolutions against the project over concerns about declining property values, the potential for explosions, and damage to forests, wetlands, and watersheds. Given the national opposition to the Keystone Pipeline, and the local opposition to the proposed Northern Pass electric transmission line project, this local resistance is not surprising.
45 2015 Regional Electricity Outlook (REO) http://www.iso-ne.com/static-assets/documents/2015/02/2015_reo.pdf

What is New Hampshire? 2015 Edition 62
Crime and Corrections in New Hampshire
New Hampshire enjoys a relatively low crime rate As measured by crime rate, New Hampshire has consistently been ranked one of the safest states in the nation. The state enjoyed the eleventh lowest crime rate out of the 50 states in 2013, according to the annual Uniform Crime Report published by the Federal Bureau of Investigation (FBI). However, the state’s property crime rate ranked higher than its violent crime rate. While New Hampshire’s violent crime rate was sixth-lowest in the country, the property crime rate was 13th-lowest.
Figure 51: Crime Rates per Hundred Thousand People by State, 2013
Source: Federal Bureau of Investigation Uniform Crime Report
Crime overall in New Hampshire is low, though property crime rose in the last decade In 2013, New Hampshire’s crime rate was 2,394 per 100,000 residents – 23 percent lower than the national average of 3,099 per 100,000 residents. In general, the crime rate, both in New Hampshire and nationally, has declined since the early 1990s. New Hampshire once boasted to having the lowest crime rate among the states a decade ago. But while the New Hampshire crime rate increased slightly over the past nine years, the U.S. crime rate has continued to fall steadily. This increase in the New Hampshire overall crime rate
New Hampshire, 2,393.9
0
500
1,000
1,500
2,000
2,500
3,000
3,500
4,000
4,500
5,000
N.M
.S
.C.
La.
Ark
.W
ash.
Ariz
.A
la.
Ten
n.G
a.O
kla.
Tex
.F
la.
Mo.
Del
.A
lask
aN
.C.
Nev
.O
re.
Haw
aii
Kan
s.In
d.O
hio
Uta
hM
d.C
alif.
Mis
s.C
olo.
Neb
r.M
ont.
Mic
h.R
.I. Ill.
Min
n.K
y.W
is.
Mas
s.Io
wa
Mai
neW
yo.
N.H
.W
. Va.
Pa. Vt.
N.D
.V
a.C
onn.
N.Y
.S
.D.
N.J
.Id
aho

What is New Hampshire? 2015 Edition 63
was driven mainly by a 20 percent increase in the state property crime rate from 2005 to 2013, specifically increases in the rate for larceny-theft.
Figure 52: All Crime Rate, Crimes per 100,000 People, FBI Uniform Crime Reports
Source: Federal Bureau of Investigation Uniform Crime Report
In the 1980’s the New Hampshire crime rate was 50% lower than the national crime rate. Many reasons could exist as to why New Hampshire’s crime rate rose much faster than the national average crime rate, and as many reasons could exist for the decline. Some factors that are known to impact the volume and type of crime occurring from place to place are: 46 Population density and degree of urbanization Variations in composition of the population, particularly youth concentration Stability of the population with respect to residents’ mobility, commuting patterns, and
transient factors Modes of transportation and highway system Economic conditions, including median income, poverty level, and job availability Cultural factors and educational, recreational, and religious characteristics Family conditions with respect to divorce and family cohesiveness. Climate Effective strength of law enforcement agencies Administrative and investigative emphases of law enforcement Policies of other components of the criminal justice system (i.e., prosecutorial, judicial,
correctional, and probational) Citizens’ attitudes toward crime
46 http://www.fbi.gov/hq/cjisd/ucrstat.htm
0
1,000
2,000
3,000
4,000
5,000
6,000
7,000
1960
1961
1962
1963
1964
1965
1966
1967
1968
1969
1970
1971
1972
1973
1974
1975
1976
1977
1978
1979
1980
1981
1982
1983
1984
1985
1986
1987
1988
1989
1990
1991
1992
1993
1994
1995
1996
1997
1998
1999
2000
2001
2002
2003
2004
2005
2006
2007
2008
2009
2010
2011
2012
2013
New Hampshire United States-Total
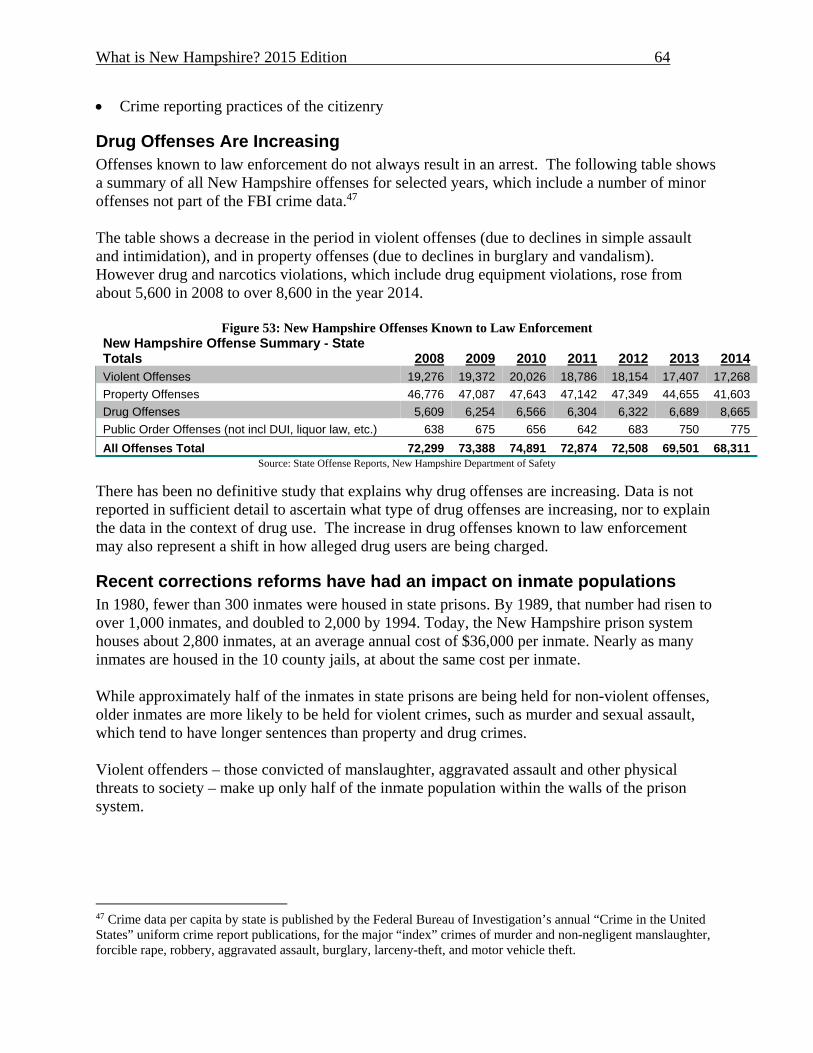
What is New Hampshire? 2015 Edition 64
Crime reporting practices of the citizenry
Drug Offenses Are Increasing Offenses known to law enforcement do not always result in an arrest. The following table shows a summary of all New Hampshire offenses for selected years, which include a number of minor offenses not part of the FBI crime data.47 The table shows a decrease in the period in violent offenses (due to declines in simple assault and intimidation), and in property offenses (due to declines in burglary and vandalism). However drug and narcotics violations, which include drug equipment violations, rose from about 5,600 in 2008 to over 8,600 in the year 2014.
Figure 53: New Hampshire Offenses Known to Law Enforcement New Hampshire Offense Summary - State Totals 2008 2009 2010 2011 2012 2013 2014Violent Offenses 19,276 19,372 20,026 18,786 18,154 17,407 17,268
Property Offenses 46,776 47,087 47,643 47,142 47,349 44,655 41,603
Drug Offenses 5,609 6,254 6,566 6,304 6,322 6,689 8,665
Public Order Offenses (not incl DUI, liquor law, etc.) 638 675 656 642 683 750 775
All Offenses Total 72,299 73,388 74,891 72,874 72,508 69,501 68,311 Source: State Offense Reports, New Hampshire Department of Safety
There has been no definitive study that explains why drug offenses are increasing. Data is not reported in sufficient detail to ascertain what type of drug offenses are increasing, nor to explain the data in the context of drug use. The increase in drug offenses known to law enforcement may also represent a shift in how alleged drug users are being charged.
Recent corrections reforms have had an impact on inmate populations In 1980, fewer than 300 inmates were housed in state prisons. By 1989, that number had risen to over 1,000 inmates, and doubled to 2,000 by 1994. Today, the New Hampshire prison system houses about 2,800 inmates, at an average annual cost of $36,000 per inmate. Nearly as many inmates are housed in the 10 county jails, at about the same cost per inmate. While approximately half of the inmates in state prisons are being held for non-violent offenses, older inmates are more likely to be held for violent crimes, such as murder and sexual assault, which tend to have longer sentences than property and drug crimes. Violent offenders – those convicted of manslaughter, aggravated assault and other physical threats to society – make up only half of the inmate population within the walls of the prison system.
47 Crime data per capita by state is published by the Federal Bureau of Investigation’s annual “Crime in the United States” uniform crime report publications, for the major “index” crimes of murder and non-negligent manslaughter, forcible rape, robbery, aggravated assault, burglary, larceny-theft, and motor vehicle theft.

What is New Hampshire? 2015 Edition 65
Figure 54: New Hampshire State Prison Population by Major Offense
Source: New Hampshire Department of Corrections
In 2010, the New Hampshire Legislature adopted a slate of reforms aimed at reducing recidivism among state inmates. The reforms, referred to as Senate Bill 500 (or the Justice Reinvestment Act), included
greater investment in treatment for high-risk offenders, ensured that everyone leaving prison receive at least nine months of supervision, required the release of nonviolent offenders after they have served no more than 120
percent of their minimum sentence, and limited the length of time a person could spend re-incarcerated on a parole violation.
Partially due to these provisions, the state prison inmate population dropped by 300 inmates from November 2010 to November 2011. However, in the following year legislators passed a new parole reform bill that made several changes to the Justice Reinvestment Act. These included giving the parole board discretion to exclude a prisoner convicted of a violent crime or a sexually violent offense who is nearing his or her maximum sentence from mandatory supervised release. The parole board also has the discretion to extend or reduce the 90-day period of re-incarceration for a parole violation, under specified circumstances. This second round of reforms had an immediate impact on the state prison inmate population, which started to rise again, increasing by 200 inmates from December 2011 to July 2014.
0
500
1000
1500
2000
2500
3000
3500O
ct-0
9D
ec-0
9F
eb-1
0A
pr-1
0Ju
n-10
Aug
-10
Oct
-10
Dec
-10
Feb
-11
Apr
-11
Jun-
11A
ug-1
1O
ct-1
1D
ec-1
1F
eb-1
2A
pr-1
2Ju
n-12
Aug
-12
Oct
-12
Dec
-12
Feb
-13
Apr
-13
Jun-
13A
ug-1
3O
ct-1
3D
ec-1
3F
eb-1
4A
pr-1
4Ju
n-14
Aug
-14
Oct
-14
Dec
-14
Feb
-15
Apr
-15
Jun-
15
Property Violent Public Order Drugs Alcohol Other Jurisdictions

What is New Hampshire? 2015 Edition 66
Figure 55: New Hampshire State Prison Inmate Population under Justice Reinvestment
Source: New Hampshire Department of Corrections The Justice Reinvestment Act can be considered a success, as the evidence suggests that the state was able to reduce the state prison population in 2011, as well as hold state prison expenditures constant for two years.48 The Department of Corrections plans to build a new prison for women, replacing the existing facility in Goffstown, New Hampshire. The official ground breaking for that new facility designed to hold 224 inmates occurred in August 2014, on land behind the existing men’s prison in Concord, New Hampshire. Looking ahead A number of additional corrections reforms have been introduced in New Hampshire in recent years, with the dual goals of improving public safety while lowering overall corrections costs.
Community corrections programs are expanding across the state Community corrections programs are an alternative to costly incarceration for non-violent offenders. These programs:
Allow offenders to live in the community under strict supervision.
48 More information available in the Center’s report on “New Hampshire’s Prison Population, Post SB-500”, available at http://www.nhpolicy.org/report/new-hampshireamp39s-prison-population-post-sb-500
0
500
1,000
1,500
2,000
2,500
3,000Ju
l-10
Aug
-10
Sep
-10
Oct
-10
Nov
-10
Dec
-10
Jan-
11F
eb-1
1M
ar-1
1A
pr-1
1M
ay-1
1Ju
n-11
Jul-1
1A
ug-1
1S
ep-1
1O
ct-1
1N
ov-1
1D
ec-1
1Ja
n-12
Feb
-12
Mar
-12
Apr
-12
May
-12
Jun-
12Ju
l-12
Aug
-12
Sep
-12
Oct
-12
Nov
-12
Dec
-12
Jan-
13F
eb-1
3M
ar-1
3A
pr-1
3M
ay-1
3Ju
n-13
Jul-1
3A
ug-1
3S
ep-1
3O
ct-1
3N
ov-1
3D
ec-1
3Ja
n-14
Feb
-14
Mar
-14
Apr
-14
May
-14
Jun-
14
SB52 EraSB 500 Era

What is New Hampshire? 2015 Edition 67
Ensure that offenders are accountable for their actions and repay the victims and the community for damages while the public’s safety is protected.
Attempt to address the social factors that fuel criminal behavior, such as drug addiction, homelessness, and unemployment, among others.
Under the 2010 Justice Reinvestment Act, the New Hampshire Department of Corrections established a Division of Community Corrections (DCC), which completed its first year of existence in 2011. The DCC has engaged in developing a completely new and science-based approach to assessment, case management and re-entry planning for offenders, including developing and operating the Parole Violator services at the Berlin prison. Community corrections programs also exist outside of the state prison system. Strafford County operates several community-based corrections programs, including a bail supervision program, home confinement/electronic monitoring, community work programs, jail-based residential drug abuse treatment, and a step-down program for current jail inmates.49
Diversion programs Diversion programs intervene before a non-violent, first-time offender goes to trial with an opportunity instead to participate in a program of community service and psycho-educational classes. Merrimack County currently operates an adult diversion program for first time felony, misdemeanor, and drug offenders.50 Across the state, the New Hampshire Juvenile Court Diversion Network51 focuses to divert first-time juvenile offenders out of the juvenile court system and into appropriate social services that support the juveniles and their families to prevent further delinquent behavior. Restorative justice, the idea that the juvenile will be held accountable for repairing the damage caused by his/her crime, is a central component to these programs. Various non-profit, social service, municipal, and court-sponsored organizations operate juvenile diversion programs in all New Hampshire counties.
Problem-solving courts and alternative sentencing Problem-solving courts52 are designed to address social issues, such as drug abuse and mental illness, which are often the underlying problems of criminal behavior. They aim to link participants to treatment services to address offenders’ substance abuse and mental health issues that led to criminal behavior, thereby reducing recidivism and protecting public safety. The goal, and challenge, of these courts is to balance punishment for a crime with successful and cost-effective rehabilitation while protecting the public’s safety. One of the key factors distinguishing problem-solving courts from traditional courts is a team approach. The judge, defense attorney, prosecutor, treatment provider, probation officer, and case manager, among others, come to consensus about what sanctions and treatment will be
49 Strafford County Community Corrections. http://co.strafford.nh.us/jail/community_corrections.html. 50 Merrimack County Diversion Program. http://www.merrimackcounty.net/html/county_attorney.html. 51 New Hampshire Juvenile Court Diversion Program. www.nhcourtdiversion.org. 52 Further discussion of drug courts and other problem-solving courts can be found at the Bureau of Justice Assistance. http://www.ojp.usdoj.gov/BJA/ or the National Drug Court Institute. www.ndci.org.
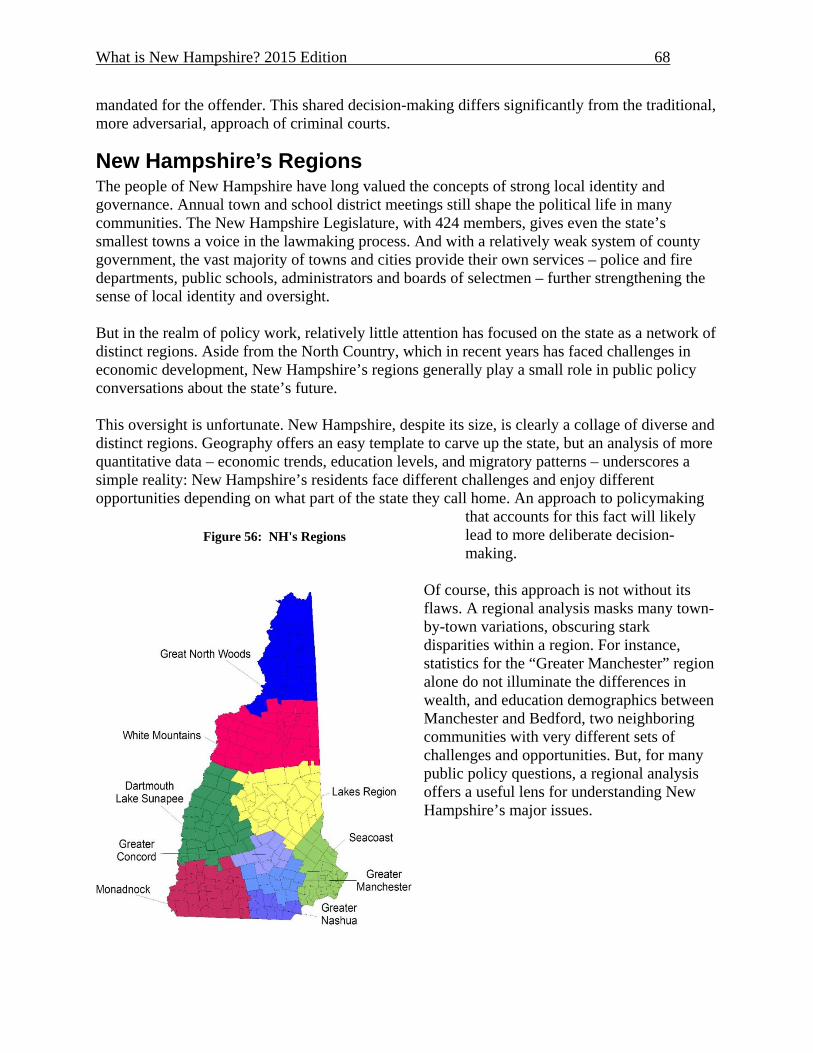
What is New Hampshire? 2015 Edition 68
mandated for the offender. This shared decision-making differs significantly from the traditional, more adversarial, approach of criminal courts.
New Hampshire’s Regions The people of New Hampshire have long valued the concepts of strong local identity and governance. Annual town and school district meetings still shape the political life in many communities. The New Hampshire Legislature, with 424 members, gives even the state’s smallest towns a voice in the lawmaking process. And with a relatively weak system of county government, the vast majority of towns and cities provide their own services – police and fire departments, public schools, administrators and boards of selectmen – further strengthening the sense of local identity and oversight. But in the realm of policy work, relatively little attention has focused on the state as a network of distinct regions. Aside from the North Country, which in recent years has faced challenges in economic development, New Hampshire’s regions generally play a small role in public policy conversations about the state’s future. This oversight is unfortunate. New Hampshire, despite its size, is clearly a collage of diverse and distinct regions. Geography offers an easy template to carve up the state, but an analysis of more quantitative data – economic trends, education levels, and migratory patterns – underscores a simple reality: New Hampshire’s residents face different challenges and enjoy different opportunities depending on what part of the state they call home. An approach to policymaking
that accounts for this fact will likely lead to more deliberate decision-making.
Of course, this approach is not without its flaws. A regional analysis masks many town-by-town variations, obscuring stark disparities within a region. For instance, statistics for the “Greater Manchester” region alone do not illuminate the differences in wealth, and education demographics between Manchester and Bedford, two neighboring communities with very different sets of challenges and opportunities. But, for many public policy questions, a regional analysis offers a useful lens for understanding New Hampshire’s major issues.
Figure 56: NH's Regions
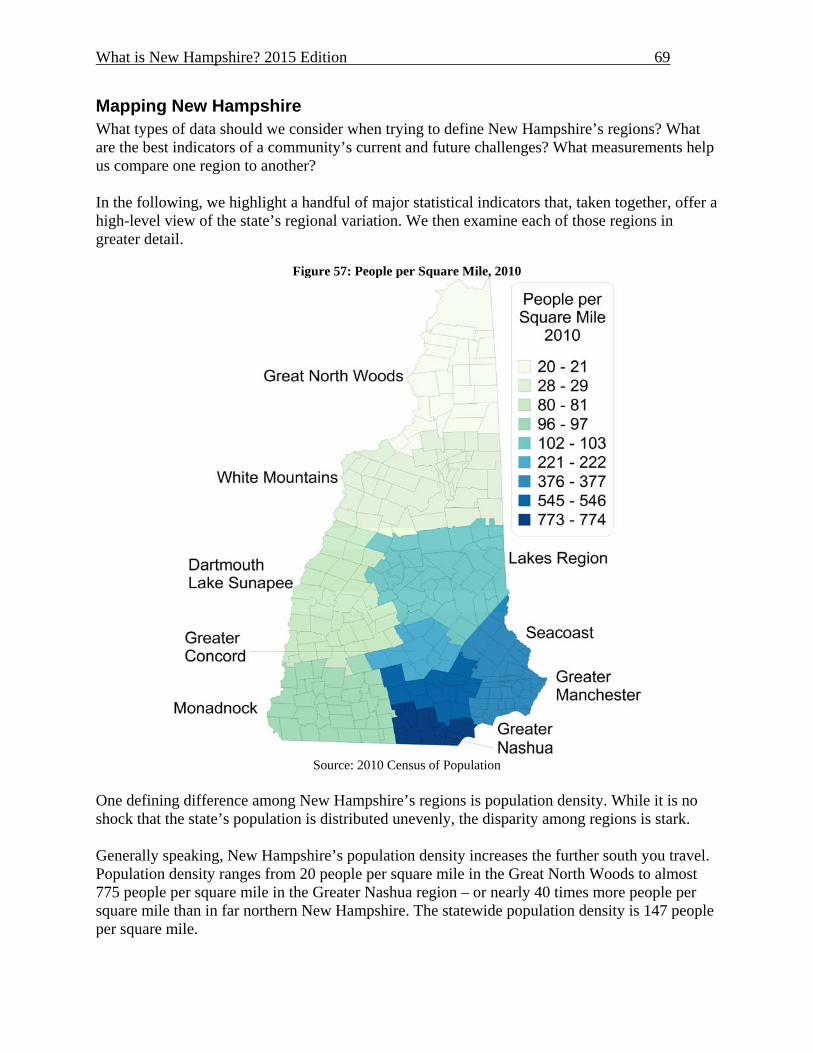
What is New Hampshire? 2015 Edition 69
Mapping New Hampshire What types of data should we consider when trying to define New Hampshire’s regions? What are the best indicators of a community’s current and future challenges? What measurements help us compare one region to another? In the following, we highlight a handful of major statistical indicators that, taken together, offer a high-level view of the state’s regional variation. We then examine each of those regions in greater detail.
Figure 57: People per Square Mile, 2010
Source: 2010 Census of Population
One defining difference among New Hampshire’s regions is population density. While it is no shock that the state’s population is distributed unevenly, the disparity among regions is stark. Generally speaking, New Hampshire’s population density increases the further south you travel. Population density ranges from 20 people per square mile in the Great North Woods to almost 775 people per square mile in the Greater Nashua region – or nearly 40 times more people per square mile than in far northern New Hampshire. The statewide population density is 147 people per square mile.
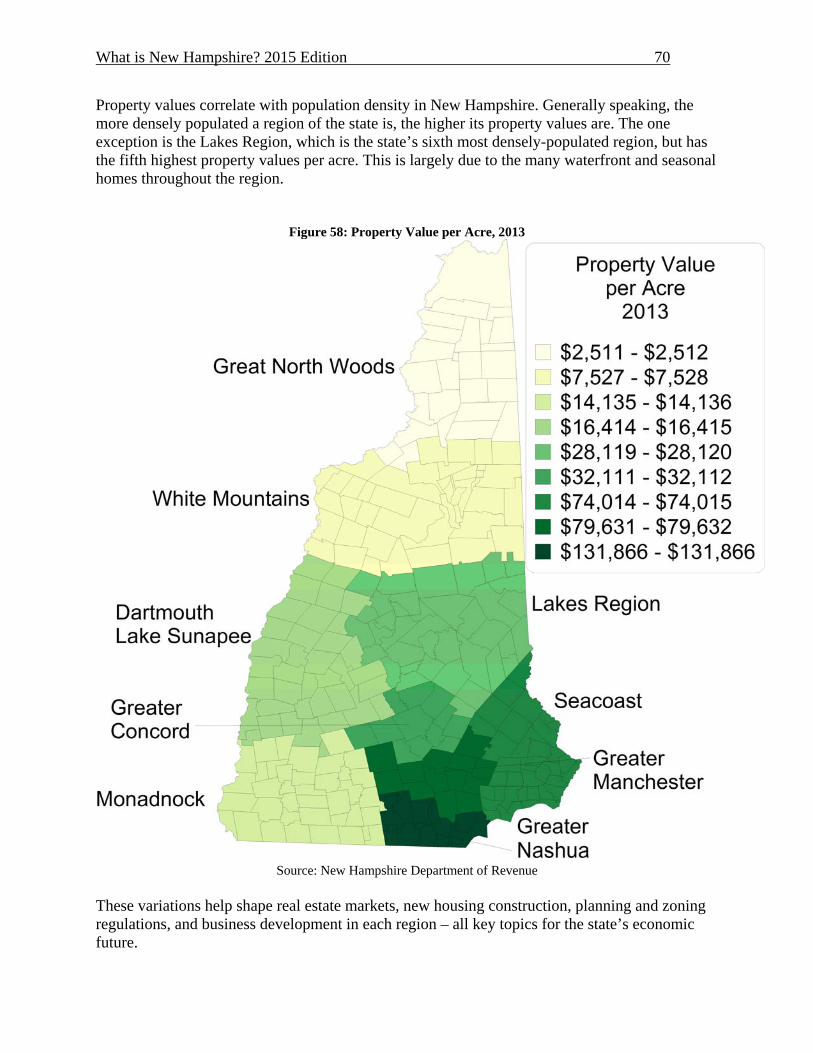
What is New Hampshire? 2015 Edition 70
Property values correlate with population density in New Hampshire. Generally speaking, the more densely populated a region of the state is, the higher its property values are. The one exception is the Lakes Region, which is the state’s sixth most densely-populated region, but has the fifth highest property values per acre. This is largely due to the many waterfront and seasonal homes throughout the region.
Figure 58: Property Value per Acre, 2013
Source: New Hampshire Department of Revenue
These variations help shape real estate markets, new housing construction, planning and zoning regulations, and business development in each region – all key topics for the state’s economic future.
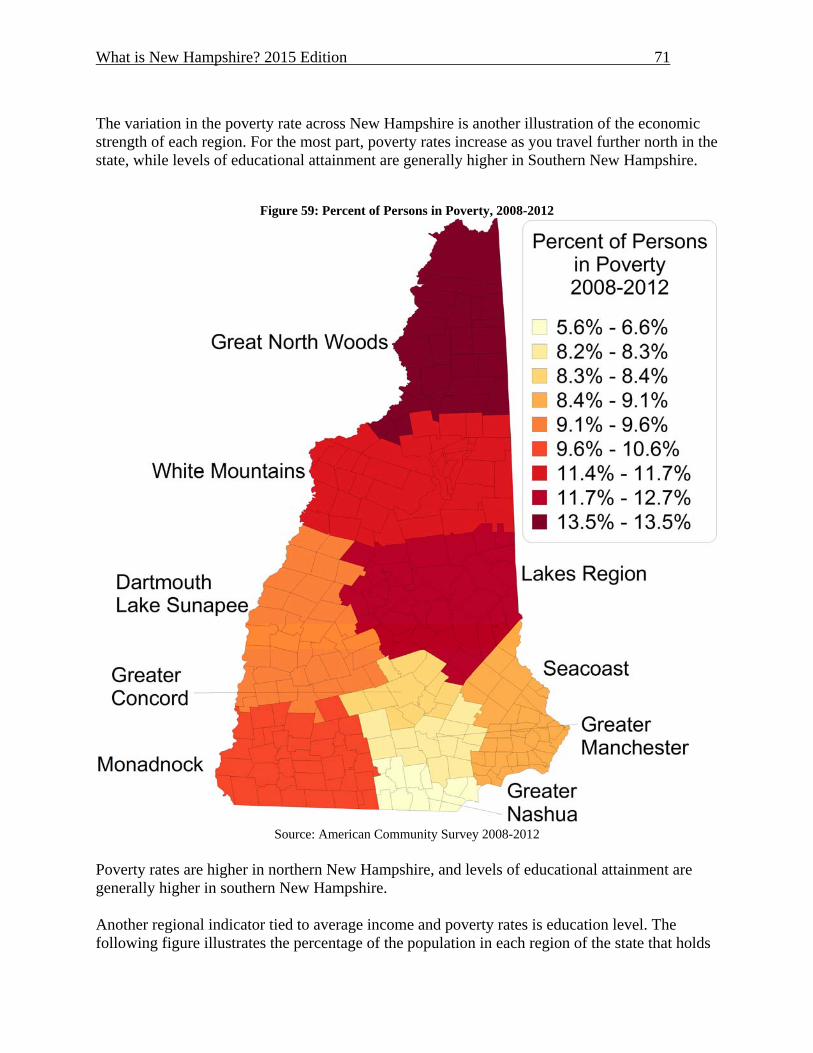
What is New Hampshire? 2015 Edition 71
The variation in the poverty rate across New Hampshire is another illustration of the economic strength of each region. For the most part, poverty rates increase as you travel further north in the state, while levels of educational attainment are generally higher in Southern New Hampshire.
Figure 59: Percent of Persons in Poverty, 2008-2012
Source: American Community Survey 2008-2012
Poverty rates are higher in northern New Hampshire, and levels of educational attainment are generally higher in southern New Hampshire. Another regional indicator tied to average income and poverty rates is education level. The following figure illustrates the percentage of the population in each region of the state that holds

What is New Hampshire? 2015 Edition 72
a bachelor’s degree or higher. Generally speaking, the higher the rate of educational attainment, the higher the average income and the lower the poverty rate in a region.
Figure 60: Percent of Adult Population with a Bachelor's Degree or Higher, 2008-2012
Source: American Community Survey 2008-2012
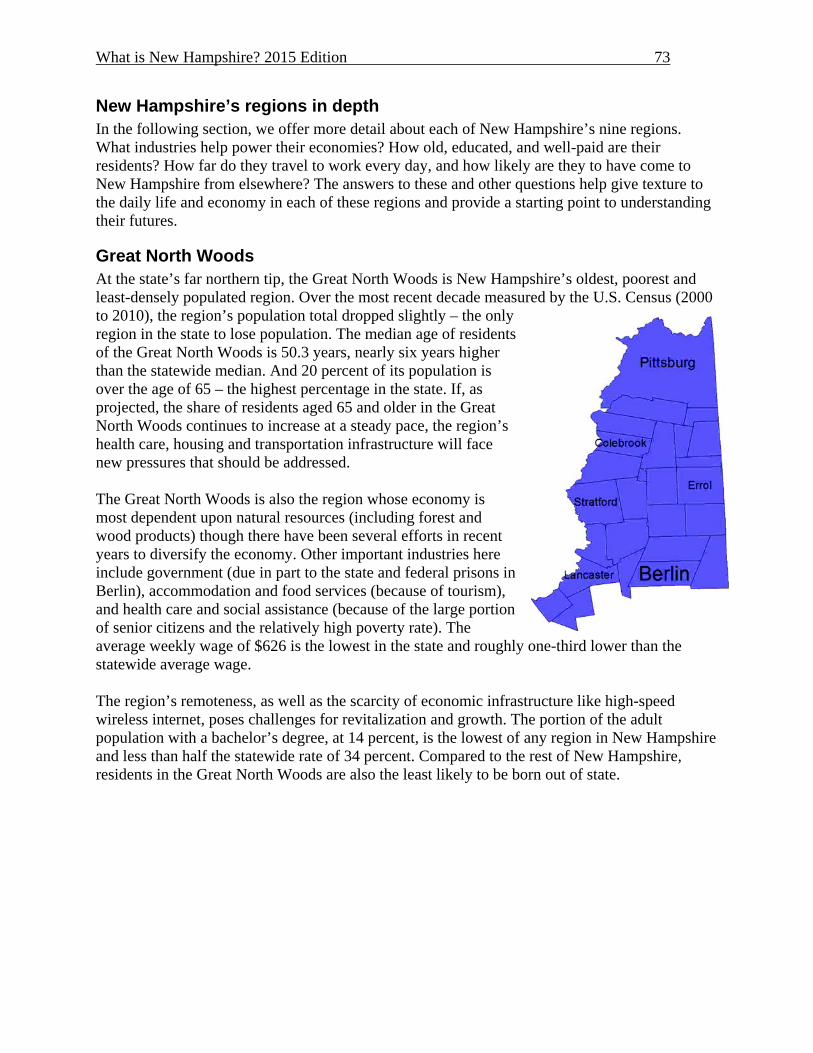
What is New Hampshire? 2015 Edition 73
New Hampshire’s regions in depth In the following section, we offer more detail about each of New Hampshire’s nine regions. What industries help power their economies? How old, educated, and well-paid are their residents? How far do they travel to work every day, and how likely are they to have come to New Hampshire from elsewhere? The answers to these and other questions help give texture to the daily life and economy in each of these regions and provide a starting point to understanding their futures.
Great North Woods At the state’s far northern tip, the Great North Woods is New Hampshire’s oldest, poorest and least-densely populated region. Over the most recent decade measured by the U.S. Census (2000 to 2010), the region’s population total dropped slightly – the only region in the state to lose population. The median age of residents of the Great North Woods is 50.3 years, nearly six years higher than the statewide median. And 20 percent of its population is over the age of 65 – the highest percentage in the state. If, as projected, the share of residents aged 65 and older in the Great North Woods continues to increase at a steady pace, the region’s health care, housing and transportation infrastructure will face new pressures that should be addressed. The Great North Woods is also the region whose economy is most dependent upon natural resources (including forest and wood products) though there have been several efforts in recent years to diversify the economy. Other important industries here include government (due in part to the state and federal prisons in Berlin), accommodation and food services (because of tourism), and health care and social assistance (because of the large portion of senior citizens and the relatively high poverty rate). The average weekly wage of $626 is the lowest in the state and roughly one-third lower than the statewide average wage. The region’s remoteness, as well as the scarcity of economic infrastructure like high-speed wireless internet, poses challenges for revitalization and growth. The portion of the adult population with a bachelor’s degree, at 14 percent, is the lowest of any region in New Hampshire and less than half the statewide rate of 34 percent. Compared to the rest of New Hampshire, residents in the Great North Woods are also the least likely to be born out of state.

What is New Hampshire? 2015 Edition 74
White Mountains The White Mountains are a center of tourism and outdoor recreation, both of which power this region’s economy. Conway, Haverhill and Littleton are the major labor market areas, but it is the 800,000-acre White Mountain National Forest that defines the area, both geographically and economically. The White Mountain-area economy is disproportionately weighed toward accommodation and food service, recreation, entertainment and retail trade – all sectors driven by tourism. The region also has the highest portion of seasonal homes in the state (36 percent of the housing stock). However, the poverty rate here is among the highest in New Hampshire, and average weekly wages are among the lowest in the state. Many workers in the White Mountain region hold multiple jobs at once or balance several seasonal jobs throughout the year – partly because of the tourism-centered economy. A more diversified economy would be one way to address the economic imbalance in the region. Efforts to do so include the development of the TechVillage in Conway, which seeks to attract smaller, full-time employers to the region. In addition, the prevalence of seasonal homes has put pressure on the need for workforce housing in the region. The buying power of wealthy vacationers and second-home owners can inflate prices across the real estate market, making it difficult for younger workers earning lower wages to buy homes. A coordinated, regional approach to housing development – with a focus on smaller units in denser developments – is one way to address this problem, and such efforts are currently underway. Still, the past few years have seen substantial growth in the White Mountain region. Between 2000 and 2010, the area had the highest rate of population increase of any region in New Hampshire, with an increase of 11.2 percent. However, the region still has the second smallest overall population in the state. The White Mountain region also has the second-highest median age of any area of the state and one of the lowest percentages of school-age children. With an aging population, driven in large part by transplanted retirees, the White Mountain region will need to ensure it has the sufficient workforce to keep its tourism and service industries thriving. This challenge also relates to the region’s housing needs, as discussed above: Will the region have sufficient and the right mix of housing stock to provide homes for those workers in years to come?
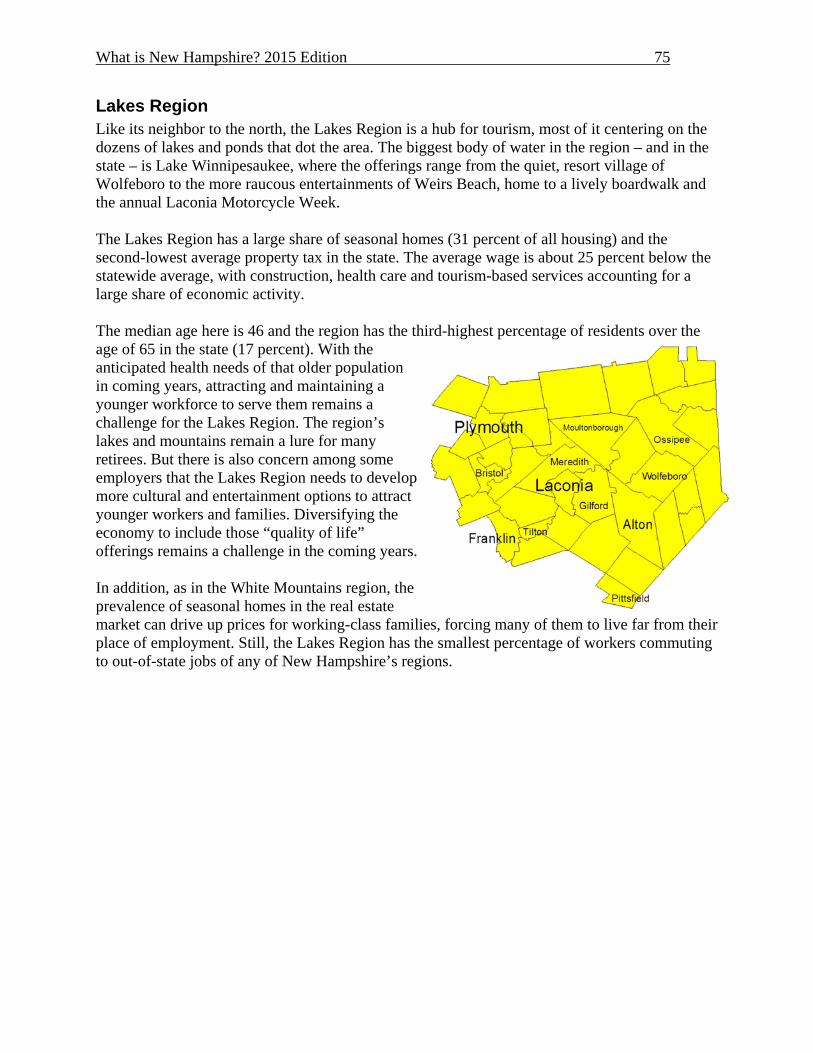
What is New Hampshire? 2015 Edition 75
Lakes Region Like its neighbor to the north, the Lakes Region is a hub for tourism, most of it centering on the dozens of lakes and ponds that dot the area. The biggest body of water in the region – and in the state – is Lake Winnipesaukee, where the offerings range from the quiet, resort village of Wolfeboro to the more raucous entertainments of Weirs Beach, home to a lively boardwalk and the annual Laconia Motorcycle Week. The Lakes Region has a large share of seasonal homes (31 percent of all housing) and the second-lowest average property tax in the state. The average wage is about 25 percent below the statewide average, with construction, health care and tourism-based services accounting for a large share of economic activity. The median age here is 46 and the region has the third-highest percentage of residents over the age of 65 in the state (17 percent). With the anticipated health needs of that older population in coming years, attracting and maintaining a younger workforce to serve them remains a challenge for the Lakes Region. The region’s lakes and mountains remain a lure for many retirees. But there is also concern among some employers that the Lakes Region needs to develop more cultural and entertainment options to attract younger workers and families. Diversifying the economy to include those “quality of life” offerings remains a challenge in the coming years. In addition, as in the White Mountains region, the prevalence of seasonal homes in the real estate market can drive up prices for working-class families, forcing many of them to live far from their place of employment. Still, the Lakes Region has the smallest percentage of workers commuting to out-of-state jobs of any of New Hampshire’s regions.
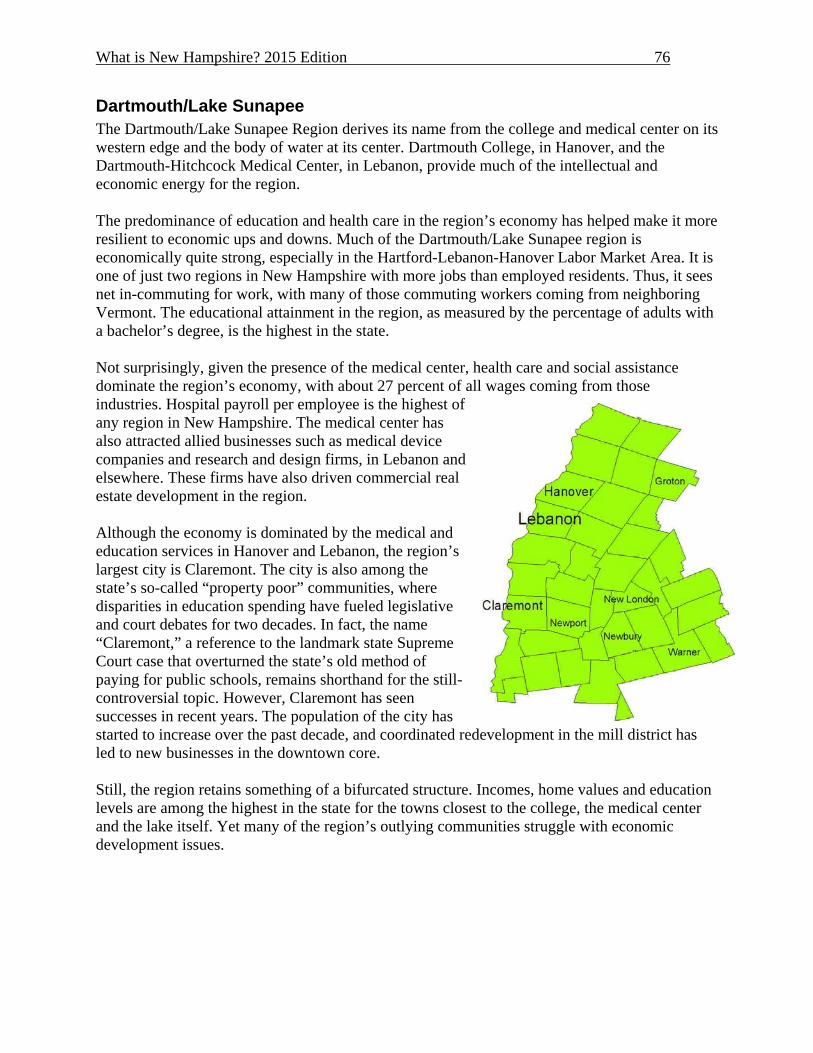
What is New Hampshire? 2015 Edition 76
Dartmouth/Lake Sunapee The Dartmouth/Lake Sunapee Region derives its name from the college and medical center on its western edge and the body of water at its center. Dartmouth College, in Hanover, and the Dartmouth-Hitchcock Medical Center, in Lebanon, provide much of the intellectual and economic energy for the region. The predominance of education and health care in the region’s economy has helped make it more resilient to economic ups and downs. Much of the Dartmouth/Lake Sunapee region is economically quite strong, especially in the Hartford-Lebanon-Hanover Labor Market Area. It is one of just two regions in New Hampshire with more jobs than employed residents. Thus, it sees net in-commuting for work, with many of those commuting workers coming from neighboring Vermont. The educational attainment in the region, as measured by the percentage of adults with a bachelor’s degree, is the highest in the state. Not surprisingly, given the presence of the medical center, health care and social assistance dominate the region’s economy, with about 27 percent of all wages coming from those industries. Hospital payroll per employee is the highest of any region in New Hampshire. The medical center has also attracted allied businesses such as medical device companies and research and design firms, in Lebanon and elsewhere. These firms have also driven commercial real estate development in the region. Although the economy is dominated by the medical and education services in Hanover and Lebanon, the region’s largest city is Claremont. The city is also among the state’s so-called “property poor” communities, where disparities in education spending have fueled legislative and court debates for two decades. In fact, the name “Claremont,” a reference to the landmark state Supreme Court case that overturned the state’s old method of paying for public schools, remains shorthand for the still-controversial topic. However, Claremont has seen successes in recent years. The population of the city has started to increase over the past decade, and coordinated redevelopment in the mill district has led to new businesses in the downtown core. Still, the region retains something of a bifurcated structure. Incomes, home values and education levels are among the highest in the state for the towns closest to the college, the medical center and the lake itself. Yet many of the region’s outlying communities struggle with economic development issues.

What is New Hampshire? 2015 Edition 77
Monadnock Region With its small villages, old town greens and absence of interstate highways, the Monadnock Region offers a version of classic New England. Economically, this region closely mirrors New Hampshire as a whole, with its average gross income, unemployment and poverty rates, and balance of industries closely matching the statewide figures. The median age in the Monadnock Region is 44, about a year below the state median. The percentage of the population over the age of 65 is close to the statewide percentage (14.9 percent in Monadnock vs. 13.7 percent for all of New Hampshire). The Monadnock Region’s population grew by 6 percent between 2000 and 2010, close to the statewide population increase of 6.5 percent. Keene is the largest city and economic hub of the region. It is home to Keene State College, part of the University System of New Hampshire, as well as Antioch University New England, Franklin Pierce University, and River Valley Community College’s Keene campus. Construction and manufacturing are highly concentrated in the Monadnock Region, with the latter supplying the highest share of total wages. Property tax rates in the Monadnock Region are the third-highest in the state. As a community, the citizens of the Monadnock Region rank quality-of-life issues as high priorities. Residents and community leaders here often speak of their unique view of civic engagement and community involvement. For example, the Healthy Monadnock 2020 initiative strives to make the area the healthiest community in the country by the year 2020. In addition to this effort, there are several other examples of collaborative spirit in the Region such as Arts Alive!, Monadnock Farm and Community Connection, and Monadnock Buy Local.

What is New Hampshire? 2015 Edition 78
Seacoast Officially, New Hampshire's Seacoast is the 18-mile strip of oceanfront linking the state to the Atlantic. But the economic ripples from this vital region reach far inland. The region includes the inland coastal communities of Great Bay and the coastal rivers. There are several hundreds of miles of inland coast both in Rockingham and Strafford Counties. The Seacoast has a diverse economy that includes more than a quarter of New Hampshire’s labor force – the highest share in the state. Among the major employers shaping this region are the Pease Tradeport in Portsmouth and the Naval Shipyard in Kittery, Maine, which employ hundreds of people. Rochester-Dover is a major labor market area, and Durham is home to the main campus of the University of New Hampshire. Portsmouth is a center for tourism and the arts, and the Seacoast’s shore towns host hordes of out-of-state tourists throughout the summer months. People in general are attracted to the high quality of life – natural beauty, access to recreation, proximity to Boston, among other factors. Wedged between Maine and Massachusetts, the Seacoast region has the second-highest portion of residents born out of state, at just over 60 percent, and the second-highest portion of workers commuting to out of state jobs as any region in New Hampshire. Average household income is the second highest of the state’s regions, and property values rank third highest. But like other regions of the state where tourism and second-home ownership help fuel the economy, the Seacoast faces challenges related to affordable housing. This includes housing for young workers and families, and also elderly residents. The region’s population increased 8.6 percent between 2000 and 2010, higher than the statewide growth rate over that period. And the Seacoast is home to the largest share of New Hampshire’s population of any of the state’s regions, with 22 percent of people calling it home. With this growth has come increased traffic on the region’s road networks, and this issue has received much attention from local planners. Several major throughways cross the region, including Interstate 95, and Routes 101, 4 and 16. Those roads draw visitors and workers to the region. Still, unique to New Hampshire, Seacoast has a fairly diverse transportation system, including intercity buses, Amtrak and multimodal transit center in Portsmouth. The expansion of the Little Bay Bridge is expected to be completed by 2020, which regional planners hope will have a positive impact on economic development at Pease, Portsmouth, Dover, Rochester, and Durham. Managing the transportation network will have considerable impacts on economic development, the environment and the quality of life for Seacoast residents. It will also require collaboration

What is New Hampshire? 2015 Edition 79
across town lines, forcing communities to think beyond the needs of their individual municipalities.
Merrimack Valley Region The Merrimack Valley is the most densely settled area in New Hampshire. The state's three largest cities – Concord, Manchester, and Nashua – can be found here, representing the centers of government, finance, and manufacturing for the state. Interstate 93 slices through this region, offering access to the Boston economy and out-of-state jobs, especially for those living in the southern portion of the region. While the Merrimack Valley’s population is the youngest in the state, the region – like the rest of New Hampshire – is aging and must consider steps to retain and attract young and middle-aged workers if it wishes to remain economically competitive. More than 45 percent of New Hampshire’s total population calls the Merrimack Valley home, and the region’s economy is diverse. Because of that, we have divided the Merrimack Valley into three sub-regions for this report, with one sub-region for each of the area’s major urban hubs.
Greater Concord With the state capital at its center, the Greater Concord region counts government as its major industry. Government employment provides 26 percent of the region’s wages, twice the state average for that sector. Health care and social assistance is the second largest sector, accounting for 18 percent of the region’s salaries. Concord, located at the juncture of three highways, is the region’s employment and commercial hub. State government and Concord Hospital are the city’s major employers. Greater Concord had a higher rate of population growth in the 2000s than the rest of the Merrimack Valley Region, increasing 6.3 percent over that decade. Yet, compared to the state’s other major cities, Greater Concord is still relatively underdeveloped. Population density here is less than a third that of Greater Nashua, for instance. Concord itself, beyond the compact downtown, includes large swathes of protected woods and open space, as do many neighboring towns. This landscape illustrates a fundamental tension for the region as it contemplates its future: how to encourage and accommodate growth without undermining the desire to maintain a rural character. Recent development projects in Concord have refocused attention on the city’s downtown core, though other communities – Suncook and Penacook, for instance – are also looking for ways to reinvigorate their commercial districts.

What is New Hampshire? 2015 Edition 80
The poverty rate of 8.3 percent is slightly lower than the statewide rate, as is average household income. Residents of Greater Concord are among the least likely to work out of state, with just 4 percent crossing the border for a job compared to 16 percent statewide. Greater Concord’s median age, 42 years, is lower than the statewide median age of 45 years, though the percentage of residents older than 65 here is nearly even with the statewide percentage. Property tax rates in the Greater Concord region are the highest in the Merrimack Valley, while property value per acre is the lowest in the region. With a large share of government-owned property, the portion of land exempt from the property tax is nearly twice the state average.
Greater Manchester Greater Manchester, with the state’s largest city at its heart, has a diverse economy based on finance and insurance services, information services, manufacturing and health care. This region’s population is the youngest in the state. The median age here is 40 years, nearly five years younger than the statewide median. Only 11 percent of the population is over the age of 65, also the lowest percentage of any region in New Hampshire. Within the Merrimack Valley region, Greater Manchester has the lowest level of educational attainment – 32 percent of the adult population has a bachelor’s degree or better. Radiating from the city of Manchester, this region includes a ring of smaller towns that range from working-class communities like Goffstown to upscale bedroom communities like Bedford. About 13 percent of Greater Manchester residents work out of state, slightly lower than the statewide rate. Manchester has witnessed an economic revival in recent years, with the conversion of many former mill buildings into office space, the construction of a minor league ballpark along the Merrimack River and a gradual increase in the downtown dining and entertainment establishments. However, while the Greater Manchester region has the youngest population in the state, it also saw a drop in its school-age population from 2000 to 2010 that exceeded the statewide figure, though only slightly. Economically, Manchester has several significant and unique assets: the Manchester/Boston Regional airport within short driving distance to the downtown; several colleges and universities (Southern New Hampshire University, St. Anselm College, UNH’s Manchester campus and Manchester Community College) and proximity to the interstate highway system.
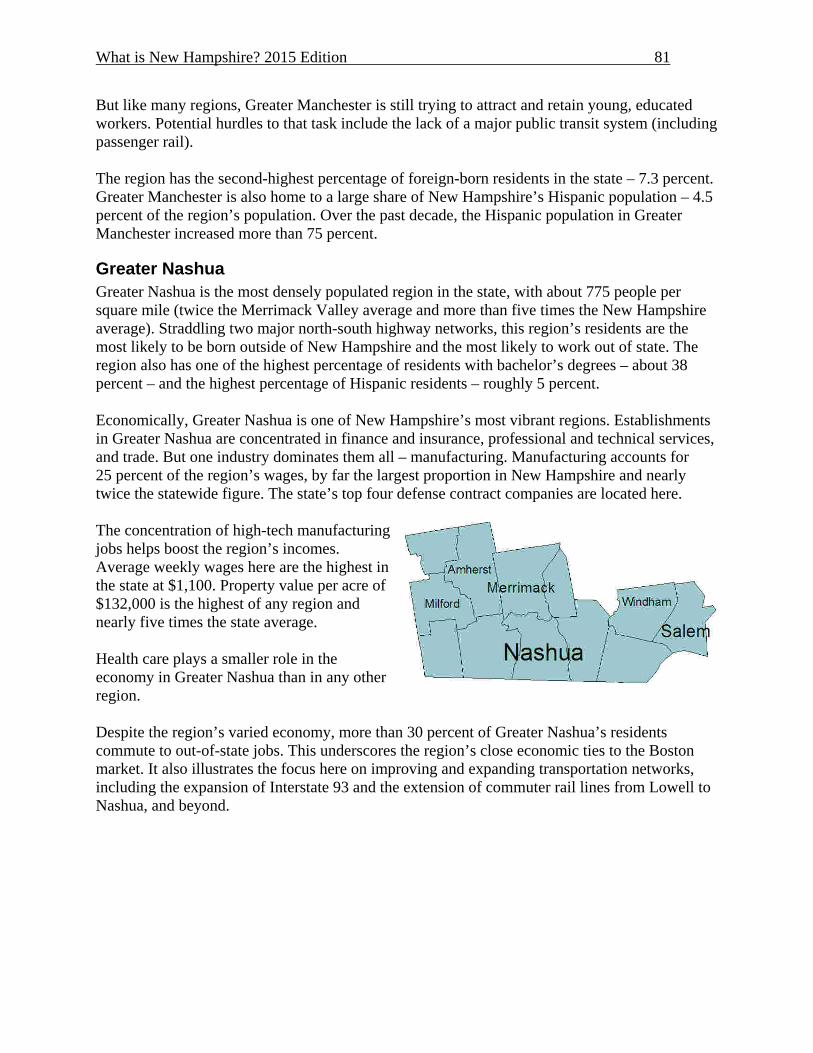
What is New Hampshire? 2015 Edition 81
But like many regions, Greater Manchester is still trying to attract and retain young, educated workers. Potential hurdles to that task include the lack of a major public transit system (including passenger rail). The region has the second-highest percentage of foreign-born residents in the state – 7.3 percent. Greater Manchester is also home to a large share of New Hampshire’s Hispanic population – 4.5 percent of the region’s population. Over the past decade, the Hispanic population in Greater Manchester increased more than 75 percent.
Greater Nashua Greater Nashua is the most densely populated region in the state, with about 775 people per square mile (twice the Merrimack Valley average and more than five times the New Hampshire average). Straddling two major north-south highway networks, this region’s residents are the most likely to be born outside of New Hampshire and the most likely to work out of state. The region also has one of the highest percentage of residents with bachelor’s degrees – about 38 percent – and the highest percentage of Hispanic residents – roughly 5 percent. Economically, Greater Nashua is one of New Hampshire’s most vibrant regions. Establishments in Greater Nashua are concentrated in finance and insurance, professional and technical services, and trade. But one industry dominates them all – manufacturing. Manufacturing accounts for 25 percent of the region’s wages, by far the largest proportion in New Hampshire and nearly twice the statewide figure. The state’s top four defense contract companies are located here. The concentration of high-tech manufacturing jobs helps boost the region’s incomes. Average weekly wages here are the highest in the state at $1,100. Property value per acre of $132,000 is the highest of any region and nearly five times the state average. Health care plays a smaller role in the economy in Greater Nashua than in any other region. Despite the region’s varied economy, more than 30 percent of Greater Nashua’s residents commute to out-of-state jobs. This underscores the region’s close economic ties to the Boston market. It also illustrates the focus here on improving and expanding transportation networks, including the expansion of Interstate 93 and the extension of commuter rail lines from Lowell to Nashua, and beyond.