Embed Size (px)
Citation preview

1
Morgan Ball – Managing Director
BC Iron – A Resources Yield Play?
ASX:BCI
12 Mar ‘14

2
Optimising the NJV | Paying dividends | Considering growth

CORPORATE OVERVIEW
3
Capital Structure Share Price and Volume
Shareholder Breakdown Enhanced Liquidity Research Coverage
Ordinary Shares 124.0m
Share Price (at 10-Mar-14) $4.60
Market Capitalisation $570m
Cash (at 31-Dec-13) $197m
Debt (at 31-Dec-13) $66m
Enterprise Value $439m
Options / Performance Rights 1.0m
Retail, Brokers
and Other
27%
Institutional
Shareholders
71%
BCI Directors
2%
0
1
2
3
4
5
6
7
$2.00
$2.50
$3.00
$3.50
$4.00
$4.50
$5.00
$5.50
Jul-12 Oct-12 Jan-13 Apr-13 Jul-13 Oct-13 Jan-14
Vo
lum
e (
m)
Sh
are
Pri
ce
152
496 563
875
H1 FY13 H2 FY13 H1 FY14 H2 FY14To Date
Av
e.
Daily V
olu
me
(‘0
00)
(as at 31-Jan-14) (excl. block trades)

CAPITAL MANAGEMENT STRATEGY
4
DIVIDENDS GROWTH
AND
We seek to provide both BC Iron’s strategy
Consider growth in a measured fashion, with a focus on shareholder value
Continue to repay debt ahead of schedule
Continue to reward shareholders with strong dividends
If appropriate opportunity is identified, seek support from capital markets (raise debt / equity)

DIVIDENDS DECLARED TO DATE
5
FY14
Interim Dividend
FY13
Final Dividend
FY13
Interim Dividend
FY12
Full Year Dividend1
Dividend (cps) 17 30 5 15
Franking Fully franked Fully franked Fully franked Fully franked
Total Dividend ($M) 21.1 37.1 6.2 15.6
Payout Ratio (% Statutory NPAT) 30% 90% 80% 31%1
Payout Ratio (% Underlying NPAT) 31% 64% 47% 31%1
Notes:
1. The FY12 final dividend was BC Iron’s maiden dividend and was considered a full year dividend. NPAT and payout ratio above are in respect of the entire FY12.
2. Payout ratios are based on statutory NPAT. “-ve” denotes a dividend paid when statutory NPAT was negative. Reporting periods are normalised to a June year end. Dividends are converted into reporting currency at ex-dividend date if applicable.
31
17
-ve
27 22
89
16
-ve
28
-ve
30
16
0 0
100
BC Iron Peer 1 Peer 2 Peer 3 Peer 4
FY12 FY13 1H FY14
Peer Payout Ratios2
FY12 FY13 1H FY14

DIVIDEND GUIDANCE
6
Intend to pay interim and final dividend each year
Target payout ratio of 30-50% of NPAT
Annual target, rather than a target for both interim and final
All else equal, final dividend expected to be larger than interim
Franked to the maximum extent possible
If sufficient franking credits are not available, consider unfranked or
partially franked dividends or other ways to return funds to shareholders
Other considerations
Always maintain 3-4 months of operating costs as working capital buffer
Operational performance, cash requirements, growth prospects, etc

MARKET COMMENTARY ON DIVIDENDS
7
“These four stocks (BC Iron, Ausdrill,
Myer and Metcash) have good, well-
funded dividend payments that make
international stocks look bad”
“Perhaps the best of these dividends
goes to BC Iron”
Owen Raskiewicz, The Motley Fool, 4-Oct-13
“BC Iron dividend decision cheered by investors”
Luke Forrestal, Financial Review, 29-Aug-13
“Analysts argue that other miners are
likely to follow their (BC Iron,
Fortescue and Woodside’s) example as
a spate of projects come on stream”
Karen Maley, Financial Review, 1-Dec-13
“In a market that now favours tried and
true cashflow over grand visions of
growth at any cost, BC Iron has found
its sweet spot.” Paul Garvey, The Australian, 2-Dec-13
“It’s one of the few resources
companies that actually provides a
decent yield, while at the same time
giving you exposure to the upside of
higher commodity prices”
Jason Chesters, Patersons Asset Management, 29-Aug-13

DIVIDEND YIELDS
8
S&P ASX300 Metals and Mining Index
S&P ASX300 Index
0%
5%
10%
15%
20%
25%
30%
BC Iron: ranked 7 All companies ranked higher than BC Iron have
experienced a significant share price decline
over the past year
0%
2%
4%
6%
8%
10%
12%
14%
16%
BC Iron: ranked 1
Source: Bloomberg as at 10-Mar-2014.
Note: Based on previous 12 months dividends (grossed up for franking credits), divided by current share price.
BC Iron is one of the highest yielding ASX 300 companies and the highest
yielding in the Metals and Mining sub-index.

TOTAL SHAREHOLDER RETURN
9
Why has BC Iron outperformed its peers?
Quality project with low capital intensity
Low risk
Continued strong operational performance
Repeated delivery against guidance
Strong management and appropriate capital
structure
Completion of FMG transaction
NPV per share, CFPS and EPS accretive
80% increase in equity production to 4.5Mtpa
Increased institutional ownership and liquidity
Attractive payout ratio of fully franked dividends
104%
4%
(51%)
4%
(42%)
BC Iron Peer 1 Peer 2 Peer 3 Peer 4
Total Shareholder Return – Since 1-Jul-12
Note: Total shareholder return includes dividends grossed up for franking credits.

Priority 3 Growth in other iron
ore jurisdictions
Priority 2 Growth in the rest of
the Pilbara
BUSINESS DEVELOPMENT
10
Business Development Priorities
Goals
Retain and enhance ability to pay dividends
Generate value for shareholders (risk adjusted) via organic and inorganic opportunities
Priority 1 Extend life of the NJV
(Project Inventory)

11
DSO
Low grade
Waste
Targeting in-pit
low grade…
… and near-
pit low grade
Current pit
boundary Conceptual new
pit boundary
Assessing potential for increases in Reserves and mine life
Targeting a mine life extension of 2 to 5 years
Focus on beneficiation of low grade (50-55% Fe)
Potential to increase Reserves and mine life from:
Low grade within existing pit designs
Low grade just outside pit boundaries
DSO and low grade at regional mesas, previously assessed as unviable for DSO only
PROJECT INVENTORY

12
Mt Fe% CaFe% Al2O3% SiO2% P% S% LOI
Total Reserves 33.3 57.1 64.9 1.9 3.0 0.014 0.011 12.0
Total DSO Resource 44.6 57.1 64.7 2.1 3.1 0.016 0.012 11.9
Total CID Resource 112.2 53.3 60.6 4.1 5.3 0.020 0.015 12.1
Note:
Ore Reserves are a subset of DSO Mineral Resources. DSO Mineral Resources are a subset of CID Mineral Resources.
This information is extracted from the ASX announcement entitled NJV Ore Reserves and Mineral Resources dated 3 March 2014 and is available to view on http://www.bciron.com.au/investors/asx-announcements/2014.html. The company confirms that it is not aware of any new information or data that materially affects the information included in the original market announcement and, in the case of estimates of Mineral Resources or Ore Reserves, that all material assumptions and technical parameters underpinning the estimate in the relevant market announcement continue to apply and have not materially changed. The company confirms that the form and context in which the Competent Persons’ findings are presented have not been materially modified from the original market announcement.
Beneficiation Trial
Product
Beneficiation Trial
Waste
Initial low grade beneficiation trial completed
Simple dry crush and screen process
Trialled different plant configurations and
different low grade types from stockpiles and
current mining areas
Next steps to include trial sale of BBSO/DSO
blend, analysis of trial outcomes, re-evaluation
of Reserves and mine plan
PROJECT INVENTORY

GROWTH CONSIDERATIONS
13
Deposit and
infrastructure
BC Iron view on
commodity price
Specific
circumstances

BRAZIL EXPLORATION EARN-IN
14
BC Iron / Cleveland alliance staged earn-in to 3 exploration projects
No upfront payments and appropriately staged expenditure and payments provides optionality
Mapping geophysical interpretation and rock chip sampling completed at the Bahia projects
Results were encouraging and an initial drilling program is now underway

15
BC IRON VIDEO
http://www.bciron.com.au/about-us.html
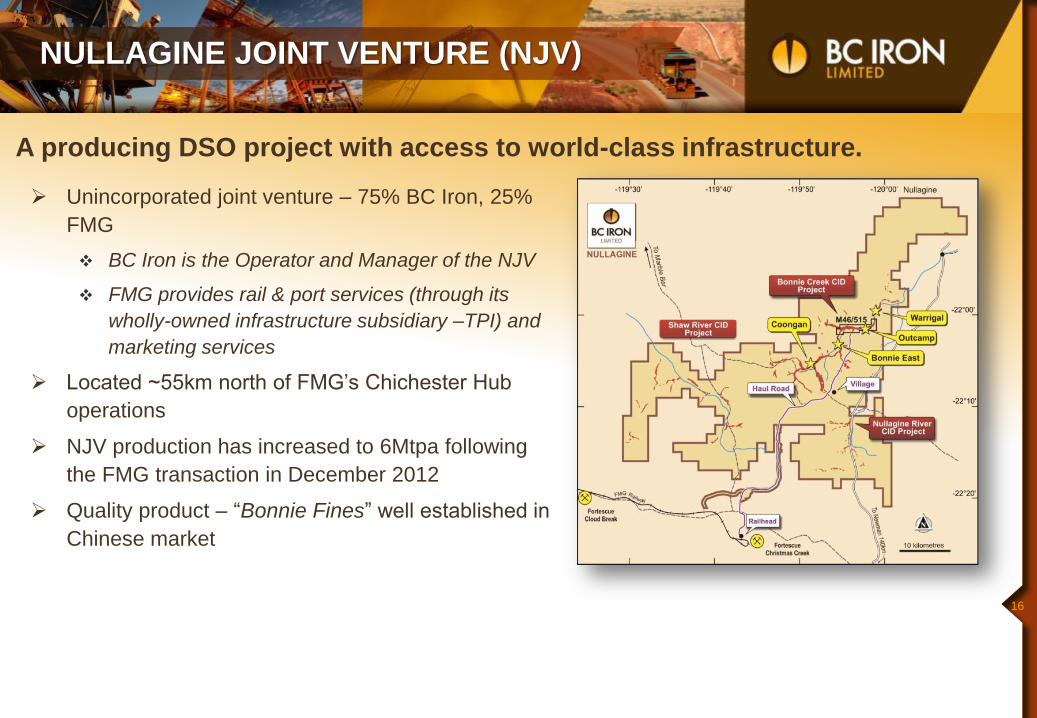
NULLAGINE JOINT VENTURE (NJV)
16
Unincorporated joint venture – 75% BC Iron, 25%
FMG
BC Iron is the Operator and Manager of the NJV
FMG provides rail & port services (through its
wholly-owned infrastructure subsidiary –TPI) and
marketing services
Located ~55km north of FMG’s Chichester Hub
operations
NJV production has increased to 6Mtpa following
the FMG transaction in December 2012
Quality product – “Bonnie Fines” well established in
Chinese market
A producing DSO project with access to world-class infrastructure.

17
LOM guidance of
A$46-50/wmt FOB
Platts CFR62 price of
US$105/dmt on 10 Mar 13
Note: C1 cash costs exclude royalties, marketing, head office costs and loan
interest payments.
FY14 GUIDANCE
Source: Macquarie
FY14 guidance:
NJV sales of 5.8-6.2Mt
NJV plans to operate at 6.5Mtpa for 9 months
of the year and 4.5Mtpa for the 3 months
during the January to March wet season
BCI share of sales of 4.4-4.6Mt
NJV C1 cash costs of A$46-50/wmt (FOB)
BCI C1 cash costs of A$40-44/wmt (FOB),
reflecting impact of rail and port prepayment
BCI capex of A$20M
BCI share of NJV capex (grade control drilling
at Bonnie East and Warrigal 1 & 2, pre-strip
waste mining, mining lease approval,
exploration and haul road improvements)
Exploration costs in Brazil
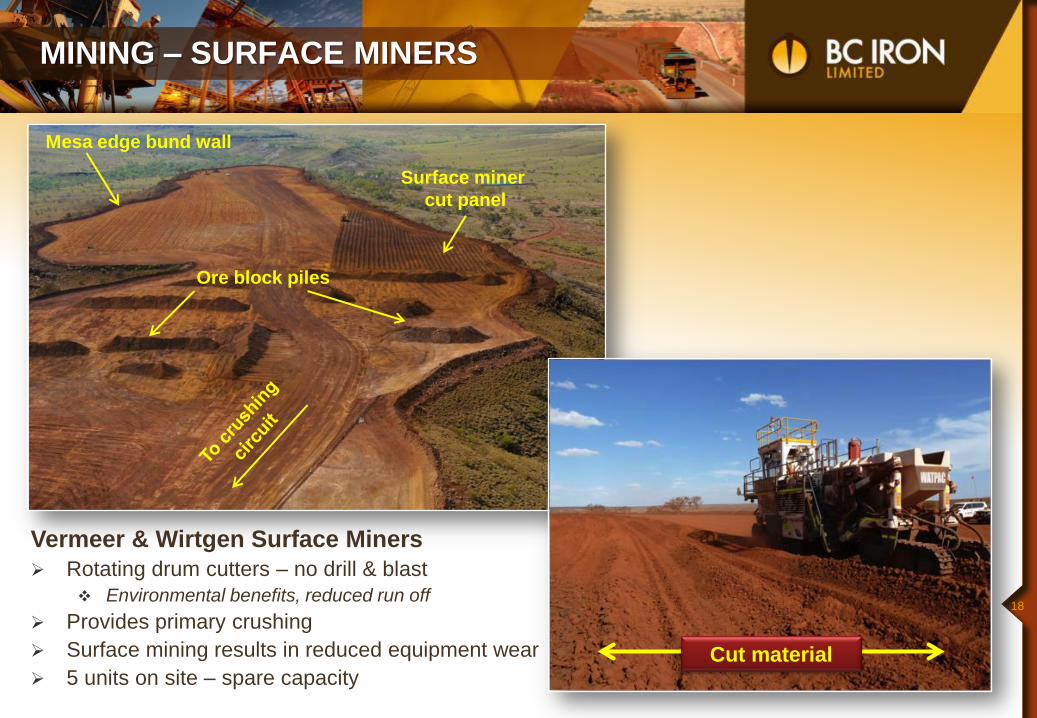
MINING – SURFACE MINERS
18
Vermeer & Wirtgen Surface Miners
Rotating drum cutters – no drill & blast
Environmental benefits, reduced run off
Provides primary crushing
Surface mining results in reduced equipment wear
5 units on site – spare capacity
Surface miner
cut panel
Mesa edge bund wall
Ore block piles
Cut material

Crushing / Screening (WATPAC)
Simple crushing & screening
process
Two plants on site
Main fixed plant
Smaller mobile plant
Nameplate rates ~6.5Mtpa
Building stockpile ‘safety net’
PROCESSING AND LOGISTICS
19
Road Haulage (Toll & Roadtrim)
Ore trucked via private sealed
road to dedicated stockyard at
Christmas Creek railhead
Toll – 8 PowerTrans units (360t)
Roadtrim – 4 Kenworth prime
movers with Howard and Porter
trailers (140-175t)
Nameplate rates ~6.5Mtpa
Rail and Port Services (FMG/TPI)
World class rail and port
Access to Capesize vessels up
to 250,000wmt
Dedicated NJV stockyards at
railhead and port
NJV capacity of 6Mtpa

BONNIE FINES OVERVIEW
20
“Bonnie Fines” pisolite sinter blend improves sintering productivity at the steel mill
High calcined Fe driven by high Loss On Ignition (LOI)
Low impurities, low ultra-fines and low moisture
Low Al and Si a particular advantage in China now, given high gangue ores being sourced from major as well as non-traditional suppliers (e.g. Iran, Indonesia)
Substitute for BHP Yandi, HIY (Rio Yandi), FMG Kings CID and FMG Super Special Fines
Can be used at 20-30% level in sinter blends
FMG provides marketing services to NJV
Bonnies Fines well accepted - consistent demand.
IMPORTANT NOTICE
This document has been prepared by BC Iron Limited (“BC Iron” or “Company”) to provide an update of BC Iron to investors and potential new shareholders.
Past performance
Past performance information given in this document is given for illustrative purposes only and should not be relied upon as (and is not) an indication of future performance.
Forward-looking statements
This document contains “forward-looking” statements or projections based on current expectations. Forward looking words such as, “expect”, “anticipate”, “should”, “could”, “may”, “predict”, “plan”, “will”, “believe”, “forecast”, “estimate”, “target” and other similar expressions are intended to identify forward-looking statements within the meaning of securities laws of applicable jurisdictions. Indications of, and guidance on, future earnings and financial position and performance are also forward-looking statements.
Forward-looking statements include, among other things, statements regarding targets, estimates and assumptions in respect of iron production and prices, operating costs and results, capital expenditures, mineral reserves and mineral resources and anticipated grades and recovery rates. Forward-looking statements, opinions and estimates provided in this document are based on estimates and assumptions related to future business, economic, market, political, social and other conditions that, while considered reasonable by BC Iron, are inherently subject to significant uncertainties and contingencies. Many known and unknown factors could cause actual events or results to differ materially from estimated or anticipated events or results reflected in such forward-looking statements. Such factors include, but are not limited to: operating and development risks, counterparty risks, iron ore price risk and a number of other risks and also include unanticipated and unusual events, many of which are beyond BC Iron’s ability to control or predict.
The forward-looking statements only speak as at the date of this document and, other than as required by law and the ASX Listing Rules, BC Iron disclaims any duty to update forward looking statements to reflect new developments.
Not financial product advice
This document is for information purposes only and is not financial product or investment advice nor a recommendation to acquire BC Iron shares. It has been prepared without taking into account the objectives, financial situation or needs of individuals. Before making an investment decision, prospective investors should consider the appropriateness of the information having regard to their own objectives, financial situation and needs and seek legal and taxation advice appropriate to their jurisdiction. BC Iron is not licensed to provide financial product advice in respect of BC Iron shares. Cooling off rights do not apply to the acquisition of BC Iron shares.
21

22
Optimising the NJV | Paying dividends | Considering growth

Level 1, 15 Rheola Street
West Perth, WA, Australia
Phone : +61 8 6311 3400
email : [email protected]
www.bciron.com.au
ASX:BCI