Embed Size (px)
Citation preview
Towards a National Health Service

Lok Satta
2
“If you dump all the drugs and formulations
listed in Materia Medica into the ocean, mankind
will be that much better off and fish will be that
much worse off”

Lok Satta
3
Achievements Through The Years - 1951-2000Indicator 1951 1981 2000
Demographic Changes
Life Expectancy 36.7 54 64.6(RGI)
Crude Birth Rate 40.8 33.9(SRS) 26.1(99 SRS)
Crude Death Rate 25 12.5(SRS) 8.7(99 SRS)
IMR 146 110 70 (99 SRS)
Epidemiological Shifts
Malaria (cases in million) 75 2.7 2.2
Leprosy cases per 10,000 population 38.1 57.3 3.74
Small Pox (no. of cases) >44,887 Eradicated
Guinea worm ( no. of cases) >39,792 Eradicated
Polio 29709 265
Infrastructure
SC/PHC/CHC 725 57,363 1,63,181 (99-RHS)
Dispensaries & Hospitals (all) 9209 23,555 43,322 (95–96-CBHI)
Beds (Pvt & Public) 117,198 569,495 8,70,161 (95-96-CBHI)
Doctors (Allopathy) 61,800 2,68,700 5,03,900 (98-99-MCI)
Nursing Personnel 18,054 1,43,887 7,37,000 (99-INC)
Source: National Health Policy – 2002

Lok Satta
4
Difference Between Actual and Sustainable Number of PhysiciansGDP group Country Physicians per 10,000 population
Actual Sustainable Excess or shortage
GDP less than US $ 800 per capita
Brazil 4.6 3.2 +1.4
Egypt 5.5 1.6 +3.9
India 2.1 0.6 +1.5
Indonesia 0.3 0.7 -0.4
Iran 3.1 3.1 0.0
Pakistan & Bangladesh 3.9 1.2 +2.7
Philippines 3.5 1.3 +2.2
Sri Lanka 2.5 1.2 +1.3
GDP US $ 800 to US $ 2,000 per capita
Greece 16.7 9.0 +7.7
Ireland 11.8 11.0 +0.8
Romania 13.1 9.0 +4.1
Venezuela 9.3 8.6 +0.7
GDP over US $2,000 per capita
Australia 13.9 26.5 -12.7
Federal Republic of Germany 17.7 29.0 -11.3
Japan 11.4 16.1 -4.7
United Kingdom 13.3 18.5 -5.2
United States of America 15.5 49.0 -33.5
Source: WHO Technical Report – Migration of Physicians and Nurses (1979)

Lok Satta
5
Macroeconomics and Health

Lok Satta
6
Country GDP per capita (in PPP terms - $)
Health Expenditure per capita ranking (in $ terms)
Health Level Ranking (DALE)
Low Income Countries
Sri Lanka 3530 138 76
Indonesia 3043 154 103
Pakistan 1928 142 124
Egypt 3635 115 115
India 2358 133 134
Middle Income Countries
Russian Federation 8377 75 91
South Africa 9401 57 160
Brazil 7625 54 111
GDP Per-capita, Health Expenditure DALE Rankings
OECD Countries
United States 34142 1 24
France 24223 4 3
Germany 25103 3 22
Japan 26755 13 1
United Kingdom 23509 26 14
Sources: The World Health Report – 2000 and UNDP Human Development Report – 2002 (UNDP)

Lok Satta
7
Allocation vs Prioritization

Lok Satta
8
Limits to Modern Medicine
Spectacular Advances – Low
Cost
Nutrition, Immunization, Antibiotics, Aseptic surgery, Maternal and child care, Healthy life styles
Grey Areas –High Cost
Degenerative diseases, Autoimmune diseases, Malignancies
Dark Areas Idiopathic, Iatrogenic, Hospital Infections, Progressive, irreversible disorders

Lok Satta
9
1990 1999
Public health expenditure
1.3% GDP 0.9% GDP
Union budgetary allocation
1.3% 1.3%
States’ budgetary allocation
7% 5.5%
Total per-capita public health expenditure
Rs 200 (15% Union, 85% States)
Health Financing

Lok Satta
10
Public Health vs Total Health Expenditure
Total Health Expenditure
5.2% GDP
Comparable countries:
o Cambodia
o Burma
o Afghanistan
o Georgia
83%
17%
0%
10%
20%
30%
40%
50%
60%
70%
80%
90%
100%
Private Public
Lok Satta
11
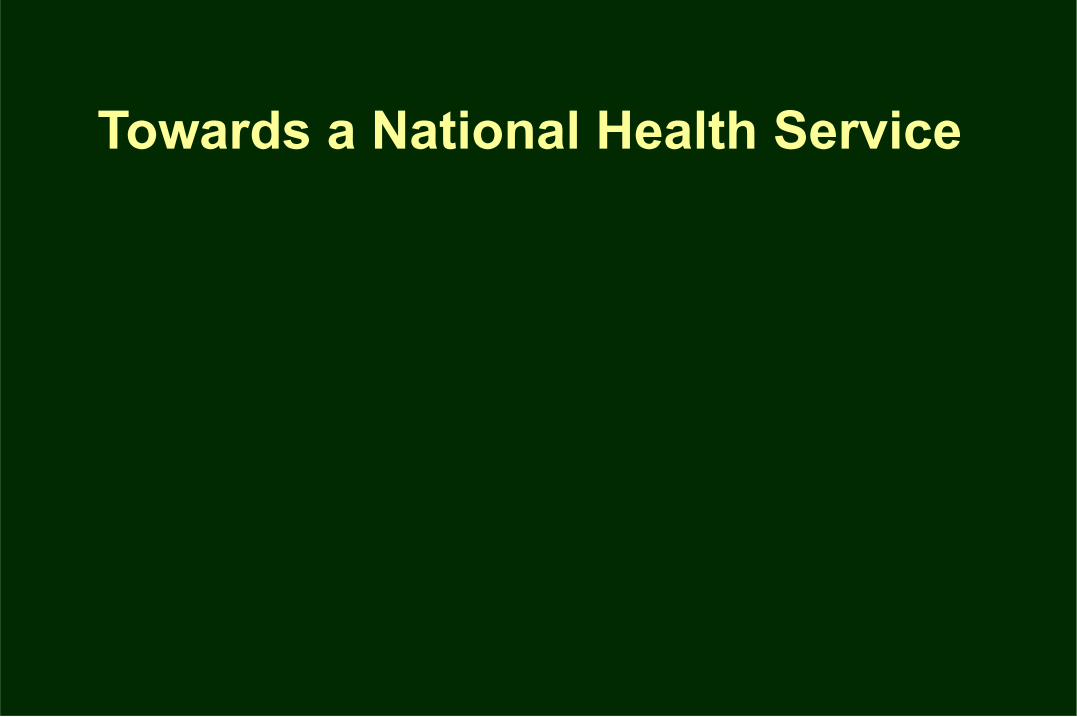
Public Health Expenditure among Various Countries
Country
Public health expenditure as share of GDP
Private health expenditure as share of GDP
Norway 6.5 1.1
Sweden 6.2 1.8
Japan 5.9 1.8
United Kingdom 5.9 1.4
United States 5.8 7.3
Egypt 1.8 2.3
Sri Lanka 1.8 1.9
India 0.9 4.3

Lok Satta
12
Allocations in Public Health Expenditure
Consumption Exp 97%
Capital Exp 3%
Salaries 60%
Material & supplies 35%
Curative Services 60%
Public health & family welfare
26%
Miscellaneous & Administration
14%

Lok Satta
13
Health Financing & Inequity
Curative services favour the rich
For every Re 1 spent on poorest 20% population,
Rs 3 spent on the richest quintile

Lok Satta
14
Proportion of Public Expenditures on Curative Care, by Income Quintile, All India, 1995-96
0
5
10
15
20
25
30
35S
har
e of
Pu
bli
c S
ub
sid
y
Poorest20%
2nd Middle 4th Richest20%
Income Quintiles

Lok Satta
15
Out-of-Pocket Payments for Health and Household Income, All India, 1995-96
0
100
200
300
400
500
600
700
Poorest 20% 2nd Middle 4th Richest 20%
Income Quintiles
Per
ca
pit
a P
riv
ate
exp
end
itu
re
( R
s.)
Out of pocket to public facilities Out of pocket to private facilities
Lok Satta
16
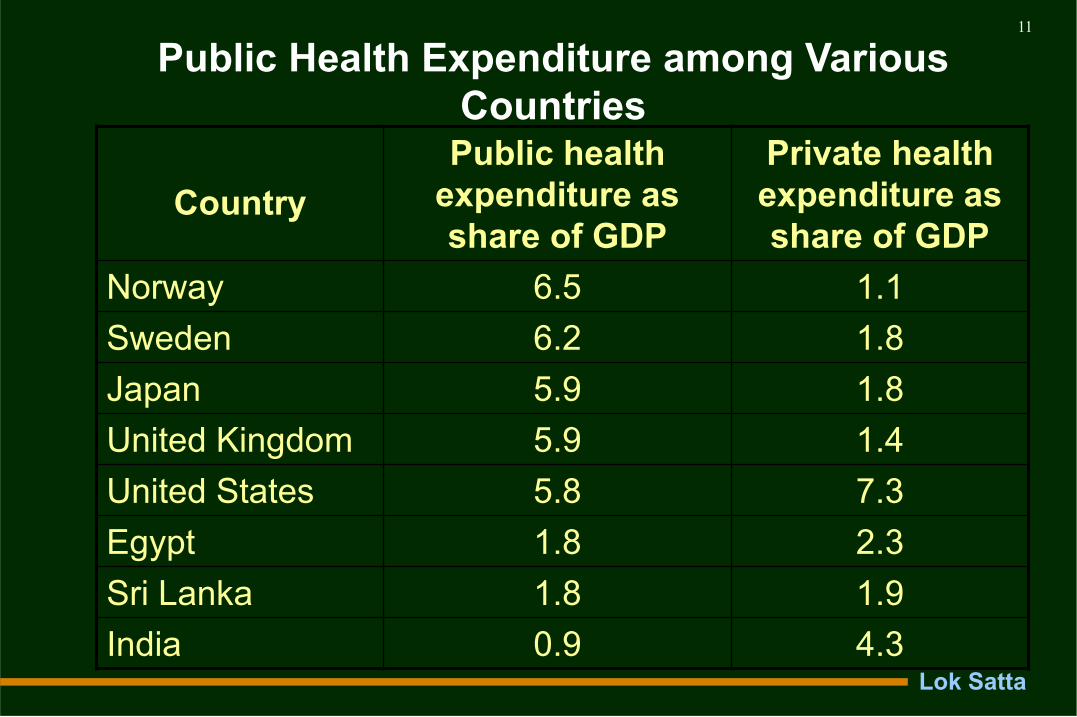
Hospitalization – Financial Stress
Only 10% Indians have some form of health
insurance, mostly inadequate
Hospitalized Indians spend 58% of their total
annual expenditure on health care
Over 40% of hospitalized Indians borrow heavily or
sell assets to cover expenses
Over 25% of hospitalized Indians fall below poverty
line because of hospital expenses

Lok Satta
17
Percent of Hospitalized Indians falling into Poverty

Lok Satta
18
Rural Urban
1986 – 87 1995 – 96 1986 – 87 1995 – 96
Outpatient care
Public Sector 25.6 19.0 27.2 19.0
Private Sector 74.5 80.0 72.9 81.0
Inpatient care
Share of public sector 59.5 45.2 60.3 43.1
Share of private sector 40.3 54.7 39.7 56.9
Source: David.H.Peters, Abdo.S.Yazbeck, Rashmi R. Sharma, G.N.V. Ramana, Lant H. Pritchett, Adam Wagstaff, Better Health System For India’s Poor: Findings Analysis and Options, The World Bank, 2002, Washington. p.5
Public – Private sector use for patient care – All India (percentage distribution)

Lok Satta
19
Sector Population BPL (%)
IMR/ Per 1000 Livr
Births (1999 – SRS)
<5Mortality per 1000 (NFHS II)
Weight For Age - % of Children
Under 3 years
(,2SD)
MMR / Lakh
(Annual Report 2000)
Leprosy cases per
10000 population
Malaria +ve Cases
in year 2000 (in
thousands)
India 26.1 70 94.9 47 408 3.7 2200
Rural 27.09 75 103.7 49.6 - - -
Urban 23.62 44 63.1 38.4 - - -
Better Performing States
Kerala 12.72 14 18.8 27 87 0.9 5.1
Maharashtra 25.02 48 58.1 50 135 3.1 138
Tamil Nadu 21.12 52 63.3 37 79 4.1 56
Low Performing States
Orissa 47.15 97 104.4 54 498 7.05 483
Bihar 42.60 63 105.1 54 707 11.83 132
Rajasthan 15.28 81 114.9 51 607 0.8 53
UP 31.15 84 122.5 52 707 4.3 99
MP 37.43 90 137.6 55 498 3.83 528
Source: National Health Policy, 2002
Differentials in Health Status Among States

Lok Satta
20
Major Indian States, by Stage of Health Transition and Institutional Capacity
Stage of Transition, Degree of Capacity
States India’s Population (percent)
Middle to late transition, moderate to high capacity
Kerala, Tamil Nadu 9.1
Early to middle transition, low to moderate capacity
Maharashtra, Karnataka, Punjab, West Bengal, Andhra Pradesh,
Gujarat, Haryana
39.1
Very early transition, very low to low capacity
Orissa, Rajasthan, Madhya Pradesh, Uttar Pradesh
33.1
Special cases: instability, high to very high mortality, civil conflict, poor governance
Assam, Bihar 13.3
Note: Major Indian states are those with a population of at least 15 million. The estimates were made before bifurcation, so Bihar includes the recently created state of Jharkhand, Madhya Pradesh includes Chattisgarh, and Uttar Pradesh includes Uttaranchal
Source: David.H.Peters, Adbo.S.Yazbeck, Rashmi R. Sharma, G.N.V. Ramana, Lant H. Pritchett, Adam Wagstaff, Better Health System for India’s Poor: Findings Analysis and Options, The World Bank, 2002, Washington. p.8

Lok Satta
21
Strengths & Opportunities
Large skilled health manpower
Significant research capability
Growing hospital infrastructure
Mature pharmaceutical industry
Democratic system and public discourse
Increasing demand for health services
Willingness to pay for health
Breakthrough on population front ( TN, AP etc)
Effective military style campaigns (smallpox, pulse
polio)
Wide network of RMPs

Lok Satta
22
Challenges of the Future
Immunization coverage ( TB: 68%, Measles: 50%,
DPT: 70%, overall : 33%)
Four major infectious diseases: Malaria, TB,
HIV/AIDS, RHD
Preventable blindness
Population control – large northern states
Public health expenditure share
Sanitation ( 70% households without toilets)

Lok Satta
23
Challenges of the Future
Accountability in public health care
High out-of-pocket health expenditure
Alternative systems – integration
Unqualified PMPs
Mounting cost of hospital care
Decline in family care – over-specialization
Ideal vs Optimal care
Health manpower training – inadequacies
Regional inequalities

Critical Issues
How to involve community in rural health care
How to provide effective and affordable family care
to urban populations
How to promote public-private partnerships
How to extend tertiary care to poor
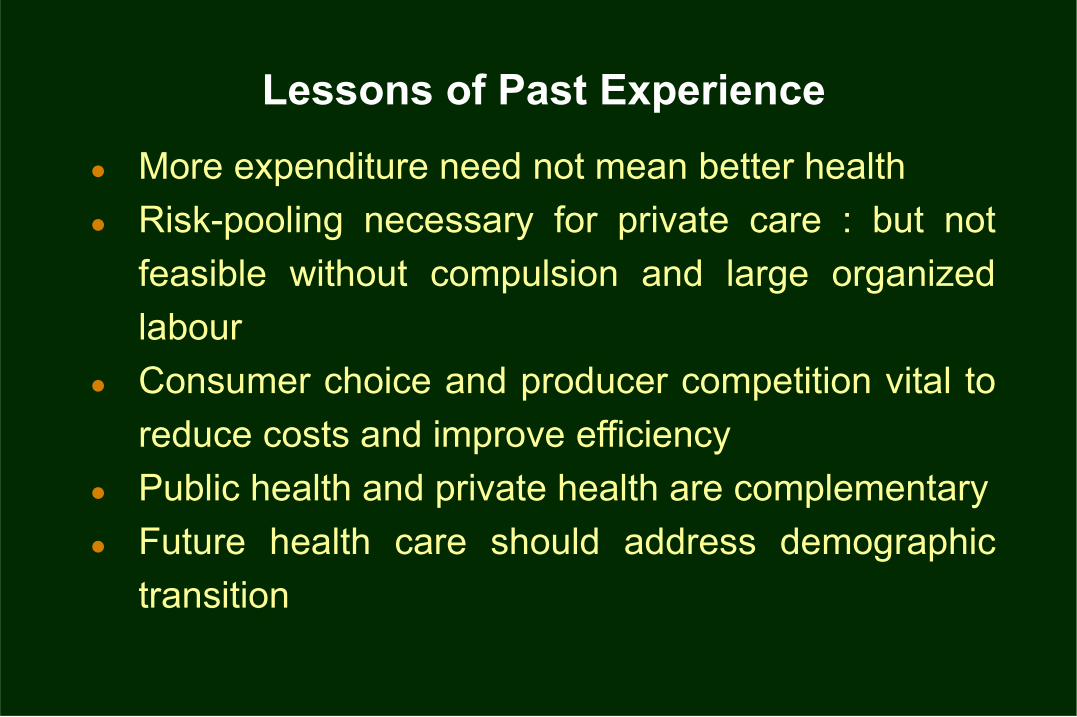
Lessons of Past Experience
More expenditure need not mean better health
Risk-pooling necessary for private care : but not
feasible without compulsion and large organized
labour
Consumer choice and producer competition vital to
reduce costs and improve efficiency
Public health and private health are complementary
Future health care should address demographic
transition

Community ownership, decentralization and
accountability – key to better delivery
Better health care delivery should be linked to
massive employment generation
Low-cost – high-impact solutions are possible
We have great strengths and abilities which can be
leveraged at low cost
Lessons of Past Experience

Agenda for Action
Raising an Army of Community Health Volunteers
Strengthening the Primary Health Care Delivery
System
National Mission for Sanitation
Taluk / Block Level Referral Hospitals for Curative
Care
Risk-Pooling and Hospital Care Financing
Eight Task Forces

Lok Satta
28
Raising an Army of Community Health Workers
Women from the community
One VHW per 1000 population (a million gainfullyemployed)
Urban Health Worker (UHW) in areas inhabited by lowincome and poor populations.
3 months’ training (Union) + health kit + refreshercourses
Accountable to village Panchayat
Honorarium of Rs.1000 / month
User charges as prescribed by Panchayat
Incentives for performance

Lok Satta
29
Raising an Army of Community Health Volunteers
Fund Requirements
Training : Rs.200 crores per year for training ofVHWs/UHWs spread over three years– borne by the Union
Honorarium : Rs 1200 crore per annum towardshonorarium (shared equally by Union
and states)
Health kits : Rs 100 crore per annum – health kit, afew generic drugs etc. (shared equally byUnion and states)
Refresher workshop: Rs. 50 crore per annum – 2 refresherworkshops – 3 days each (sharedequally by Union and states)

Lok Satta
30Strengthening of Primary Healthcare Delivery System
Addressing shortage of doctors in 8 states
Addressing shortage of other paramedical staff
Direct Union Financing of Male MPWs
Provisioning of 35 essential drugs in all PHCs
Intensification of ongoing communicable disease controlprogrammes
Urban health posts
New programmes for the control of non-communicablediseases
Upgradation of PHCs in order to provide 24 hourdelivery services

Lok Satta
31
Strengthening the Primary Health Care Delivery System
Male MPWs : Rs. 828 crores/year
Supply of listed drugs : Rs. 500 crores/year
Intensification of ongoing
disease control programmes : Rs. 500 crores/year
Urban health posts : Rs. 200 crores/year
Control of non-communicable diseases : Rs. 260 crores/year
Upgradation of PHCs for 24-hour delivery : Rs 480 crores /year
Supply of auto-destruct syringes : Rs 60 crores / year
---------------------------
Total : Rs. 2828 crores/year---------------------------

Lok Satta
32
National Mission for Sanitation
Great Sanitation Movement
Health, hygiene, dignity and aesthetics
A toilet for every household
100 million toilets in 5 years
50 million units with private funds + 50 million with
subsidies

Lok Satta
33
National Mission for Sanitation
Fund Requirements
50 million toilets - Rs. 12000 crore – Union+States(one-time
allocation)
The Union’s share will be Rs 8000 crore. Spread over 5
years at 10 million toilets a year, this will mean an allocation
of Rs 1600 crore per year for the Union and Rs 800 crore
per year for all states put together.
Annual fund requirement for 5 years : Rs. 2400 crore.
In addition, a national public health education programme
and propagation of technology may cost Rs 100 crores per
year. The Union may take up this campaign.
Annual fund requirement for 5 years : Rs. 100 crore

Lok Satta
34
Taluk / Block Level Referral Hospitals
Referral Hospitals
One 30-50 bed referral hospital for every 100,000population
– Staff – One Civil Surgeon, 3 or 4 Civil AssistantSurgeons, a dentist, 7 or 8 staff nurses and 2paramedical personnel
To be controlled by the local government (districtpanchayat or town/city government).
Recruitment, appointment, control and financialprovision by local government, with full assistancefrom state and Union governments in the form ofgrants

Lok Satta
35
Taluk / Block Level Referral Hospitals for Curative Care
Fund Requirements
Capital cost of 7000 CHCs at Rs. 1 crore each =
Rs. 7000 crores
Annual cost (spread over five years) = Rs. 1400
crores

Lok Satta
36
Risk Pooling and Hospital Care Financing
Traditional health insurance is not an answer for
health care requirements of poor
Most of the disease burden is a consequence of
failure of primary care
Public health system is in disarray
National health insurance will further strengthen
private providers at the cost of public exchequer

Lok Satta
37
Health Insurance – Objectives
Strengthen public health care
Raise resources innovatively and make the programmesustainable.
Ensure access and quality of service to those with noinfluence or voice
Create incentives and risk-reward system to promotequality health service delivery
Encourage competition among health care providers
Ensure choice to patients among multiple serviceproviders
Encourage public-private partnerships

Lok Satta
38
Risk-Pooling and Hospital Care Financing
Financing by the Union, State and citizens (those abovepoverty), pooling Rs. 90-100 per capita
Citizens’ share to be collected by the local governments ascess/tax
Pooling of the money at the District level with a new authority –District Health Board (DHB) under the overall umbrella of electedlocal governments
Patients will have a choice to visit any public hospital
There will be no separate budget for wages and maintenance, ornew equipment
The public hospital care costs will be reimbursed by DHB /money follows the patient
Reimbursement will be based on standard costs and services

Lok Satta
39
Risk-Pooling and Hospital Care Financing
Where necessary DHB will involve private providers on the samebasis
A phased programme will be evolved for existing public hospitalsto give time for transition
A part of the fund (15% ) will be separately administered fortertiary care / teaching hospitals at the State level
Patients can go to tertiary hospitals only in emergencies or uponreferral by secondary care hospitals
All vertical programmes will be integrated and controlled at DHBlevel
There will be an independent Ombudsman in each district There will be regular health accounting to trace expenditure flows,
analyze costs and benefits, and demand and supply This will be the precursor of a National Health Service which
serves all people at low cost

Lok Satta
40
Risk-Pooling and Hospital Care Financing
Estimated population covered : Rs. 60 crore
Per capita cost of risk pooling (hospital costs) : Rs. 100 / year
-----------------------------
Total cost * : Rs. 6000 cr. / year
------------------------------
* This will be in addition to the current allocations.

Lok Satta
41
Task Forces
Reproductive and child health and birth control inhigh fertility states
Convergence and integration of services
Medical education and Medical Grants Commission
Training of Voluntary Health Workers
Regulation of medical care and medical ethics
Regulation of medical profession
Accreditation and integration of rural medicalpractitioners (RMPs) into health system
Health financing mechanisms

Lok Satta
42
Interventions Proposed
Current Structure Interventions Proposed
District
CHCs (3100)
PHCs (23000)
Sub Centre(137000)
Village / Community
District Health Board+District Health Fund+ Integrate all vertical
programs
7000 New CHCs+ Funding only for services
delivered
Supply of drugs + Improvement of facilities+ Strengthening programs
Multipurpose Health Workers (Fill all vacancies) + Drug supply
100 million household toilets(50 million with government subsidy)1 million VHWs / UHWs + Training +Kits
3
4
5
2
1

Lok Satta
43
Total Additional Funding Requirement for Health Care Interventions
The above five recommendations are in line with the commitments made underthe NCMP in health sector. As stated earlier, they are in addition to the on-goingprogrammes and the Tenth Plan commitments. The total additional costs (excluding capital costs for sanitation and referral hospitals) will be of the order ofRs. 14,000 crore per annum – about 0.35% of GDP
The total estimated financial outlay of these proposals is as follows:
Community Health Workers (Recurrent cost) Rs. 1550 crores/year
Strengthening Primary Health care (Recurrent cost) Rs. 2828 crores/year
National Sanitation Mission (Capital cost) Rs. 2500 crores/year
First Referral Hospitals (Capital cost) Rs. 1400 crores/year
Risk-pooling and Hospital care financing
(Recurring cost) Rs. 6000 crores/year
----------------------------
Total Rs.14278 crores/year
----------------------------
Lok Satta
44
“Politics encircles us today like the coil of a snake
from which one cannot get out, no matter how
much one tries ”
- Mahatma Gandhi