Embed Size (px)
DESCRIPTION
A presentation by Mike Vincent, petroleum engineer and consultant with Insight Consulting, delivered in early May 2014 at an SPE local chapter meeting in Horseheads, NY. Mike reveals a great deal of information learned over the past 10 years or so of active hydraulic fracturing of shale wells across the U.S. These slides are loaded with hints, tips and superb data to help those in the industry do a better job with fracing and refracing.
Citation preview

1
Confessions of a Frac Engineer:
Your Reservoir is Much More Productive
than we Thought…
It’s my Frac that is Failing
Mike Vincent
Fracwell
LLC
Microseismic image: SPE 119636
• Goals of fracturing and incredible industry achievements
• Shock and Awe
– Irrefutable field data we can no longer ignore
– Fracs do NOT perform like we thought
• Plausible Mechanisms responsible for underperformance
• Evidence we can do better
– Field Results – Refracs, improved frac designs
– We often incorrectly blame underperformance on insufficient reservoir
quality.
– It is now clear that the formations have greater potential than we
thought! The fracs are not capturing well potential.
Outline

2
• Adequate reservoir contact (frac length)
• Adequate flow capacity (conductivity)
Two basic design goals
for fracture treatment
Reservoir Contact
Unstimulated Wells:
high matrix velocities
pressure losses in rock
restrict production
Hydraulically fractured well – increase effective
wellbore radius
Collect hydrocarbons over larger area

3
Reservoir Contact – Vertical Well
h = 50 ft
15 m
Formation
thickness
Openhole completion: 8¾” hole yields 8¾ / 12 * π * 50 ft = 115 ft2 11m 2 of contact
Cased hole completion: 2 shots per foot, with 4 inches of penetration beyond cement
100 perf tunnels, ½ inch diameter: 100 * 0.5 / 12 * π * 4 / 12 = 4 ft2 0.4m2 of contact
Reservoir Contact – HZ Well
Uncemented lateral: 8¾” hole @ 3000 ft = 6900 ft2 640m2 of contact
Uncemented, Unstimulated Multi-Lateral – 15,000 ft of drilled length in 5 laterals
24,000 ft2 2200m2 of contact
Overhead, map view of 5 laterals
drilled from one wellhead.
Increased reservoir contact!
4
Reservoir Contact – Tiny Frac (20,000 lbs, 9Tonnes)
h = 50 ft.
Formation
thickness
Fracture Stimulated Completion: 200 ft half-length, 50 ft height
2 wings * 2 faces * 200 ft * 50 ft = 40,000 ft2 3700m2 of contact
Lf = 200 ft.
Half-length
Even with the smallest conceivable contact (simple, planar, small frac) a propped
fracture may increase your reservoir contact by 350 to 10,000 times!
Many unconventional reservoirs are treated with over 1 million pounds [500T] of
proppant, 50 times that shown above!
Image not to scale. Not even close!
One small transverse frac = 40,000 ft2 3700m2 of contact
Bakken = 6,000,000 ft2 560,000m2 of contact
Barnett style complex network >10,000,000 ft2 >1,000,000m2 of contact
Transversely Fractured Horizontal
Wells let you Repeat this!

5
Technology Progression
0.0001
0.001
0.01
0.1
1
10
0
1
10
100
1,000
10,000
100,000
1,000,000
PerforatedVertical
OpenholeVertical
OpenholeHorizontal
BiwingFracture
MultipleTransverseFractures
Re
se
rvo
ir P
erm
mD
Re
se
rvo
ir C
on
tac
t m
2
Reservoir Contact
Economic Gas Reservoir Perm
Economic Oil Reservoir Perm
Increasing our reservoir contact by 1,000,000 fold
has allowed pursuit of reservoirs with thousands of times lower perm.
Tremendous (partially recognized) impact on global reserves
• Adequate reservoir contact (frac length)
• Adequate flow capacity (conductivity)
Two basic design goals
for fracture treatment
6
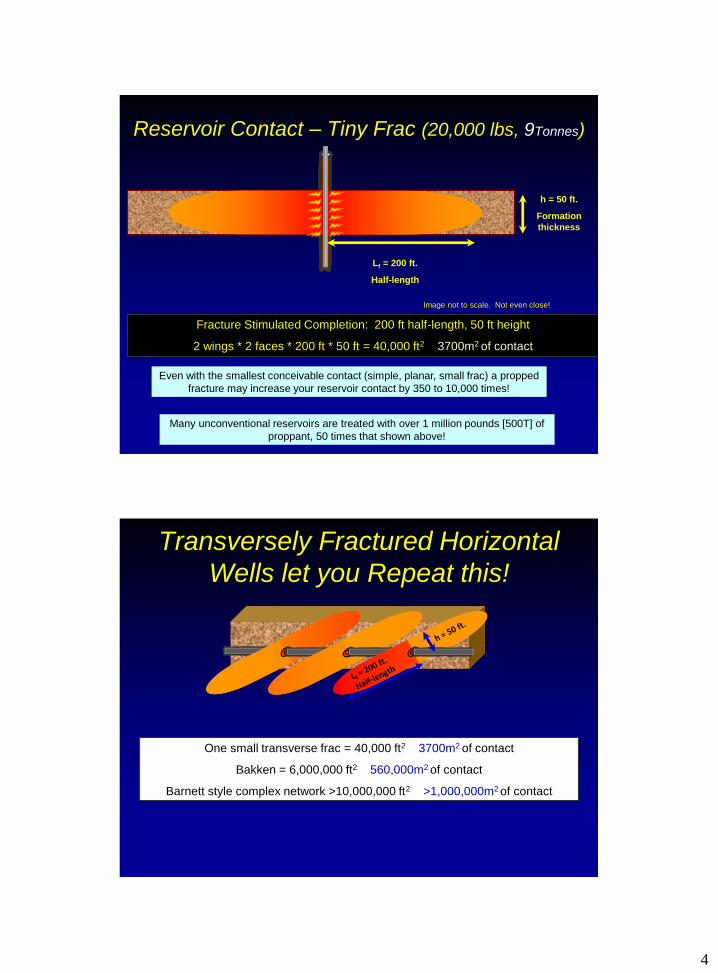
How big is 10,000,000 ft2 of contact?
Images: ESPN, BSOblacksportsonline; Wikipedia, ticketini, turnerconstruction.com
290 yds x 215 yds = ~560,000 ft2Architect claims 1.7mm ft2 including all decks, concourses, stairs, etc
So maybe envision 18 NFL
stadium footprints as the surface
area of contact.
How large are the connections between a
transverse frac and the wellbore?
Images: ebay, us-cash.info
Cemented & Perfed:Suppose we have four perfs in a cluster that are connected
to the frac. Suppose they erode to ¾” diameter
Footprint of 4 dimes ~ 1.6 in2
Openhole, uncemented:Suppose frac is 1/10” wide after closure. Suppose perfect
full circumference connected around 6” hole (~18”
circumference). 1.8 in2 About 1/10th of a $5 bill
If I optimistically assume I successfully
initiate and sustain 100 transverse fracs, I
get a connection equivalent to 10 bills

7
Ratio: contact to connection?
The cumulative area of connection of 100
perfectly executed transverse fracs is
about the size of one hash mark
Images: ESPN, BSOblacksportsonline; Wikipedia, footballidiot.com
The frac conductivity may be a bottleneck!?!
10,000,000 ft2 : 180 in2
8 million :1
Envision 18 NFL stadium footprints as
reservoir contact.
We erroneously anticipated infinitely conductive, durable fracs.
Therefore, we fail to predict the large production benefits when
improving proppant quality, size, concentration…
Fracs are not behaving like we thought.
We are clearly not “optimized”!
Some field examples that challenge
our understanding

8
Microseismic mapping – tight gas sand
-1000
-900
-800
-700
-600
-500
-400
-300
-200
-100
0
100
200
300
400
500
600
700
800
900
1000
1100
1200
1300-1
200
-1100
-1000
-900
-800
-700
-600
-500
-400
-300
-200
-100 0
100
200
300
400
500
600
700
800
900
1000
1100
1200
West-East (ft)
So
uth
-No
rth
(ft
)
21-04
16-34R
55-34
53-34
Well B designated monitor well,
not completed.
Based on this would you frac it?
Well A & D came on at 8 mmcfd.
Well C came on at 7 mmcfd
(within normal variability)
Well B was eventually frac’d,
came on at 7 mmcfd, no
indication of detrimental impact
or interference with surrounding
wells.
After 1 year, most declined to
3 mmcfd. After 5 years all
around 1 mmcfd
No apparent interaction
Well A
Well B
Well C
Well D
Microseismic mapping – tight gas sandCan we blame lack of
continuity on reservoir
complexity?
7900
8000
8100
8200
8300
8400
8500
8600
8700
8800
8900
9000
9100
9200
9300
9400
9500
9600
9700
9800
9900
10000
10100
10200
10300
10400
10500
10600
10700
10800
10900
11000
-800 -700 -600 -500 -400 -300 -200 -100 0 100 200 300 400 500 600Distance Along Fracture (ft)
MD
(ft
)
Depth
Or does it suggest our frac
design should be altered?

9
-2000
-1800
-1600
-1400
-1200
-1000
-800
-600
-400
-200
0
200
400
600
800
1000
1200
1400
1600
1800
2000
2200
2400
2600
2800
3000-3
500
-3300
-3100
-2900
-2700
-2500
-2300
-2100
-1900
-1700
-1500
-1300
-1100
-900
-700
-500
-300
-100
100
300
500
700
900
1100
1300
1500
West-East (ft)
So
uth
-No
rth
(ft
)
1st Stage 2nd Stage
= First Stage Perf Clusters
= 2nd Stage Initial Perf Clusters
= Revised 2nd Stage Perf Clusters
Observation Well
Treatment Well
3000’ x 2900’
Fracs can have enormous reach
Two Stage Cemented Barnett Shale Lateral
SPE 90051
Fracs can extend
>1500 feet
We know we can bash
offset wells with both
water and RA tracer
9 million square feet
>200 acres
How far do we drain? Barnett Infill Drilling
Source: Brian Posehn, EnCana, CSUG April 28, 2009
When
operators
have infill
drilled on
385’ avg
spacing
Infill wells
“steal” 6%
of parent
EUR
Infill wells
produce
80% of
parent EUR
10
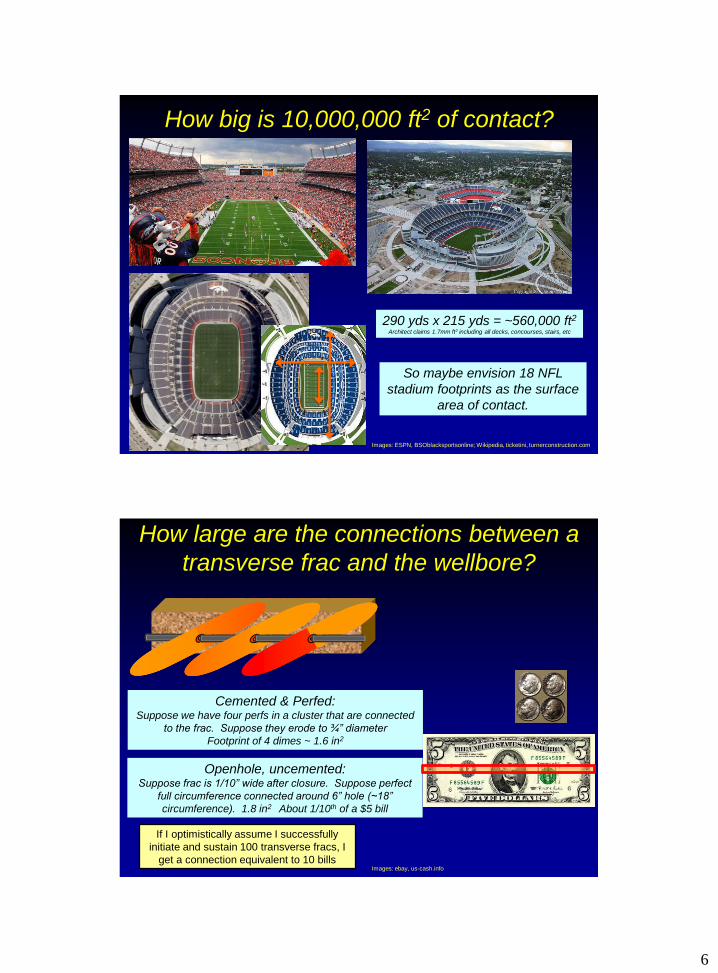
How far do we drain? Ante Creek, Montney Oil
Source: ARC Investor Presentation Nov 2012
16 years later
encountering
near-virgin
pressure.
Demonstrates
that initial wells
were insufficient
to recover all
available
reserves.
Is this due solely
to reservoir
discontinuity?
Well locations?
Frac
insufficiency?
Offset wells (orange)
perfed at same depth
loaded with frac fluid
After unloading fluid,
several offset wells
permanently stimulated
by treatment!
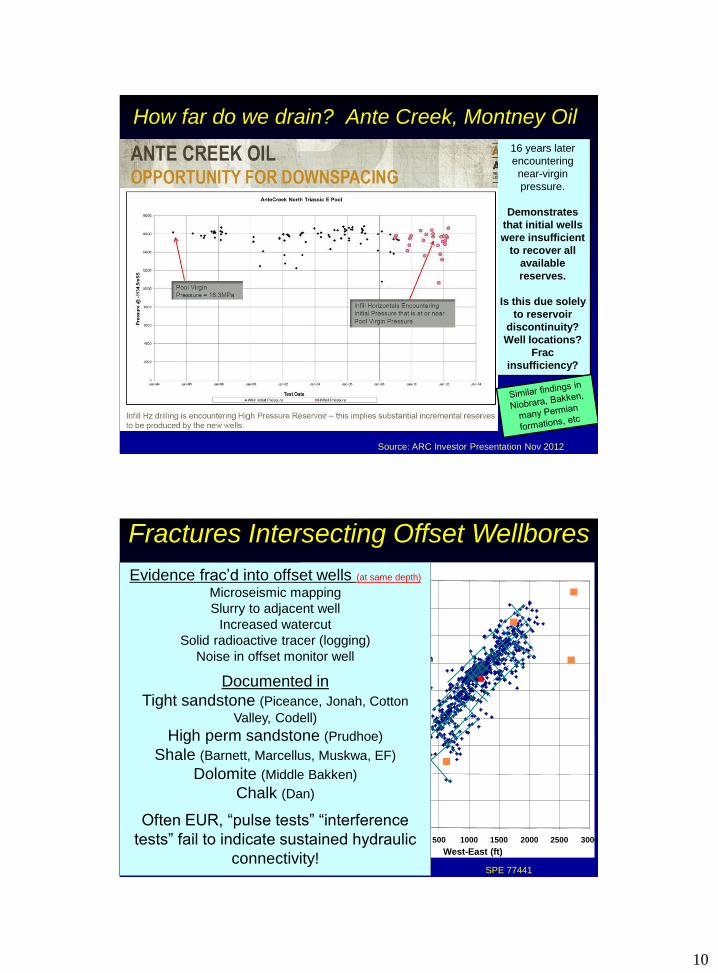
Fractures Intersecting Offset Wellbores
-3000
-2500
-2000
-1500
-1000
-500
0
500
1000
1500
-1000 -500 0 500 1000 1500 2000 2500 3000
West-East (ft)
So
uth
-No
rth
(ft
)
Observation
Well
Barnett Shale
SPE 7744124
Evidence frac’d into offset wells (at same depth)
Microseismic mapping
Slurry to adjacent well
Increased watercut
Solid radioactive tracer (logging)
Noise in offset monitor well
Documented in
Tight sandstone (Piceance, Jonah, Cotton
Valley, Codell)
High perm sandstone (Prudhoe)
Shale (Barnett, Marcellus, Muskwa, EF)
Dolomite (Middle Bakken)
Chalk (Dan)
Often EUR, “pulse tests” “interference
tests” fail to indicate sustained hydraulic
connectivity!

11
• Sometimes adjacent wells are improved by bashing!
Fractures Intersecting Bakken Laterals
Enerplus SPE 139774 – Jan 2011
Well spacing ~1250 ft. Communication at 2500 ft
8 BASS stages @150klbs 30/50 MgLite
Borate XL fluid to 5-6 ppg at tail
Haynesville Beneficial Interference Example
26
Offset well (900 ft away)
completed in 14 stages, SW +10#
linear
175,000 bbl
6.8 mmlbs 100 mesh, 40/70
Ottawa, 40/70 THS
Max concentration 2.3 ppg
Gas 3.5 to 5 mmcfd
FTP 2200 to 7000+ psi
Water 20 to 50+ bwpd
Permission secured to share without operator name

12
These examples are perhaps subject
to interpretation . . .
• Are there irrefutable examples that demonstrate
fracs may not be highly conductive, durable
conduits as traditionally implemented?
Marcellus Fractures Intersecting Offset Laterals
Mayerhofer SPE 145463 – Nov 2011
Pinnacle and Seneca
Marcellus - Slickwater
Microseismic, DFITS, downhole pressure
gauges, PTA, chemical tracers, production
interference
950 ft spacing. 1H treated 5 weeks after 2H
Cemented, 7 stage PnP
Slickwater 100 mesh, 40/70 and 30/50 sand
~6000 ft TVD
Pressure communication in 6 of 7 stages
Chem tracers from 2,3,5,6,7 recovered in 2H
After 6 months of production, each well
produced ~1 mmcfd
When one well is shut in, the other well
increases in rate by ~20% demonstrating
some degree of connection, but
clearly imperfect after 6 months.
Large pressure losses inside the
fractures. Can we fix this?

13
• SPE 140463 – Edwards, Weisser, Jackson, Marcotte [EQT&CHK]
– All diagnostics (microseismic, chemical tracers, surface pressure gauges, etc) indicate fracturing treatments interact.
– Well-to-well connection while the reservoir is dilated with frac fluid.
– Microseismic suggests lengths >1000 ft
– Production analysis estimates ~150 ft effective half length after 6 months
– However, wells drilled on 500 ft spacing are similar in productivity to those on 1000 ft spacing, suggesting they are not competing for reserves
Marcellus – Wells on 500 ft spacing do not
appear to share reserves
Eagle Ford: Fractures Intersecting Offset Laterals
Communication
during frac confirmed
with chemical tracers
The intent of zipper fracs was
to divert/deflect and not
connect fracs. Yet center 03H
well clearly communicated
with offsets during stimulation.
Murray, Santa Fe ATW, Mar 2013, and URTeC 1581750

14
Eagle Ford: Fractures Intersecting Offset Laterals
Communication
during frac evident
from treating
pressures
Murray, Santa Fe ATW, Mar 2013, and URTeC 1581750
Eagle Ford: Fractures Intersecting Offset Laterals
Murray, Santa Fe ATW, Mar 2013
Communication
during frac confirmed
with microseismic
[different well set]

15
Eagle Ford: Fractures Intersecting Offset Laterals
Eagle Ford
Communication during frac
confirmed with solid RA
tracers in most stages
Murray, Santa Fe ATW, Mar 2013, and URTeC 1581750
Cool.
All diagnostics
showed we
“communicated”
during the treatment.
Can we measure the
effectiveness and
durability of the
connecting fractures?
Eagle Ford: Fractures Intersecting Offset Laterals
Eagle Ford
Some degree of connection.
Black well is able to lower
pressure in adjacent wells
shortly after stimulation
If the fracture were an
infinitely conductive open
pipe, we would see a
pressure pulse at the speed
of sound (less than one
second) instead of 50
minutes lag time
If they were infinitely
conductive fracs, all
pressures would overlay
Clearly, the fracs should not
be envisioned as infinitely
conductive pipes.
Murray, Santa Fe ATW, Mar 2013, and URTeC 1581750

16
Eagle Ford: Fractures Intersecting Offset Laterals
3 months later, the black well
is incapable of draining gas
from offsets as fast as the
reservoir can deliver
hydrocarbons!
Lag time increased.
The wells are not redundant.
Frac connection between wells
is constraining productivity,
clearly not behaving like an
infinitely conductive frac.
Where did the created fracture
heal? Near wellbore void? At
laminations? At some distance
between wells?
Murray, Santa Fe ATW, Mar 2013, and URTeC 1581750
Woodford Shale Outcrop
If I cannot sustain lateral continuity with conventional
frac designs, what about VERTICAL continuity?
Narrower aperture plus
significantly higher stress in
horizontal steps?
Failure to breach all laminae?
Will I lose this
connection due to
crushing of proppant in
horizontal step?
Our understanding of frac
barriers and kv should
influence everything from
lateral depth to frac fluid
type, to implementation

17
Eagle Ford Shale OutcropPeschler, AAPG
Logic: Can I be creating highly conductive vertical fracs?
Either my fracs:
1. fail to penetrate all
the pay, or
2. pressure losses are
very high in my
fracs, or
3. I’m losing continuity
4. Other mechanisms
(liquid banking, etc.)
If I created this infinitely
conductive vertical frac,
lateral placement (depth)
wouldn’t significantly affect
productivity in Eagle Ford.
But it does!
[Marathon, EF Energy, SLB,
EP Energy in Aug 2013 ATW]
There are logical
adjustments to frac
design to attempt to
address each
mechanism
Laminated on every scale?
45
Figure 2 – On every scale, formations may have laminations that hinder vertical permeability and fracture penetration.
Shown are thin laminations in the Middle Bakken [LeFever 2005], layering in the Woodford [outcrop photo courtesy of
Halliburton], and large scale laminations in the Niobrara [outcrop and seismic images courtesy of Noble]
SPE 146376

18
Fractures Intersecting Stacked Laterals
Modified from Archie Taylor SPE ATW – Aug 4 2010 46
23 ft thick Lower Bakken Shale
Frac’ed Three Forks well ~1MM lb proppant in 10 stages
1 yr later drilled overlying well in Middle Bakken;
Kv<0.000,000,01D (<0.01 µD)
kv/kh~0.00025
Lateral separation 250 feet at
toe/heel, crossing in middle
Upper well interpreted to add
>400 mbo reserves
Bakken – Three Forks
Other Bakken Operators – Well Spacing Pilots
Kodiak O&G Sept 2013 Barclays Energy Conference48

19
Same Challenge in Montney?
ARC Investor Presentation, April 201351
West Montney
Same Challenge in Niobrara?
55 Source: Whiting Corp Presentation, Mar 2014

20
Continuity Loss
Necessitates vertical downspacing?
“Array Fracturing” or “Vertical Downspacing” Image from CLR Investor Presentation, Continental, 201256
A number of operators are investigating “vertical downspacing” in the Bakken petroleum
system. Similar efforts underway in Niobrara, Woodford, Montney and Permian
formations.
Is it possible that some number of these expensive wells could be unnecessary if
fractures were redesigned?
Wow
58
1. We know we have pumped proppant from one
wellbore into another.
2. We can directly interrogate the conductivity and
durability of the fracs.
3. The results are not pretty.
So what are some of the culprits that cause fracs to not
perform as we modeled?
The following list is discussed in URTeC 1579008

21
• Degradation of proppant over time
• Overflushing of proppant from the near-wellbore area in transverse fracs
• Flowback of proppant from near-wellbore area in transverse fracs
• Failure to place sufficient proppant concentrations throughout the created network
(both lateral and vertical placement)
• Insufficient conductivity to accommodate high velocity hydrocarbon flow due to
convergence near-wellbore, especially in liquid-rich formations
• Embedment of proppant
• Thermal degradation of sand-based proppants
• Introduction of extremely low quality sand and low quality ceramic proppants during
past decade
• Complex frac geometry requiring stronger or more conductive proppant in the turns
and “pinch points”. Inability to push proppant through tortuous network.
• Perf design, poor alignment with frac or other issues
• Losing/wasting proppant out of zone – poor contact with “pay”. Or poor transport.
• Insufficient proppant concentrations, resulting in discontinuous proppant packs after
frac closure. This problem is compounded when operators specify intermediate or
high density ceramics but pump the same mass concentration, resulting in reduced
fracture width and 20% to 30% smaller frac geometry.
• Wells plugged with frac sand somehow providing complete isolation
Potential Mechanisms – Frac Collapse (1 of 2)
• Fluid sensitivity – evidence that some frac fluids “soften” the formation allowing more significant
embedment and/or spalling
• Gel residue or durable gel filtercakes deposited using crosslinked fluids that may completely
occlude narrow propped fractures
• Precipitation of salt, asphaltenes, barium sulfate and calcium carbonate scales or migration of
fines (formation fines or pulverized proppant). Bio-slime or induced corrosion?
• Potential for chemical diagenesis of proppant (controversial and conflicting laboratory studies).
To date, proppant samples recovered from wells do not appear to indicate formation of zeolites
• Failure to recover water from liquid-submerged portions of the fracture below the wellbore
elevation
• Aggressive production techniques to report high IPs (some fracs vulnerable to drawdown)
• Industry rush to secure acreage as “held by production” without adequate attention to
completion effectiveness or optimization. Frenetic development pace has reduced many
completion engineers’ primary responsibility to be scheduling and assuring materials are
available, with less time devoted to optimization of well productivity
• Rel perm/condensate banking/capillary pressure/water block Emulsions
• Other unrecognized mechanisms
– Stress shadowing causing unanticipated issues
• Next stage “compresses” existing frac. Might move slurry in existing fracs containing XL gel
– Continued slippage of frac faces after closure impacting continuity
– Pore pressure depletion/subsidence/compaction “stranding” thin proppant ribbons
Potential Mechanisms – Frac Collapse (2 of 2)

22
Natural Frac SandsNicely rounded Sand Brady Sand
Optical photomicrographs – Olmen, CARBO and others
Note polycrystalline nature and
increased angularity.Angular Sand
Clusters
Some Sands sold as “high quality white
sand” in North America 2007-2008
Optical photomicrographs
20/40 comparison:
~50% poorer than Ottawa at 3000 psi
~80% poorer than Ottawa at 6000 psi
16/30 comparison:
~85% poorer than Ottawa at 4000 psi

23
Proppant ‘C’Proppant ‘B’
All proppants are not created equal!
Proppant ‘A’
The quality, conductivity, and endurance of ceramic proppants can vary dramatically, just
as we saw in natural sands. Some ceramic proppants provide only 30% the performance
of “similar” density materials. It is foolhardy to allow generic proppant identifiers.
Horrifying (and largely unrecognized)
range of quality in each proppant category
References: SPE 110679 and Besler, AOGR Sept 2008

24
These examples are rather
compelling.
Why didn’t the industry recognize
many years ago that frac conductivity
was insufficient?
With what certainty can we explain this production?
SPE 106151 Fig 13 – Production can be matched with a variety of fracture and reservoir parameters68
0
200
400
600
800
1000
1200
1400
1600
1800
2000
0 100 200 300 400 500 600
Production Days
Sta
ge
Pro
du
ctio
n (
mcfd
)
0
20
40
60
80
100
120
140
160
180
200
Cu
mu
lative
Pro
du
ctio
n (
MM
scf)
Actual Production Data

25
Nice match to measured microseismic, eh?
SPE 106151 Fig 13 – Production can be matched with a variety of fracture and reservoir parameters69
0
200
400
600
800
1000
1200
1400
1600
1800
2000
0 100 200 300 400 500 600
Production Days
Sta
ge
Pro
du
ctio
n (
mcfd
)
0
20
40
60
80
100
120
140
160
180
200
Cu
mu
lative
Pro
du
ctio
n (
MM
scf)
Actual production data
Long Frac, Low Conductivity 500' Xf, 20 md-ft, 0.5 uD perm, 23 Acres 4:1 aspect ratio
Is this more accurate? Tied to core perm
SPE 106151 Fig 13 – Production can be matched with a variety of fracture and reservoir parameters70
0
200
400
600
800
1000
1200
1400
1600
1800
2000
0 100 200 300 400 500 600
Production Days
Sta
ge
Pro
du
ctio
n (
mcfd
)
0
20
40
60
80
100
120
140
160
180
200
Cu
mu
lative
Pro
du
ctio
n (
MM
scf)
Actual production data
Long Frac, Low Conductivity
Medium Frac, Low Conductivity
500' Xf, 20 md-ft, 0.5 uD perm, 23 Acres 4:1 aspect ratio
100' Xf, 20 md-ft, 5 uD perm, 11 Acres 4:1 aspect ratio

26
Can I reinforce my misconceptions?
SPE 106151 Fig 13 – Production can be matched with a variety of fracture and reservoir parameters71
0
200
400
600
800
1000
1200
1400
1600
1800
2000
0 100 200 300 400 500 600
Production Days
Sta
ge
Pro
du
ctio
n (
mcfd
)
0
20
40
60
80
100
120
140
160
180
200
Cu
mu
lative
Pro
du
ctio
n (
MM
scf)
Actual production data
Long Frac, Low Conductivity
Medium Frac, Low Conductivity
Short Frac, High Conductivity, Reservoir Boundaries
500' Xf, 20 md-ft, 0.5 uD perm, 23 Acres 4:1 aspect ratio
100' Xf, 20 md-ft, 5 uD perm, 11 Acres 4:1 aspect ratio
50' Xf, 6000 md-ft, 10 uD perm, 7 Acres 4:1 aspect ratio
• History matching of production is surprisingly non-unique.
• Too many “knobs” available to tweak
• We can always blame it on the geology
Even if I “know” it is a simple planar frac, I cannot
prove whether it was inadequate reservoir quality, or
inadequate completion with a single well
Removing the Uncertainty
• If we require a production match of two different frac designs, we remove many degrees of freedom
– lock in all the “reservoir knobs”!
– Attempt to explain the production results from initial frac AND refrac
• 143 published trials in SPE 134330
• 100 Bakken refracs 136757
– Require simultaneous match of two different frac designs in same reservoir!
• 200+ trials in SPE 11914372

27
Field Studies Documenting Production Impact
with Increased Fracture Conductivity>200 published studies identified,
authored by >150 companies
SPE 119143 tabulates over 200 field studies 2009, dominated by vertical and XLG
Oil wells, gas wells, lean and rich condensate
Carbonate, Sandstone, Shale, and Coal
Well Rates Well Depths
1 to 25,000 bopd 100 to 20,000 feet
0.25-100 MMSCFD
74
Production Benefit
• In >200 published studies and hundreds of unpublished proppant selection studies,
• Operators frequently report greater benefit than expected using:
– Higher proppant concentrations (if crosslinked)
– More aggressive ramps, smaller pads
– Screen outs (if sufficiently strong proppant)
– Larger diameter proppant
– Stronger proppant
– Higher quality proppant
– More uniformly shaped & sized proppant
• Frac conductivity appears to be much more important than our models or intuition predict!
A tabulation of 200 papers in SPE 11914376

28
We are 99.9% certain the Pinedale Anticline was
constrained by proppant quality
Effect of Proppant Selection upon Production
0
100
200
300
400
500
600
700
800
900
LL3
LL2
LL1
MV5
MV4
MV3
MV2
MV1
MV0
Avera
ge
Reservoir Sub-Interval (Lower Lance and Mesa Verde)
Pro
du
ctio
n R
ate
10
0 d
ays p
ost-
fra
c (
mcfd
)
Versaprop
CarboProp
ISP-BS
ISP 20/40
Averages based on 95 stages ISP-
BS and 54 stages ISP 20/40
SPE 106151 and 108991
70% increase
in productivity
achieved with
a more
uniformly
sized
proppant!
The important takeaway is NOT that you need Proppant B versus Proppant A
The critical learning is that you are NOT optimized and the reservoir is capable of significant
increases in production
If you can make the wells 70% more productive with a modest design change, how much better
would they be with more aggressive improvements?
Effective Wellbore Radius for Finite-Capacity Fractures
0.1 0.2 0.5 1 2 5 10 20 50 1000.01
0.02
0.03
0.05
0.1
0.2
0.3
0.5
1
Fcd = (Kp)(Wf) / (Xf)(Kf)
rw
' /
Xf
Prat's Curve
Prats, M.: "Effect of Vertical Fractures on Reservoir Behavior-Incompressible Fluid Case," paper SPE 1575-G
Fcd = (Kf)(Wf) / (Xf)(Kform)
Fra
ctu
re E
ffe
ctive
ne
ss
Fracture Conductivity
Remember this
concept?
We thought Fcd
was >2000 with
BS ISP
If we can make
fracture 70% more
productive, then we
MUST be on this
part of the curve!
If I wish to describe the frac as a
single, planar feature with
uniform, durable conductivity, the
apparent conductivity is at least
99.9% lower than published

29
With what certainty can we explain this production?
SPE 106151 Fig 13 – Production can be matched with a variety of fracture and reservoir parameters80
0
200
400
600
800
1000
1200
1400
1600
1800
2000
0 100 200 300 400 500 600
Production Days
Sta
ge
Pro
du
ctio
n (
mcfd
)
0
20
40
60
80
100
120
140
160
180
200
Cu
mu
lative
Pro
du
ctio
n (
MM
scf)
Actual Production Data
When history matching 2
different frac designs…
I can conclusively demonstrate
the frac is constraining well
potential.
The reservoir is more prolific than
we thought!
More Stages?
Courtesy Karen Olson, BP
Adding more stages helps…
However, operators are understandably reluctant to be aggressive on
toe stages!
81

30
Stage & Cluster Spacing
Noble Energy Investor Conference Dec 17 2013, Burkett Shale (overlying Marcellus)
Stage & Cluster Spacing
Antero Website Jan 2014 - Marcellus

31
Stage & Cluster Spacing
Cabot - Howard Weil Conference 2013 - Marcellus
Stage & Cluster Spacing
Cabot Howard Weil Conference 2013 - Marcellus
32
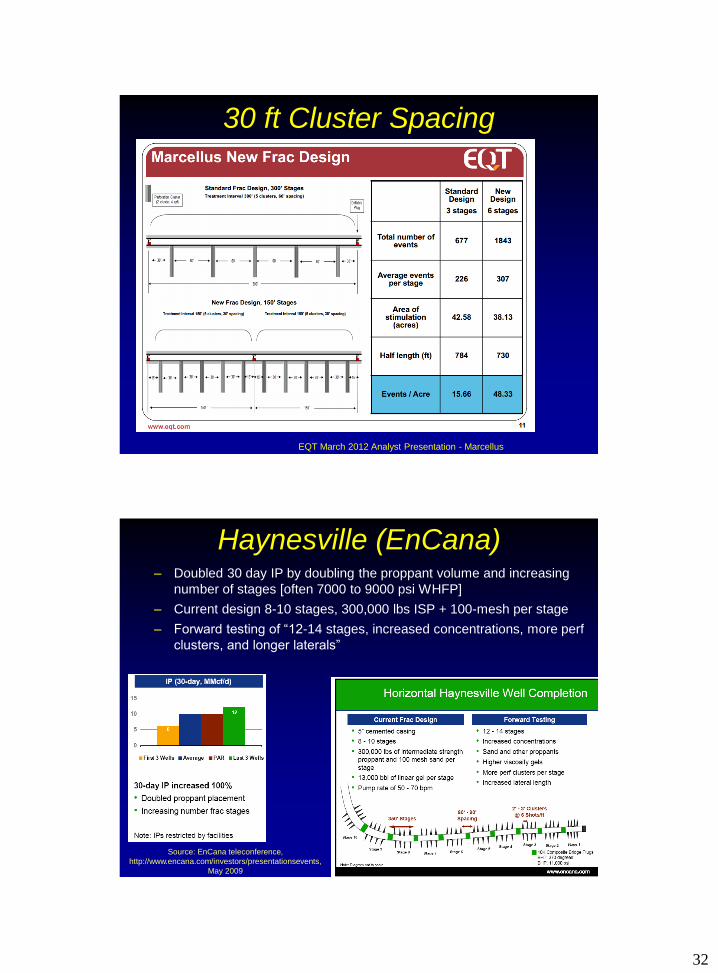
30 ft Cluster Spacing
EQT March 2012 Analyst Presentation - Marcellus
– Doubled 30 day IP by doubling the proppant volume and increasing
number of stages [often 7000 to 9000 psi WHFP]
– Current design 8-10 stages, 300,000 lbs ISP + 100-mesh per stage
– Forward testing of “12-14 stages, increased concentrations, more perf
clusters, and longer laterals”
Haynesville (EnCana)
Source: EnCana teleconference,
http://www.encana.com/investors/presentationsevents,
May 2009

33
Fayetteville
Source: Richard Moorman SWN, PNR Energy Forum May 28 09 Brookhaven College
Reducing perf cluster spacing from 250 ft to 50 ft.
Longer laterals, larger fracs
No apparent benefit to simulfracs
Refracs becoming a target
Number of Entry Points - Bakken
Whiting Website, Jan 2014, Bakken
Approximate tripling of entry
points yields 27% to 93%
increase in IP

34
Development Strategy - Niobrara
Noble Energy, 2013 Analyst Presentation
Well Spacing - Niobrara
Noble Energy, Mar 2014 Investor Presentation

35
Well Length - Niobrara
Noble Energy, 2013 Analyst Presentation
Good Practices for Transverse Fracs• Improve connection
– More stages
– More conductive proppant
– If using viscous gels• Higher proppant concentrations (> 6 ppg, >720 kg/m3)
• Avoid overflushing [some reservoirs]
– If you must be conservative (near toe?)• Consider slickwater or low viscosity “banking” fluids
– If natural fissures productive, consider uncemented
– Uncemented completions also may provide superior wellbore-to-frac connection and tolerance of overflushing
– Evaluate Screenout on heel stage?
• Sustain connection– Strong, durable, thermally stable proppants
– Avoid proppant flowback• Operational practices
• Additives if necessary97

36
Dozens of examples in literature
Shaefer, 2006 – 17 years later,
tight gas
0
500
1000
1500
2000
2500
3000
3500
Jan-90 Jan-91 Jan-92 Jan-93 Jan-94 Jan-95 Jan-96 Jan-97 Jan-98 Jan-99 Jan-00 Jan-01
Ga
s R
ate
, M
CF
D
0
50
100
150
200
250
300
350
400
450
500
Wa
ter
Ra
te,
BW
PD
Gas
Water
Initial Frac in
1989:
48,000 lb 40/70
sand + 466,000
lb 12/20 sand
May 1999 Frac:
300,000 lb 20/40
LWC
May 1995 Frac:
5,000 lb 100 mesh
+ 24,000 lb 20/40
Sand
Vincent, 2002 – 9 years later,
CBM
0
500
1000
1500
2000
2500
3000
3500
4000
May-84 May-86 May-88 May-90 May-92 May-94 May-96 May-98 May-00
Date
Pro
du
cti
on
fro
m F
rac
ture
(b
fpd
) Original Fracture (20/40 Sand)
Phase I refrac (20/40 Sand)
Phase III refrac (16/20 LWC)
Incremental
Oil Exceeds
1,000,000
barrels
Incremental
Oil exceeds
650,000
barrels
First
Refrac
Second
Refrac
Pospisil, 1992 – 6 years later,
20 mD oil
0
500
1000
1500
2000
2500
Sta
biliz
ed
Ra
te (
MS
CF
D)
Pre Frac 10,000 gal
3% acid +
10,000 lb
glass beads
80,000 gal +
100,000 lb
20/40 sand
75,000 gal +
120,000 lb
20/40 ISP
Ennis, 1989 – sequential
refracs, tight gas
0
20
40
60
80
100
120
Well A Well B Well C Well D Well E
Pro
du
ctio
n R
ate
(to
nn
es/d
ay)
..
Initial Frac
Refrac
Dedurin, 2008, Volga-Urals
oil
98
Increased Conductivity Refracs?
See SPE 134330 and 136757
Successful refracs have been
performed in Barnett, Eagle Ford,
Bakken, Marcellus, Haynesville,
Niobrara, Spraberry, Wolfcamp…
What did we miss the first time?

37
Horizontal Well – Unique Opportunity to Investigate
Mechanisms? [Cannot blame on geology?]
0
5
10
15
10 9 8 7 6 5 4 3 2 1
Pe
rce
nt
Co
ntr
ibu
tio
n
Stage Number toeheel
Conceptual example
Orange = Frac Strategy A
Green = Frac Strategy B
Horizontal Well - Production Log
0
5
10
15
20
15 14 13 12 11 10 9 8 7 6 5 4 3 2
Pe
rce
nt
Co
ntr
ibu
tio
n
Stage Number toeheel
Stages 2,7,13 screened out, average contribution = 13.5%
Stage 1 could not be accessed, Stages 3 and 4 were unpropped
Average contribution others (omitting 3&4 unpropped)= 6.3%
Stage 10, frac fluid volume reduced by 25% (more aggressive)
38
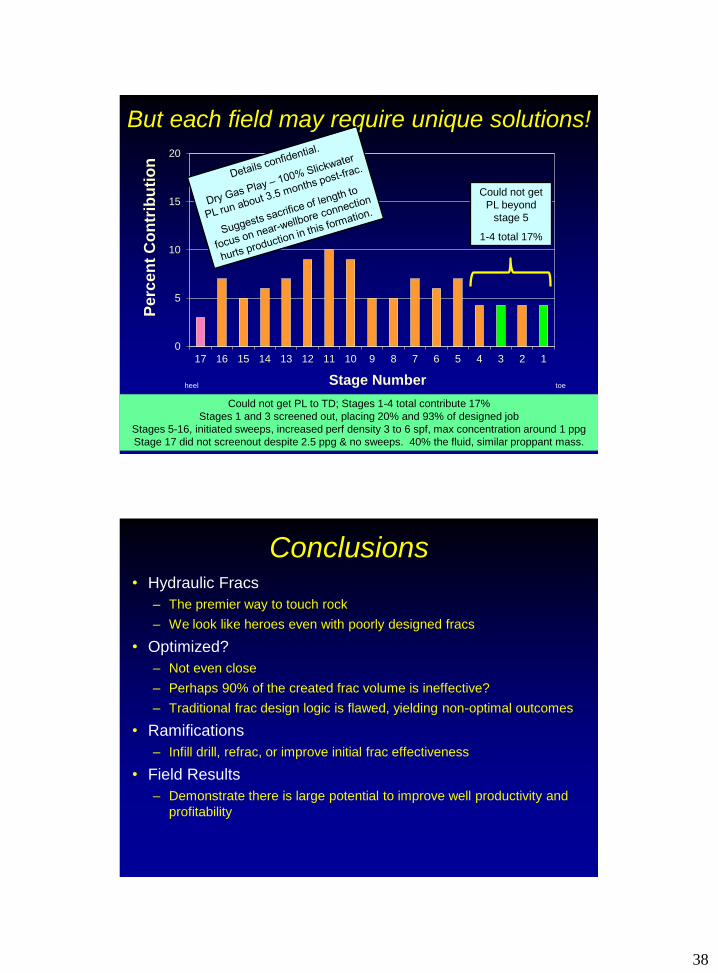
But each field may require unique solutions!
0
5
10
15
20
17 16 15 14 13 12 11 10 9 8 7 6 5 4 3 2 1
Pe
rce
nt
Co
ntr
ibu
tio
n
Stage Number toeheel
Could not get PL to TD; Stages 1-4 total contribute 17%
Stages 1 and 3 screened out, placing 20% and 93% of designed job
Stages 5-16, initiated sweeps, increased perf density 3 to 6 spf, max concentration around 1 ppg
Stage 17 did not screenout despite 2.5 ppg & no sweeps. 40% the fluid, similar proppant mass.
Could not get
PL beyond
stage 5
1-4 total 17%
• Hydraulic Fracs
– The premier way to touch rock
– We look like heroes even with poorly designed fracs
• Optimized?
– Not even close
– Perhaps 90% of the created frac volume is ineffective?
– Traditional frac design logic is flawed, yielding non-optimal outcomes
• Ramifications
– Infill drill, refrac, or improve initial frac effectiveness
• Field Results
– Demonstrate there is large potential to improve well productivity and
profitability
Conclusions