Embed Size (px)
Citation preview

© GSMA Intelligence gsmaintelligence.com • [email protected] • @GSMAi
GSMA Intelligence
ANALYSIS
Global cellular market trendsand insight – Q3 2016
October 2016

Global cellular market trends and insight — Q3 2016 GSMA Intelligence
Contents 2
Welcome to GSMA Intelligence’s 32nd quarterly review of regional mobile trends.
We know that you are busy and don’t have time to scan the thousands of operator data points captured in our online database each quarter, so our analyst team has summarised the latest regional data trends for you in this report.
The report provides content from our News Feed tool, our consumer survey results, and featured data from external data providers. This quarter, we have focused on mobile gaming usage patterns, notably in the US where consumers are predominantly tech-savvy. Our consumer survey results provide insights into this topic, while we invited Verto Analytics to share additional data and insights on the use of mobile gaming.
The regional slides feature easy-to-digest statistics covering mobile adoption, market structure, network launches, technology migration and financials.
We hope that you enjoy the report. As always, we value your feedback, so please do contact us if you wish to discuss this research with our analyst team.
Insights
News Feed 3
Consumer insight 4
Featured data 5
Networks 6
Financials 7
Regional trends
World 8
Asia Pacific 12
Northern America 16
Latin America 20
Europe 24
Commonwealth of Independent States 28
Middle East and North Africa 32
Sub-Saharan Africa 36
Least Developed Countries 40

3
Global cellular market trends and insight — Q3 2016 GSMA Intelligence
1 News Feed
During Q3 2016, global connections grew by 3.2% year-on-year, and mobile operators generated $264 billion in total revenues. Data services now contribute more than 40% of service revenues globally, fuelled by 533 operators with live 4G LTE networks. The transformation of the mobile industry continues, as captured in our online News Feed tool.
New entrants took the spotlight this quarter with the launch of Reliance Jio in India in September. Its entry will dramatically alter the landscape of the Indian mobile market. Together with the auction of further spectrum later in 2016, it will accelerate migration of mobile users to 4G, and help drive 3G adoption as prices fall across the board. It will also accelerate consolidation by increasing the pressure on the financial health of smaller operators and compelling India’s larger operators to consolidate their positions.
Subscribers are currently using the Jio service for free as part of a trial until the end of 2016. When it begins charging customers in 2017, the rates offered by Jio will be the lowest anywhere in the world according to Mukesh Ambani, Chairman of Reliance Industries. Services including music videos and TV shows will also be available as part of the package, facilitated by Reliance Industry’s ownership of media group Network18. The operator does not plan to charge for voice calls; instead it will use a tiered data-centric business model similar to that seen in many western markets.
Jio’s entry and aggressively priced tariffs will spur mobile broadband (3G and 4G) adoption in India, at the expense of profitability. In the run-up to Jio’s launch and following its published tariffs, its competitors have responded by slashing data prices, with the price (incremental cost) per GB of data falling by as much as 80% in some cases across both 3G and 4G services. By 2020, we forecast mobile broadband for the market as a whole to grow to around 50% of all connections (670 million), while LTE adoption will increase from less than 1% today to reach 20%, or 280 million connections.
Meanwhile, Iliad’s owner Xavier Niel is looking to replicate its Free Mobile success story by entering the Italian market. Niel has reportedly disposed of
all direct and indirect shares and options in Telecom Italia, leaving his Iliad unit free to acquire assets sold by Italian operators Wind and 3 Italia as Iliad looks to set up a new mobile network operator in Italy. Wind and 3 have agreed to divest spectrum and physical infrastructure to allay competition concerns and help clear the way for their proposed €21.8 billion ($24 billion) merger.
According to our global operator group ranking published last September, Telecom Italia has been overtaken by Idea Cellular and Telkomsel, moving into 20th and 21st positions respectively. Having dropped to fifth place in our last ranking, Telefónica Group climbed back to third following the reconsolidation of its UK operation after its sale to CK Hutchison Group was blocked. A lack of any significant mobile merger activity since our last ranking means that changes in this iteration are driven largely by organic growth. The study ranks global operators using a model based on reported mobile connections (including cellular M2M) and mobile revenues.
China Mobile was comfortably the largest group in terms of connections, reaching 912.3 million as of Q2 2016. While other operator groups recorded greater revenues (inclusive of fixed line and other non-mobile services), it was also the largest group by mobile revenues, attaining annualised revenues of $107 billion for the year ending Q2 2016. Verizon Wireless and AT&T followed in second and third place in terms of revenues, with mobile accounting for 69% and 47% of total revenues respectively.
The remaining positions in the top 10 were predominantly filled by operator groups with substantial global footprints across multiple markets and/or a strong presence in the US, including Vodafone, Telefónica, América Móvil, Bharti Airtel, AT&T, Verizon Wireless and Deutsche Telekom.

2 News Feed 4
Global cellular market trends and insight — Q3 2016 GSMA Intelligence
2 Consumer insight
Our 2016 global consumer survey spans 56 countries, covering topics such as mobile adoption, device ownership and usage across all demographics. Consumers were asked about their use of mobile gaming, which revealed interesting usage patterns when compared to console gamers.
In our 2016 global survey, we asked consumers about their mobile usage patterns, in particular asking how frequently, if at all, they play games on their mobile phones.
Our recently published analysis on the profile of adult US mobile gamers showed that consumers in the market are predominantly tech-savvy and have an appetite for new mobile technologies that can enhance their mobile digital experience.
Augmented reality apps and companion products are fuelling a radical shift in the mobile gaming environment, in turn generating new revenue opportunities for industry players.
Two thirds (67%) of adult mobile users in the US play games on their mobile phones once a month or more, with more than half of them playing games every day. This equates to a consumer base of 165 million adults in the country.
Usage patterns emerge when we compare mobile gaming engagement and game consoles ownership. Firstly, engagement increases as people own more gaming consoles. The proportion of mobile phone users who engage in mobile gaming every day jumps from 21% for those who do not own a console, to 58% for users who own three or more consoles. At the same
time, the proportion of users with no engagement in mobile gaming at all decreases from 43% for the first group to a marginal 2% for the latter. This confirms that console gamers are those most engaged in mobile gaming.
Yet, our survey data revealed that almost half (47%) of the adult mobile users in the US who do not own a console play games on their mobile phones once a month or more - of which 73% do so every week. This suggests mobile gaming has attracted an audience with supposedly little or no previous background in (console) gaming. This finding can be cross-correlated with Verto Analytics data indicating that the characteristics of
today’s mobile gamers are as diverse as the games they play. This diversity is particularly fuelled by low-cost or “free-to-play” mobile games that expose more potential players to mobile games, further generating a huge influx of samplers.
Mobile is the new growth area for gaming heavyweights such as Microsoft, Sony, Ubisoft, Capcom, EA and Nintendo, which have all adjusted their development plans with the mobile gamer in mind. According to Verto, three factors contribute to the dominance of mobile over consoles: low cost of entry, ease of access and lower initial game costs.
Source: GSMA Intelligence 2016 consumer survey
100%
80%
60%
40%
20%
0%0 console
(N = 331)1 console
(N = 255)2 consoles
(N = 90)3+ consoles
(N = 64)
Never
Less than once a month
Every month
Every week
Every day
Frequency of mobile gaming by console ownership, US 2016

2 News Feed 5
Global cellular market trends and insight — Q3 2016 GSMA Intelligence
3 Featured data
Verto Analytics provides a single-source audience measurement solution for monitoring the complex behaviour of today’s consumer on every device, app and platform they use throughout the day. This quarter, Verto Analytics kindly shared insights on US mobile gaming trends.
Verto Analytics research indicates that, while games rank seventh in overall reach, loyal and passionate players help the category dominate in time spent (second overall) among all app users. In the aggregate, US app users spend an incredible 1.5 billion hours each month playing games on smartphones and tablets. That’s approximately 12% of all monthly app time.
Clearly, mobile games have attracted a new audience. This means mobile poses new and unique design and distribution concerns compared to console-based games.
The top 40% of all gamers (defined as Heavy Gamers), consume 88% of all monthly time spent with mobile games. Drilling deeper, the top 20% of gamers (defined as Core Gamers) account for nearly two-thirds of all game play.
Conversely, the bottom 40% of gamers (defined as Light Gamers) are the ultimate samplers. Light Gamers account for a scant 3% of time spent gaming. While Light Gamers may download and eventually try any number of games, they quickly move on to their next mobile experience.
Wide disparities in behaviour exist between Heavy and Light Gamers. While average gamers spend 24 minutes each day playing games, Heavy Gamers spend more than 2.5 times that amount. Among Core Gamers, the average time spent with mobile games each day is four times greater.
Light use is even more extreme. Despite the nearly friction-free nature of accessing mobile games — easy to discover, download, and then sample lots of choices — Light Gamers spend a staggering 92% less time each day playing games compared to the average user.
Verto Analytics data shows that the average mobile gamer accesses slightly more than one game (1.3) daily, and 3.6 games monthly.
Success in mobile gaming means attracting the right users and keeping them engaged well past download. If mobile game developers and marketers seek to a) increase loyalty among their most passionate players, b) attempt to attract users from rival games, or c) turn light or non- players into active gamers, understanding the usage characteristics among Heavy Gamers and Core Gamers will be essential.
Top mobile categories, ranked byaudience reach (US, July 2016)
Top mobile categories, ranked bymonthly time spent (US, July 2016, million hours)
Social networking
Utilities
Productivity
Lifestyle and shopping
Photo and video
Travel and navigation
Games
Entertainment
Music and video
Finance
Social networking
Games
Photo and video
Utilities
Entertainment
Lifestyle and shopping
Travel and navigation
Productivity
News, magazines and comics
Music and video
95%
93%
81%
74%
68%
64%
57%
55%
53%
44%
5,075
1,465
762
525
453
333
234
192
188
188Source:
Verto Analytics

6
Global cellular market trends and insight — Q3 2016 GSMA Intelligence
4 Networks
Q3 2016 World* Asia PacificNorthern America
Latin America Europe
Commonwealth of Independent
States
Middle East and North
AfricaSub-Saharan
Africa
Least Developed Countries
Total number of operators 1,155 224 146 171 209 89 98 201 189
Total connections (excluding M2M), in million 7,415 3,856 378 687 679 417 661 737 683
% of global total connections (excluding M2M) 100% 52% 5% 9% 9% 6% 9% 10% 9%
Operators with live 2G GSM networks 721 119 50 127 135 50 84 142 153
Operators with live 3G WCDMA/HSPA networks 622 119 20 115 140 45 72 110 116
Operators with live 2G/3G CDMA networks 124 20 43 10 12 14 8 16 18
Operators with live 4G LTE networks 533 94 56 81 144 41 43 73 50
of which operators with live VoLTE networks 71 28 6 2 21 2 7 4 3
Operators with live WIMAX networks 168 33 12 26 29 23 16 28 18
2G as % of total connections 48% 49% 10% 41% 27% 60% 58% 69% 73%
3G as % of total connections 31% 26% 29% 46% 43% 32% 38% 29% 26%
4G as % of total connections 21% 25% 61% 13% 31% 8% 4% 2% 1%
Total number of MVNOs 1,177 157 155 34 646 24 19 20 4
Total number of operator sub-brands** 287 22 21 15 194 14 16 5 3
* Global totals include ‘international’ operations that cannot be classified in any specific regions
** Sub-brands differ from MVNOs in that they are wholly-owned and operated by their MNO parent, despite being marketed independently of that MNO

7
Global cellular market trends and insight — Q3 2016 GSMA Intelligence
5 Financials
Q3 2016 World Asia PacificNorthern America
Latin America Europe
Commonwealth of Independent
States
Middle East and North
AfricaSub-Saharan
Africa
Least Developed Countries
Total revenue ($ billion) $264.3 $106.9 $63.8 $19.2 $40.1 $5.9 $18.1 $10.8 $7.4
Of which non-recurring revenue ($ billion) $45.9 $20.5 $12.9 $3.1 $6.0 $0.5 $2.1 $0.9 $0.4
Of which recurring (service) revenue ($ billion) $218.4 $86.5 $50.8 $16.1 $34.1 $5.4 $16.0 $9.9 $7.0
Of which voice revenue ($ billion) $102.5 $35.7 $21.0 $9.7 $15.6 $3.5 $9.5 $6.8 $5.3
Of which non-voice revenue ($ billion) $115.8 $50.7 $29.9 $6.4 $18.5 $1.9 $6.6 $3.1 $1.7
Of which data revenue ($ billion) $88.6 $39.7 $23.1 $5.0 $14.0 $1.4 $4.5 $2.1 $0.9
Blended ARPU $9.4 $7.2 $42.3 $7.1 $16.4 $4.2 $8.0 $4.3 $3.6
Voice ARPU $4.6 $3.2 $17.3 $5.0 $7.5 $2.8 $4.7 $3.0 $2.7
Data ARPU $3.9 $3.3 $19.3 $2.5 $6.7 $1.1 $2.3 $0.8 $0.5
Opex ($ billion) $173.1 $65.5 $44.2 $13.6 $27.3 $3.4 $12.5 $6.9 $4.7
Capex ($ billion) $45.6 $21.7 $8.1 $3.8 $6.3 $1.1 $2.9 $1.8 $1.3
EBITDA ($ billion) $87.8 $35.5 $19.5 $7.3 $13.6 $2.6 $5.6 $3.9 $2.8
EBITDA margin 33.7% 35.7% 30.6% 33.6% 33.2% 43.0% 30.9% 36.2% 37.3%
Operating free cash flow ($ billion) $42.3 $13.8 $11.4 $3.6 $7.2 $1.5 $2.7 $2.1 $1.5

8
Global cellular market trends and insight — Q3 2016 GSMA Intelligence
6 World CONNECTIONS
�����24%
76%
% prepaid % contract
�����Q3 2015
Q3 2016
Q4 2016
292
379
407
Q4 2016Q3 2016Q3 2015
3.8%
3.2%
3.8%
Unique subscribersTotal connections
64%
100%
Unique subscribersTotal connections
7,427
4,773
Prepaid/contract as percentage of connections (excluding M2M)
Cellular M2M connections (million)
Connections annual growth (excluding M2M)
Market penetration as a percentage of total population
Total connections (excluding M2M) vs. unique subscribers (million)

9
Global cellular market trends and insight — Q3 2016 GSMA Intelligence
Q3 2015
Q3 2016
Q4 2016
43%
49%
51% ����������82%
78%
3G
Q3 2016
Q3 2015����� ����������43%59%
Q3 2016
Q3 2015
4G
4G3G2G
������� -10%
0%
70%
��������������48%55%
32%
13%
31%
21%
2G 3G 4G
Q3 2016
Q3 2015
Mobile internet as percent of subscribersMobile broadband as percent of connections
Mobile internet as % of subscribers
Mobile broadband as% of connections
52%
73%
6 World TECHNOLOGY
3G coverage as a percentage of total population
Smartphones as a percentage of connections
Network technology connections annual growth
Network technology as a percentage of connections (excluding M2M)
Mobile broadband and mobile internet adoption
4G coverage as a percentage of total population

2 Regional 10
Global cellular market trends and insight — Q3 2016 GSMA Intelligence
EBITDA %Opex %Capex %
17%19%
66%72%
34%38%
Q3 2016Q3 2015
Other non-voiceDataVoice
47%49%41%38%
13% 12%
Q3 2016Q3 2015
Blended ARPU
Voice ARPU
Data ARPU
$3.9
$4.6
$9.4OFCF
EBITDA
Capex
Opex
Data revenue
Non-voice revenue
Voice revenue
Non-recurring revenue
Recurring (service) revenue
Total revenue $264
$218
$46$103
$116
$89$173
$46
$88
$42
Percentage of total revenuePercentage of recurring (service) revenue
ARPUMobile operator financials ($ billion)
6 World FINANCIALS

11
Global cellular market trends and insight — Q3 2016 GSMA Intelligence
Q4 2016Q3 2016Q3 2015
-3.5%-7.0%
7.4%
Q4 2016Q3 2016Q3 2015
-0.1%
-11.1%
0.1%
Q4 2016Q3 2016Q3 2015-13.8%
-9.6%
22.9%
Q4 2016Q3 2016Q3 2015
10.4%
15.0%
7.1%
Q4 2016Q3 2016Q3 2015
2.7%
-0.1%
-2.3%
EBITDA annual growthOpex annual growth
Capex annual growthData revenue annual growthTotal recurring (service) revenue annual growth
6 World FINANCIAL GROWTH

12
Global cellular market trends and insight — Q3 2016 GSMA Intelligence
7 Asia Pacific CONNECTIONS
�����18%
82%
% prepaid % contract
�����Q3 2015
Q3 2016
Q4 2016
119
168
119
Q4 2016Q3 2016Q3 2015
4.2%4.8%
4.7%
Unique subscribersTotal connections
65%
96%
Unique subscribersTotal connections
3,870
2,606
Prepaid/contract as a percentage of connections (excluding M2M)
Cellular M2M connections (million)
Connections annual growth (excluding M2M)
Market penetration as a percentage of total population
Total connections (excluding M2M) vs. unique subscribers (million)
13
Global cellular market trends and insight — Q3 2016 GSMA Intelligence
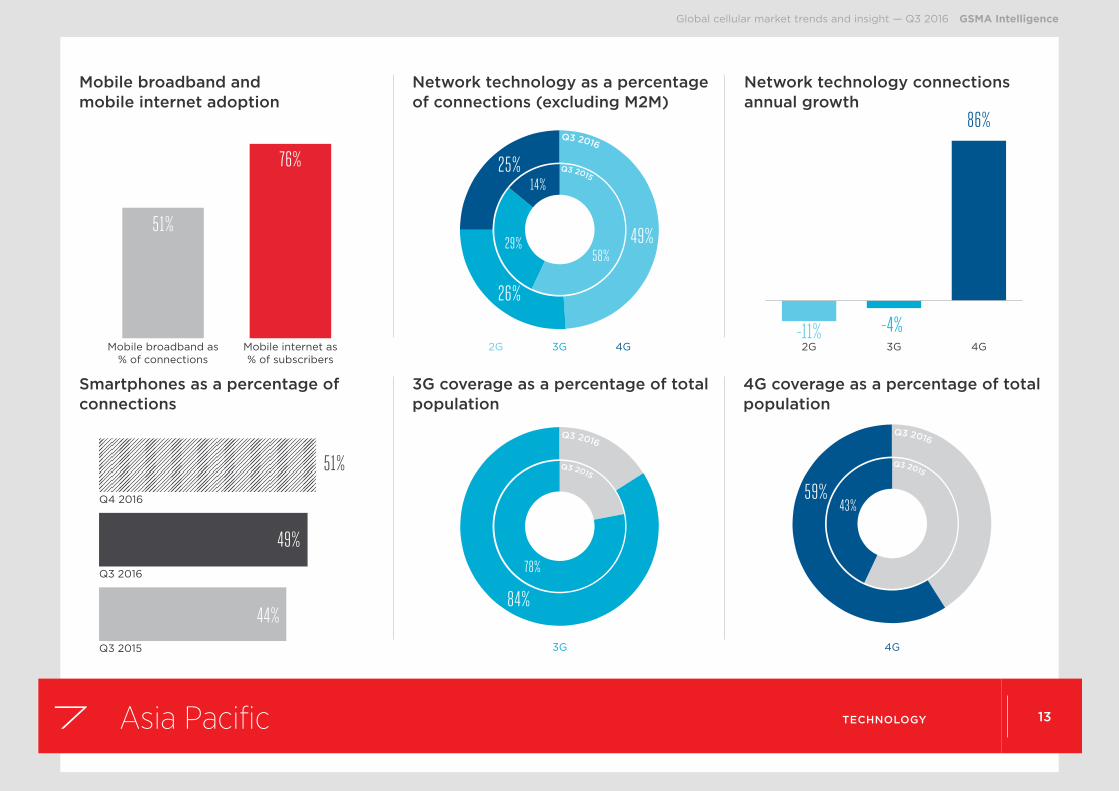
Q3 2015
Q3 2016
Q4 2016
44%
49%
51% ����������78%
84%
3G
Q3 2016
Q3 2015����� ����������43%59%
Q3 2016
Q3 2015
4G
4G3G2G
�������-11% -4%
86%
��������������49%58%
29%
14%
26%
25%
2G 3G 4G
Q3 2016
Q3 2015
Mobile internet as percent of subscribersMobile broadband as percent of connections
Mobile internet as% of subscribers
Mobile broadband as% of connections
51%
76%
7 Asia Pacific TECHNOLOGY
3G coverage as a percentage of total population
Smartphones as a percentage of connections
Network technology connections annual growth
Network technology as a percentage of connections (excluding M2M)
Mobile broadband and mobile internet adoption
4G coverage as a percentage of total population

2 Regional 14
Global cellular market trends and insight — Q3 2016 GSMA Intelligence
EBITDA %Opex %Capex %
24% 20%
61%
74%
36%39%
Q3 2016Q3 2015
Other non-voiceDataVoice
41%43% 46%42%
13%14%
Q3 2016Q3 2015
Blended ARPU
Voice ARPU
Data ARPU
$3.3
$3.2
$7.2OFCF
EBITDA
Capex
Opex
Data revenue
Non-voice revenue
Voice revenue
Non-recurring revenue
Recurring (service) revenue
Total revenue $107
$86
$20$36
$51
$40
$66
$22
$35
$14
Percentage of total revenuePercentage of recurring (service) revenue
ARPUMobile operator financials ($ billion)
7 Asia Pacific FINANCIALS

15
Global cellular market trends and insight — Q3 2016 GSMA Intelligence
Q4 2016Q3 2016Q3 2015
-2.5%
0.5%
-12.6%
Q4 2016Q3 2016Q3 2015
11.4%
9.7%
-9.4%
Q4 2016Q3 2016Q3 2015
0.0%
9.3%
-9.6%
Q3 2016Q2 2016Q2 2015
Q4 2016Q3 2016Q3 2015
17.3%19.0%
11.1%
Q4 2016Q3 2016Q3 2015
8.3%
5.3%
3.0%
EBITDA annual growthOpex annual growth
Capex annual growthData revenue annual growthTotal recurring (service) revenue annual growth
7 Asia Pacific FINANCIAL GROWTH

16
Global cellular market trends and insight — Q3 2016 GSMA Intelligence
8 Northern America CONNECTIONS
�����75%
25%
% prepaid % contract
�����Q3 2015
Q3 2016
Q4 2016
57
70
75
Q4 2016Q3 2016Q3 2015
4.6%
2.9%2.6%
Unique subscribersTotal connections
80%
105%
Unique subscribersTotal connections
378
289
Prepaid/contract as percentage of connections (excluding M2M)
Cellular M2M connections (million)
Connections annual growth (excluding M2M)
Market penetration as a percentage of total population
Total connections (excluding M2M) vs. unique subscribers (million)

17
Global cellular market trends and insight — Q3 2016 GSMA Intelligence
Q3 2015
Q3 2016
Q4 2016
74%
76%
77% ����������99%99%
3G
Q3 2016
Q3 2015
4G3G2G
������� -15% -16%
21%
��������������10%
13%
36%
52%29%
61%
2G 3G 4G
Q3 2016
Q3 2015
Mobile internet as percent of subscribersMobile broadband as percent of connections
Mobile internet as% of subscribers
Mobile broadband as% of connections
90%83%
8 Northern America TECHNOLOGY
3G coverage as a percentage of total population
Smartphones as a percentage of connections
Network technology connections annual growth
Network technology as a percentage of connections (excluding M2M)
Mobile broadband and mobile internet adoption
����� ����������99%99%
Q3 2016
Q3 2015
4G
4G coverage as a percentage of total population

2 Regional 18
Global cellular market trends and insight — Q3 2016 GSMA Intelligence
EBITDA %Opex %Capex %
13%14%
69%63%
31%37%
Q3 2016Q3 2015Other non-voiceDataVoice
41%43% 46%43%
13%13%
Q3 2016Q3 2015
Blended ARPU
Voice ARPU
Data ARPU
$19.3
$17.3
$42.3OFCF
EBITDA
Capex
Opex
Data revenue
Non-voice revenue
Voice revenue
Non-recurring revenue
Recurring (service) revenue
Total revenue $64
$51
$13$21
$30
$23
$44
$8
$20
$11
Percentage of total revenuePercentage of recurring (service) revenue
ARPUMobile operator financials ($ billion)
8 Northern America FINANCIALS

19
Global cellular market trends and insight — Q3 2016 GSMA Intelligence
Q4 2016Q3 2016Q3 2015
4.4%
-3.1%
9.1%
Q4 2016Q3 2016Q3 2015
14.5%
-18.2%-11.7%
Q4 2016Q3 2016Q3 2015-13.1%
3.2%
-8.9%
Q4 2016Q3 2016Q3 2015
3.6%
8.9%
3.6%
Q4 2016Q3 2016Q3 2015
-1.7%
-1.4%
-0.1%
EBITDA annual growthOpex annual growth
Capex annual growthData revenue annual growthTotal recurring (service) revenue annual growth
8 Northern America FINANCIAL GROWTH

20
Global cellular market trends and insight — Q3 2016 GSMA Intelligence
9 Latin America CONNECTIONS
�����22%
78%
% prepaid % contract
�����Q3 2015
Q3 2016
Q4 2016
21
24
25
Q4 2016Q3 2016Q3 2015
-0.1%
-1.2%
1.4%
Unique subscribersTotal connections
66%
107%
Unique subscribersTotal connections
686
422
Prepaid/contract as percentage of connections (excluding M2M)
Cellular M2M connections (million)
Connections annual growth (excluding M2M)
Market penetration as a percentage of total population
Total connections (excluding M2M) vs. unique subscribers (million)

21
Global cellular market trends and insight — Q3 2016 GSMA Intelligence
Q3 2015
Q3 2016
Q4 2016
44%
52%
54% ����������92%90%
3G
Q3 2016
Q3 2015
4G3G2G
������� -15% -4%
140%
��������������41%47%
47%
5%
46%
13%
2G 3G 4G
Q3 2016
Q3 2015
Mobile internet as percent of subscribersMobile broadband as percent of connections
Mobile internet as% of subscribers
Mobile broadband as% of connections
59%
76%
9 Latin America TECHNOLOGY
3G coverage as a percentage of total population
Smartphones as a percentage of connections
Network technology connections annual growth
Network technology as a percentage of connections (excluding M2M)
Mobile broadband and mobile internet adoption
����� ����������49%
66%
Q3 2016
Q3 2015
4G
4G coverage as a percentage of total population

2 Regional 22
Global cellular market trends and insight — Q3 2016 GSMA Intelligence
EBITDA %Opex %Capex %
20%22%
71%
88%
34%38%
Q3 2016Q3 2015
Other non-voiceDataVoice
60%62%
31%28%
9%10%
Q3 2016Q3 2015
Blended ARPU
Voice ARPU
Data ARPU
$2.5
$5.0
$7.1OFCF
EBITDA
Capex
Opex
Data revenue
Non-voice revenue
Voice revenue
Non-recurring revenue
Recurring (service) revenue
Total revenue $19
$16
$3
$10
$6
$5
$14
$4
$7
$4
Percentage of total revenuePercentage of recurring (service) revenue
ARPUMobile operator financials ($ billion)
9 Latin America FINANCIALS

23
Global cellular market trends and insight — Q3 2016 GSMA Intelligence
Q4 2016Q3 2016Q3 2015
-10.1%
5.2%
-17.5%
Q4 2016Q3 2016Q3 2015
4.2%5.7%
-9.3%
Q4 2016Q3 2016Q3 2015
-5.8%
18.3%
-10.2%
Q4 2016Q3 2016Q3 2015
12.5%
12.2%10.8%
Q4 2016Q3 2016Q3 2015
1.2%
-7.1%
0.3%
EBITDA annual growthOpex annual growth
Capex annual growthData revenue annual growthTotal recurring (service) revenue annual growth
9 Latin America FINANCIAL GROWTH

24
Global cellular market trends and insight — Q3 2016 GSMA Intelligence
10 Europe CONNECTIONS
�����58%
42%
% prepaid % contract
�����Q3 2015
Q3 2016
Q4 2016
64
77
81
Q4 2016Q3 2016Q3 2015
-0.8%
0.1%
0.8%
Unique subscribersTotal connections
84%
125%
Unique subscribersTotal connections
679
454
Prepaid/contract as percentage of connections (excluding M2M)
Cellular M2M connections (million)
Connections annual growth (excluding M2M)
Market penetration as a percentage of total population
Total connections (excluding M2M) vs. unique subscribers (million)

25
Global cellular market trends and insight — Q3 2016 GSMA Intelligence
Q3 2015
Q3 2016
Q4 2016
57%
63%
65% ����������98%98%
3G
Q3 2016
Q3 2015
4G3G2G
������� -16% -12%
54%
��������������27%32%
48%
20%
43%
31%
2G 3G 4G
Q3 2016
Q3 2015
Mobile internet as percent of subscribersMobile broadband as percent of connections
Mobile internet as% of subscribers
Mobile broadband as% of connections
73% 77%
10 Europe TECHNOLOGY
3G coverage as a percentage of total population
Smartphones as a percentage of connections
Network technology connections annual growth
Network technology as a percentage of connections (excluding M2M)
Mobile broadband and mobile internet adoption
4G coverage as a percentage of total population
����� ����������84%
92%
Q3 2016
Q3 2015
4G

2 Regional 26
Global cellular market trends and insight — Q3 2016 GSMA Intelligence
EBITDA %Opex %Capex %
17% 16%
68%77%
35% 33%
Q3 2016Q3 2015
Other non-voiceDataVoice
Q3 2016Q3 2015
46%48%41%39%
13%13%
Blended ARPU
Voice ARPU
Data ARPU
$6.7
$7.5
$16.4OFCF
EBITDA
Capex
Opex
Data revenue
Non-voice revenue
Voice revenue
Non-recurring revenue
Recurring (service) revenue
Total revenue $40
$34
$6$16
$19
$14
$27
$6
$14
$7
Percentage of total revenuePercentage of recurring (service) revenue
ARPUMobile operator financials ($ billion)
10 Europe FINANCIALS

27
Global cellular market trends and insight — Q3 2016 GSMA Intelligence
Q4 2016Q3 2016Q3 2015
-16.9%
0.8%
-15.6%
Q4 2015Q3 2016Q3 015
-4.6%
-1.1%
-8.5%
Q4 2016Q3 2016Q3 2015-23.5%
1.9%
-11.6%
Q4 2016Q3 2016Q3 2015
2.7%
11.2%
0.5%Q4 2016Q3 2016Q3 2015
-2.7%
-1.9%
-4.7%
EBITDA annual growthOpex annual growth
Capex annual growthData revenue annual growthTotal recurring (service) revenue annual growth
10 Europe FINANCIAL GROWTH

28
Global cellular market trends and insight — Q3 2016 GSMA Intelligence
11 Commonwealth of Independent States CONNECTIONS
�����17%
83%
% prepaid % contract
�����Q3 2015
Q3 2016
Q4 2016
11
14
15
Unique subscribersTotal connections
77%
145%
Q4 2016Q3 2016Q3 2015
2.2%
1.2%
1.6%
Unique subscribersTotal connections
417
221
Prepaid/contract as percentage of connections (excluding M2M)
Cellular M2M connections (million)
Connections annual growth (excluding M2M)
Market penetration as a percentage of total population
Total connections (excluding M2M) vs. unique subscribers (million)

29
Global cellular market trends and insight — Q3 2016 GSMA Intelligence
Q3 2015
Q3 2016
Q4 2016
39%
47%
49% ����������91%
89%
3G
Q3 2016
Q3 2015
4G3G2G
�������-12%
20%
87%
�������������60%68%
27%
4%
32%
8%
2G 3G 4G
Q3 2016
Q3 2015
Mobile internet as percent of subscribersMobile broadband as percent of connections
Mobile internet as% of subscribers
Mobile broadband as% of connections
40%
68%
11 Commonwealth of Independent States TECHNOLOGY
3G coverage as a percentage of total population
Smartphones as a percentage of connections
Network technology connections annual growth
Network technology as a percentage of connections (excluding M2M)
Mobile broadband and mobile internet adoption
����� ����������51%
61%
4G
Q3 2016a
Q3 2015
4G coverage as a percentage of total population

2 Regional 30
Global cellular market trends and insight — Q3 2016 GSMA Intelligence
EBITDA %Opex %Capex %
Q3 2016Q3 2015
19%23%
58%58%
43%46%
Other non-voiceDataVoice
Q3 2016Q3 2015
64%66%
25%22%11%11%
Blended ARPU
Voice ARPU
Data ARPU
$1.1
$2.8
$4.2OFCF
EBITDA
Capex
Opex
Data revenue
Non-voice revenue
Voice revenue
Non-recurring revenue
Recurring (service) revenue
Total revenue $6
$5
$0$3
$2
$1
$3
$1
$3
$1
Percentage of total revenuePercentage of recurring (service) revenue
ARPUMobile operator financials ($ billion)
11 Commonwealth of Independent States FINANCIALS

31
Global cellular market trends and insight — Q3 2016 GSMA Intelligence
Q4 2016Q3 2016Q3 2015
6.9%
-5.0%
3.7%
Q4 2016Q3 2016Q3 2015
-0.9%
-2.7% -2.7%
Q4 2016Q3 2016Q3 2015
-6.6%
16.0%
-15.5%
Q4 2016Q3 2016Q3 2015
15.6%20.0%
15.0%
Q4 2016Q3 2016Q3 2015
3.2%
-0.8%
2.3%
EBITDA annual growthOpex annual growth
Capex annual growthData revenue annual growthTotal recurring (service) revenue annual growth
11 Commonwealth of Independent States FINANCIAL GROWTH

32
Global cellular market trends and insight — Q3 2016 GSMA Intelligence
12 Middle East and North Africa CONNECTIONS
�����18%
82%
% prepaid % contract
�����Q3 2015
Q3 2016
Q4 2016
10
13
14
Q4 2016Q3 2016Q3 2015
3.2% 3.1%
3.8%
Unique subscribersTotal connections
58%
108%
Unique subscribersTotal connections
665
359
Prepaid/contract as percentage of connections (excluding M2M)
Cellular M2M connections (million)
Connections annual growth (excluding M2M)
Market penetration as a percentage of total population
Total connections (excluding M2M) vs. unique subscribers (million)
33
Global cellular market trends and insight — Q3 2016 GSMA Intelligence
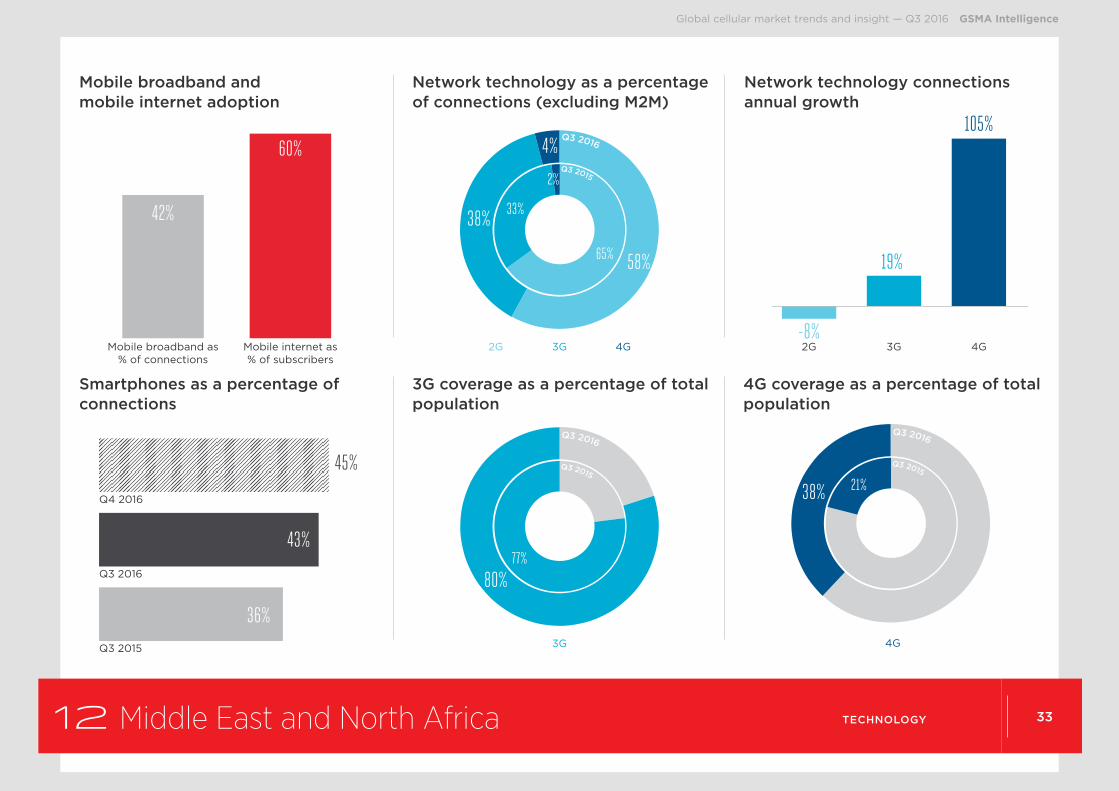
Q3 2015
Q3 2016
Q4 2016
36%
43%
45% ����������80%77%
3G
Q3 2016
Q3 2015
4G3G2G
�������-8%
19%
105%
��������������58%65%
33%
2%
38%
4%
2G 3G 4G
Q3 2016
Q3 2015
Mobile internet as percent of subscribersMobile broadband as percent of connections
Mobile internet as% of subscribers
Mobile broadband as% of connections
42%
60%
12 Middle East and North Africa TECHNOLOGY
3G coverage as a percentage of total population
Smartphones as a percentage of connections
Network technology connections annual growth
Network technology as a percentage of connections (excluding M2M)
Mobile broadband and mobile internet adoption
�����4G
����������21%38%
Q3 2016
Q3 2015
4G coverage as a percentage of total population

2 Regional 34
Global cellular market trends and insight — Q3 2016 GSMA Intelligence
EBITDA %Opex %Capex %
16%17%
69%67%
31%37%
Q3 2016Q3 2015
Other non-voiceDataVoice
Q3 2016Q3 2015
59%60%
28%26%13%13%
Blended ARPU
Voice ARPU
Data ARPU
$2.3
$4.7
$8.0OFCF
EBITDA
Capex
Opex
Data revenue
Non-voice revenue
Voice revenue
Non-recurring revenue
Recurring (service) revenue
Total revenue $18
$16
$2$9
$7
$4
$13
$3
$6
$3
Percentage of total revenuePercentage of recurring (service) revenue
ARPUMobile operator financials ($ billion)
12 Middle East and North Africa FINANCIALS

35
Global cellular market trends and insight — Q3 2016 GSMA Intelligence
Q4 2016Q3 2016Q3 2015
1.4%
3.6% 3.8%
Q4 2016Q3 2016Q3 2015
-13.2%
8.5%
-15.7%
Q4 2016Q3 2016Q3 2015
-58.0%
-5.1%-3.9%
Q4 2016Q3 2016Q3 2015
9.6%
27.2%
5.3%
Q4 2016Q3 2016Q3 2015
2.2%
4.5%
-0.9%
EBITDA annual growthOpex annual growth
Capex annual growthData revenue annual growthTotal recurring (service) revenue annual growth
12 Middle East and North Africa FINANCIAL GROWTH
36
Global cellular market trends and insight — Q3 2016 GSMA Intelligence
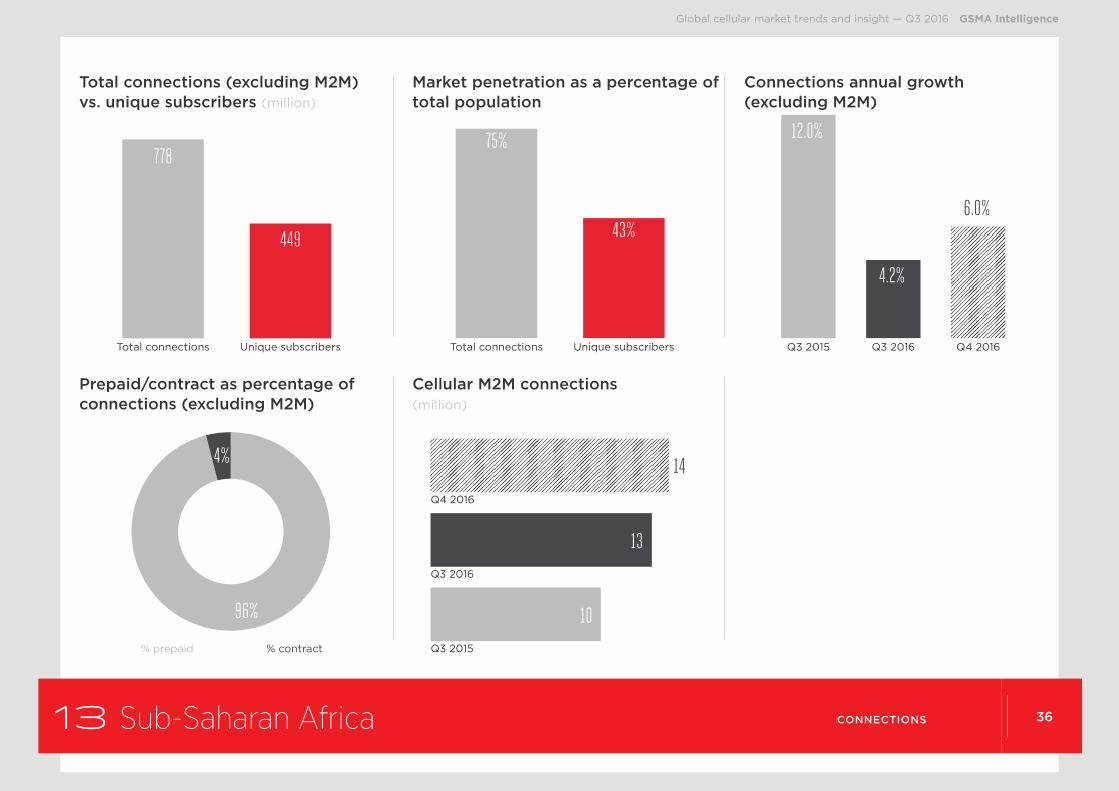
13 Sub-Saharan Africa CONNECTIONS
�����4%
96%
% prepaid % contract
�����Q3 2015
Q3 2016
Q4 2016
10
13
14
Q4 2016Q3 2016Q3 2015
12.0%
4.2%
6.0%
Unique subscribersTotal connections
43%
75%
Unique subscribersTotal connections
778
449
Prepaid/contract as percentage of connections (excluding M2M)
Cellular M2M connections (million)
Connections annual growth (excluding M2M)
Market penetration as a percentage of total population
Total connections (excluding M2M) vs. unique subscribers (million)

37
Global cellular market trends and insight — Q3 2016 GSMA Intelligence
Q3 2015
Q3 2016
Q4 2016
20%
27%
28% ����������48% 47%
3G
Q3 2016
Q3 2015
��������������69%
76%
23%1%29%
2%
2G 3G 4G
Q3 2016
Q3 2015
Mobile internet as percent of subscribersMobile broadband as percent of connections
Mobile internet as% of subscribers
Mobile broadband as% of connections
31%
61%
4G3G2G
������� -6%
33%
146%
13 Sub-Saharan Africa TECHNOLOGY
3G coverage as a percentage of total population
Smartphones as a percentage of connections
Network technology connections annual growth
Network technology as a percentage of connections (excluding M2M)
Mobile broadband and mobile internet adoption
����� ����������15%26%
Q2 2016
Q2 2015
4G
4G coverage as a percentage of total population

2 Regional 38
Global cellular market trends and insight — Q3 2016 GSMA Intelligence
EBITDA %OpexCapex
19% 16%
64%66%
36%35%
Q3 2016Q3 2015
Other non-voiceDataVoice
69%70%
21%20%10%11%
Q3 2016Q3 2015
Blended ARPU
Voice ARPU
Data ARPU
$0.8
$3.0
$4.3OFCF
EBITDA
Capex
Opex
Data revenue
Non-voice revenue
Voice revenue
Non-recurring revenue
Recurring (service) revenue
Total revenue $11
$10
$1$7
$3
$2
$7
$4
$2
$2
Percentage of total revenuePercentage of recurring (service) revenue
ARPUMobile operator financials ($ billion)
13 Sub-Saharan Africa FINANCIALS
39
Global cellular market trends and insight — Q3 2016 GSMA Intelligence
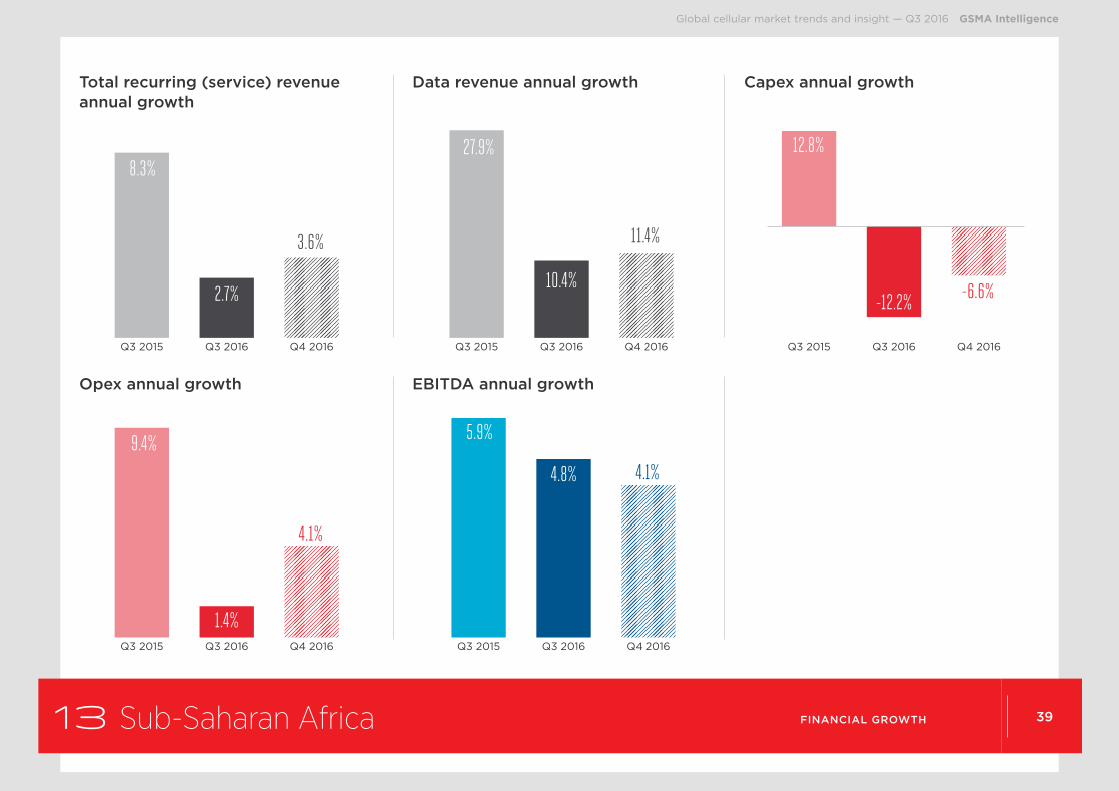
Q4 2016Q3 2016Q3 2015
4.1%
9.4%
1.4%Q4 2016Q3 2016Q3 2015
5.9%
4.8% 4.1%
Q4 2016Q3 2016Q3 2015
-6.6%
12.8%
-12.2%
Q4 2016Q3 2016Q3 2015
11.4%
27.9%
10.4%
Q4 2016Q3 2016Q3 2015
3.6%
8.3%
2.7%
EBITDA annual growthOpex annual growth
Capex annual growthData revenue annual growthTotal recurring (service) revenue annual growth
13 Sub-Saharan Africa FINANCIAL GROWTH

40
Global cellular market trends and insight — Q3 2016 GSMA Intelligence
14 Least Developed Countries CONNECTIONS
�����3%
97%
% prepaid % contract
�����Q3 2015
Q3 2016
Q4 2016
2
3
3
Q4 2016Q3 2016Q3 2015
15.9%
5.2%
6.0%
Unique subscribersTotal connections
42%
68%
Unique subscribersTotal connections
671
414
Prepaid/contract percent of connections (excluding M2M)
Cellular M2M connections (million)
Connections annual growth (excluding M2M)
Market penetration as a percentage of total population
Total connections (excluding M2M) vs. unique subscribers (million)

41
Global cellular market trends and insight — Q3 2016 GSMA Intelligence
Q3 2015
Q3 2016
Q4 2016
21%
28%
30% ����������53% 49%
3G
Q3 2016
Q3 2015
4G3G2G
������� -5%
44%
186%
��������������73%
80%
19%0%
26%
1%
2G 3G 4G
Q3 2016
Q3 2015
Mobile internet as percent of subscribersMobile broadband as percent of connections
Mobile internet as% of subscribers
Mobile broadband as% of connections
27%
54%
14 Least Developed Countries TECHNOLOGY
3G coverage as a percentage of total population
Smartphones as a percentage of connections
Network technology connections annual growth
Network technology as a percentage of connections (excluding M2M)
Mobile broadband and mobile internet adoption
����� ����������6%
11%Q3 2016
Q3 2015
4G
4G coverage as a percentage of total population

2 Regional 42
Global cellular market trends and insight — Q3 2016 GSMA Intelligence
EBITDA %Opex %Capex %
17%24%
63%64%
37%37%
Q3 2016Q3 2015
Other non-voice %Data %Voice %
75%76%
14%12% 11%12%
Q3 2016Q3 2015
Blended ARPU
Voice ARPU
Data ARPU
$0.5
$2.7
$3.6OFCF
EBITDA
Capex
Opex
Data revenue
Non-voice revenue
Voice revenue
Non-recurring revenue
Recurring (service) revenue
Total revenue $7
$7
$0$5
$2
$1
$5
$3
$2
$1
Percentage of total revenuePercentage of recurring (service) revenue
ARPUMobile operator financials ($ billion)
14 Least Developed Countries FINANCIALS

43
Global cellular market trends and insight — Q3 2016 GSMA Intelligence
Q4 2016Q3 2016Q3 2015
5.1%
16.7%
5.8%
Q4 2016Q3 2016Q3 2015
15.1%
5.9%
8.4%
Q4 2016Q3 2016Q3 2015
0.9%
27.8%
-25.7%
Q4 2016Q3 2016Q3 2015
17.6%
38.3%
16.0%
Q3 2016Q3 2016Q3 2015
6.4%
17.2%
5.2%
EBITDA annual growthOpex annual growth
Capex annual growthData revenue annual growthTotal recurring (service) revenue annual growth
14 Least Developed Countries FINANCIAL GROWTH
About GSMA Intelligence
Whilst every care is taken to ensure the accuracy of the information contained in this material, the facts,
estimates and opinions stated are based on information and sources which, while we believe them to be
reliable, are not guaranteed. In particular, it should not be relied upon as the sole source of reference in
relation to the subject matter. No liability can be accepted by GSMA Intelligence, its directors or employees
for any loss occasioned to any person or entity acting or failing to act as a result of anything contained in or
omitted from the content of this material, or our conclusions as stated. The findings are GSMA Intelligence’s
current opinions; they are subject to change without notice. The views expressed may not be the same as
those of the GSM Association. GSMA Intelligence has no obligation to update or amend the research or to let
anyone know if our opinions change materially.
© GSMA Intelligence 2016. Unauthorised reproduction prohibited.
Please contact us at [email protected] or visit gsmaintelligence.com.
GSMA Intelligence does not reflect the views of the GSM Association, its subsidiaries or its members.
GSMA Intelligence does not endorse companies or their products.
GSMA Intelligence, The Walbrook Building, 25 Walbrook, London EC4N 8AF
GSMA Intelligence is the definitive source of mobile operator data, analysis and forecasts, delivering the most accurate and complete set of industry metrics available.
Relied on by a customer base of over 800 of the world’s leading mobile operators, device vendors, equipment manufacturers and financial and consultancy firms, the data set is the most scrutinised in the industry.
With over 30 million individual data points (updated daily), the service provides coverage of the performance of all 1,400+ operators and 1,200+ MVNOs across 4,500+ networks, 77 groups and 238 countries and territories worldwide.