Embed Size (px)
Citation preview

How to Present Results to
GET RESULTS// PRESENTED BY:Lea Pica, Search DiscoverySearchLove 2016

You may never approach
THE SAME WAY AGAINhow you present data

CAMPAIGN RESULTS?Can you present some

HARDWorking

Your Exciting
DATA!

RUH-ROH.

Into the dreaded…


Why do BAD THINGS ?happen to good data

Meet your audience’s
BRAINHi.

`You have only
8 SECONDS
to grab their
ATTENTION
Source: John Medina, Brain Rules.

Uh...what was that?

Repetition commits information to LONG-TERM MEMORY.
Repetition commits information to LONG-TERM MEMORY.
Repetition commits information to LONG-TERM MEMORY.

HEY THERE.I DON’T CARE ABOUT WHAT YOU DO ALL DAY.
Show me how to move my business forward
In a way I understand quickly and easily
And in a way that makes me want to act.
PS – Gimme a count of hits anyway.

#1: Maintain ATTENTION#2: Be MEMORABLE

STAND OUTHelp your data

PRESENTATION
Be Your AUDIENCE
Use Your Tools Maximize DataWISELY ABSORPTION
Three Pillars of
Enlightenment

Handle: @LEAPICAHashtag: #SEARCHLOVE

1be your AUDIENCE


CAMPAIGN RESULTS?Can you present some

What do I really
WANT?

WHAT’S THE BIGSTORY?

STATEMENT TO insight
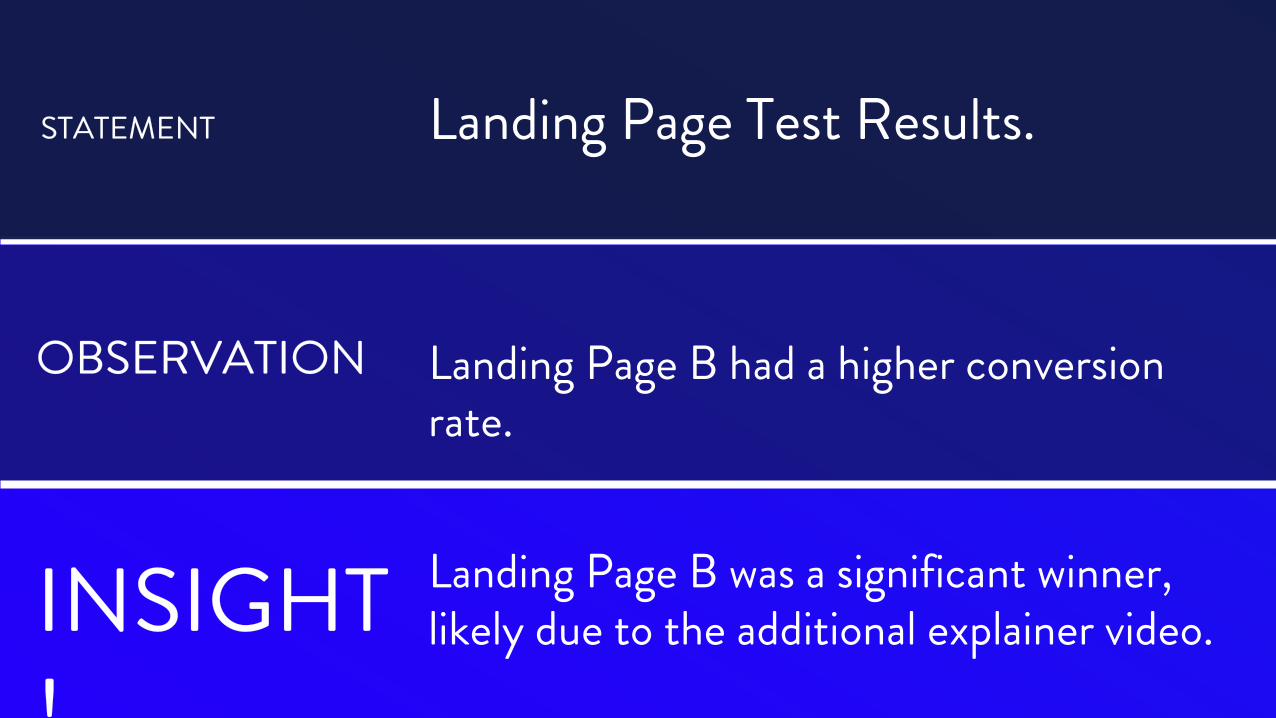
STATEMENT Landing Page Test Results.
OBSERVATION Landing Page B had a higher conversion rate.
INSIGHT!
Landing Page B was a significant winner, likely due to the additional explainer video.

2use your tools WISELY


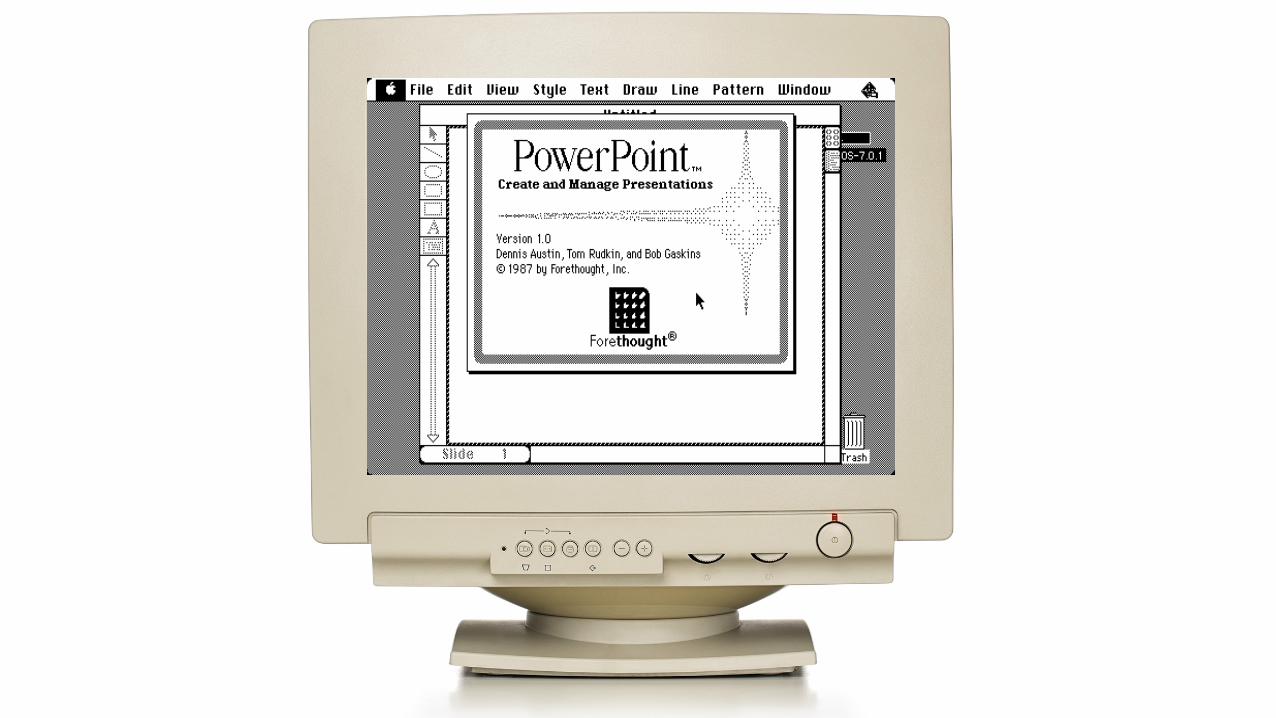

DOMINATIONPresentation

Used over350 TIMESEVERY SECOND!
Source: Businessweek, 2012.
(including right now)


PEOPLE PROBLEMIt’s a
We need moreCONTROL

CONTROL #1…

Unload the BULLET POINTS
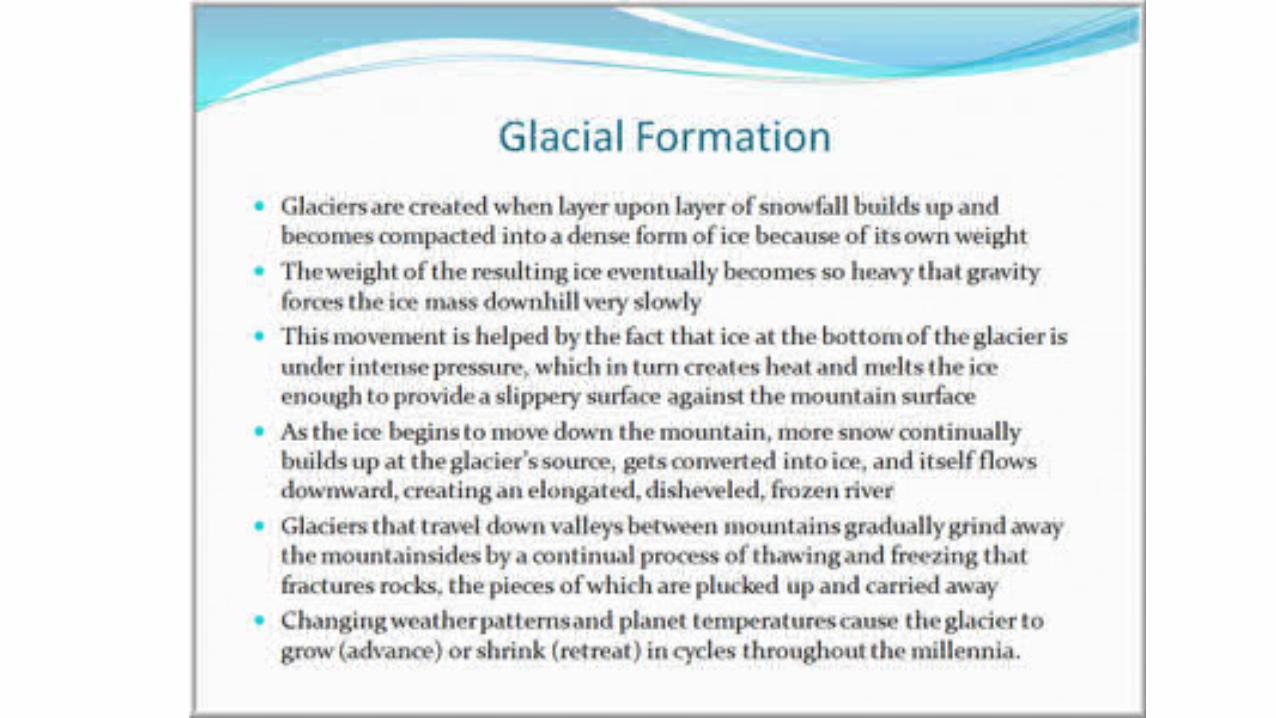
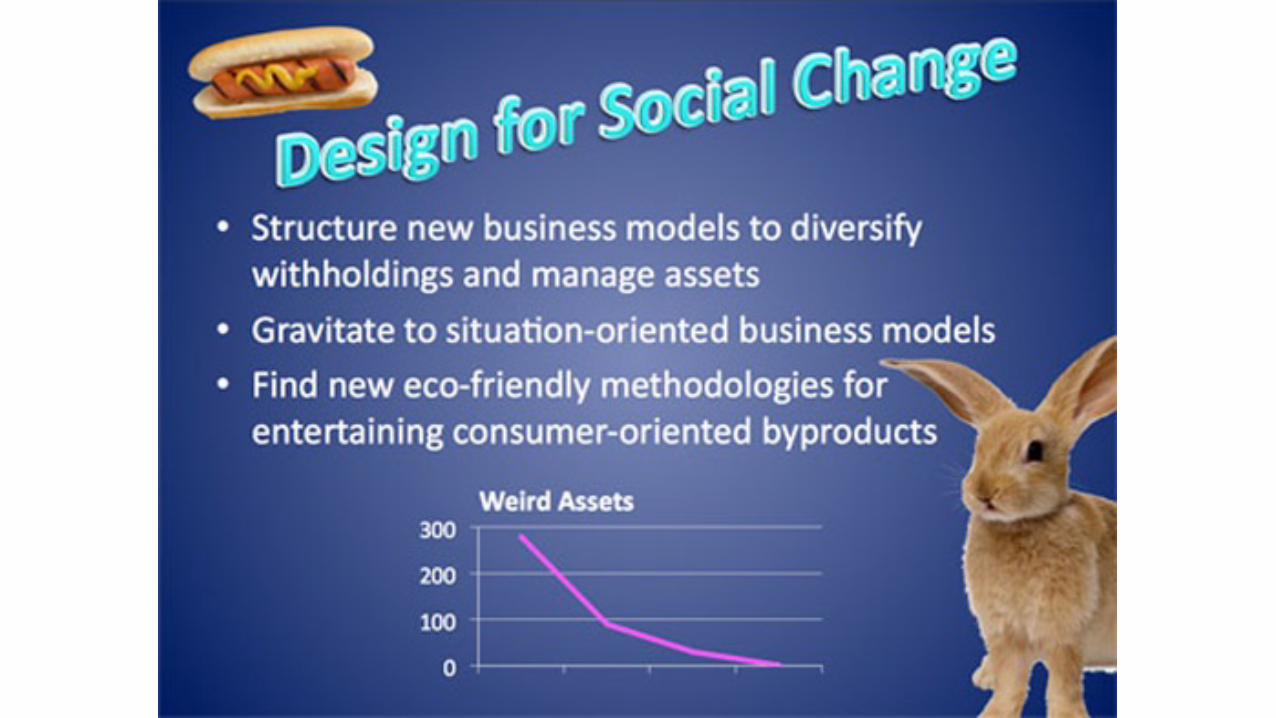
Truly Bad Slides

Bullet points expose all of your information to the
audience at once.

Why do we love ourBULLET POINTS?


Your slides are for yourAUDIENCENOT YOU.

CONTROL #2…

Harness the power ofREAL IMAGERY

John MedinaBRAIN RULES

Vision is theSTRONGESThuman sense
Source: Brain Rules, John Medina.

Imagery
RECALLincreases

EMOTIONImages stir

Tell theirSTORY

Storytelling activates the...Sensory / CerebellumMotor CortexBroca’s areaAuditory cortexOlfactory cortexWernicke’s areaVisual cortex

ConversionResults• 80%ofmobilesearchvisitorsabandoned
ourleadcaptureform.• Thisispotentiallyduetooursearchlanding
pagenotbeingresponsiveandittotallysucked.

80% of Mobile Search VisitorsABANDONED OUR LANDING PAGE!

Why?
The page wasn’t responsiveas previously thought!
80%of Mobile Search VisitorsABANDON OUR LANDING PAGE!

Your data isIMAGERY!

3maximize theirDATA ABSORPTION

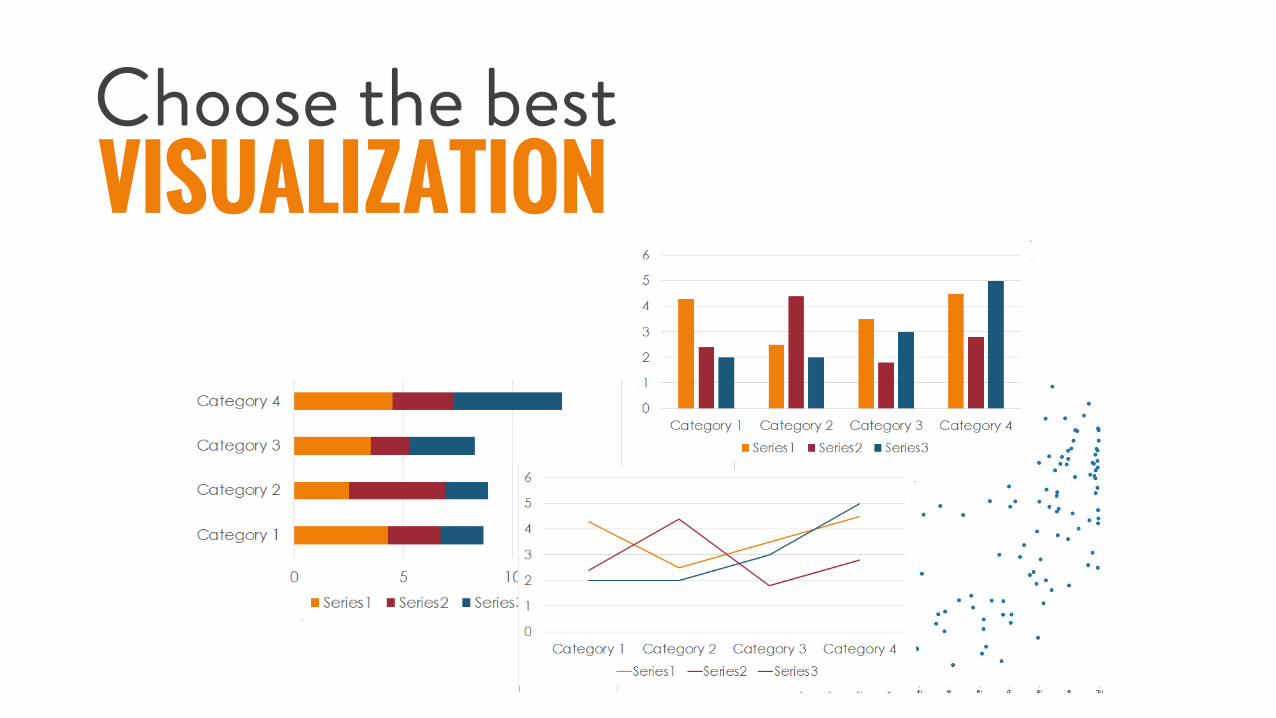
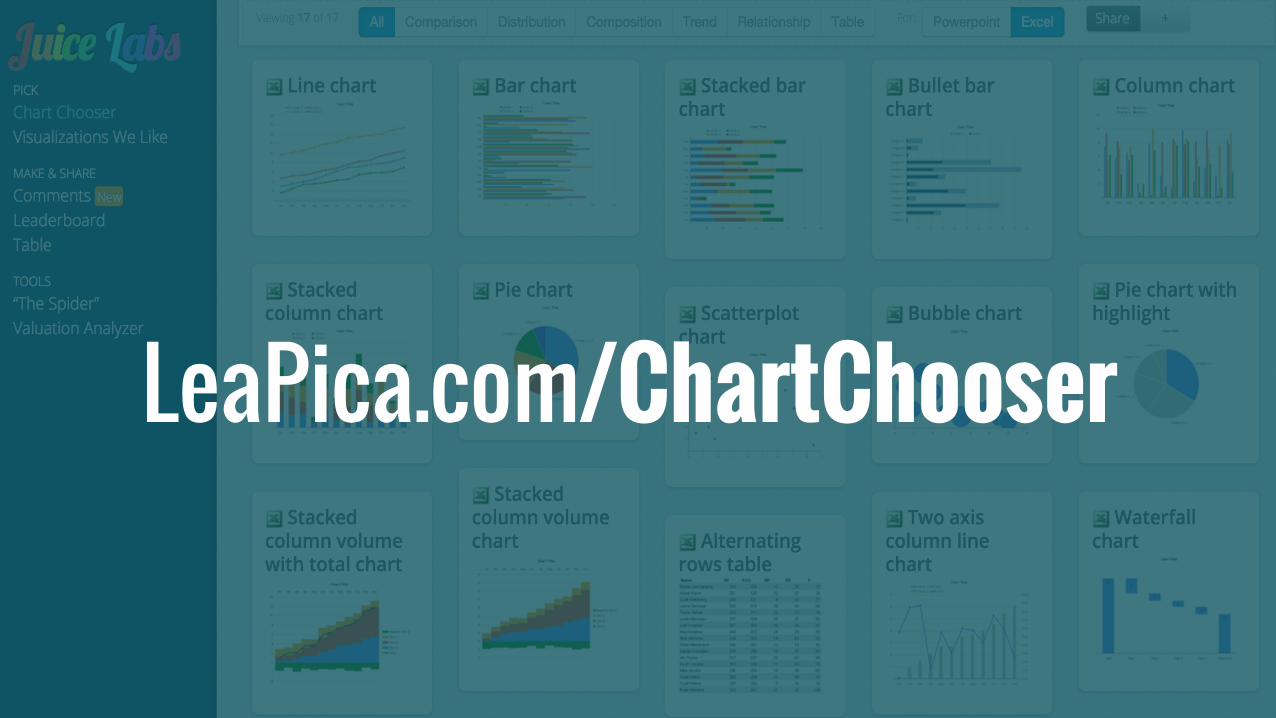
VISUALIZATIONChoose the best

CHART CHOOSERJuice Analytics
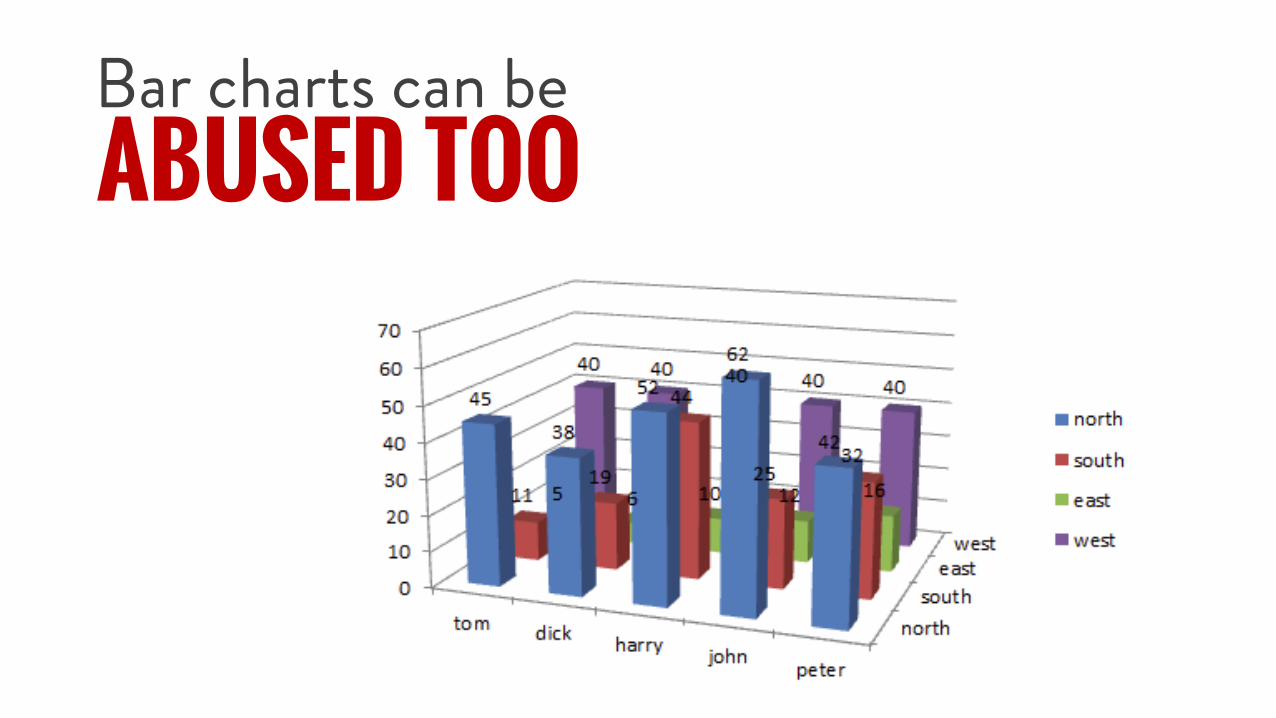
Bar charts can beABUSED TOO

Let’s doDETOX!

CHART DETOX
03581114161922252730333638414447495255586063666971747779828588909396991011041071101121151181211231261291321341371401431451481511531561591621641671701731751781811841861891921951972002032062082112142162192222252272302332362382412442472492522552582602632662692712742772802822852882902932962993013043073103123153183213233263293323343373403433453483513543563593623643673703733753783813843863893923953974004034064084114144174194224254284304334364384414444474494524554584604634664694714744774804824854884914934964995025045075105125155185215235265295325345375405435455485515545565595625655675705735765785815845865895925955976006036066086116146176196226256286306336366396416446476496526556586606636666696716746776806826856886916936966997027047077107137157187217237267297327347377407437457487517547567597627657677707737767787817847877897927957978008038068088118148178198228258288308338368398418448478508528558588618638668698718748778808828858888918938968999029049079109139159189219249269299329359379409439459489519549569599629659679709739769789819849879899929959981,0001,0031,0061,0091,0111,0141,0171,0191,0221,0251,0281,0301,0331,0361,0391,0411,0441,0471,0501,0521,0551,0581,0611,0631,0661,0691,0721,0741,0771,0801,0821,0851,0881,0911,0931,0961,0991,1021,1041,1071,1101,1131,1151,1181,1211,1241,1261,1291,1321,1351,1371,1401,1431,1461,1481,1511,1541,1561,1591,1621,1651,1671,1701,1731,1761,1781,1811,1841,1871,1891,1921,1951,1981,2001,2031,2061,2091,2111,2141,2171,2201,2221,2251,2281,2301,2331,2361,2391,2411,2441,2471,2501,2521,2551,2581,2611,2631,2661,2691,2721,2741,2771,2801,2831,2851,2881,2911,2941,2961,2991,3021,3041,307
PaidSearch
OrganicSearch
SocialMedia
Display
648
1,305
937
67
180
Conversions

CHART DETOX
1,305937
648180
67
Cell …Comput…
TV & …Car …
Wearab…
Killing 3-DReduce visual noiseData labellingUniform coloring
Conversions by Campaign

CHART DETOX
Strategic coloring 1,305937
648180
67
Cell …Comput…
TV & …Car …
Wearab…
Conversions by Campaign

# OF CONVERSIONS BY CAMPAIGN.Zzzz..
Source: Analytics Inc, 2015.
1,305937
648180
67
Cell PhonesComputersTV & Home …
Car ElectronicsWearable Tech

1,305937
648180
67
Cell PhonesComputersTV & Home …
Car ElectronicsWearable Tech
CELL PHONES GENERATED THE MOST SALES VOLUME...Q1 2016 Search Campaign # of Conversions
Source: Analytics Inc, 2015.
McKinsey Title

1.7%
4.5%
8.4%
0.5%
2.9%
1,305
937
648
180
67
Cell Phones
Computers
TV & Home Theater
Car Electronics
Wearable Tech
...BUT OUR OPPORTUNITY LIES WITH TV/HOME THEATER.Q1 2016 Campaign Channel # Conversions vs. Conversion Rate
Source: Google Adwords, 2015.
# of Conversions Conversion Rate

Dona M. WongWSJ Guide toINFORMATIONGRAPHICS

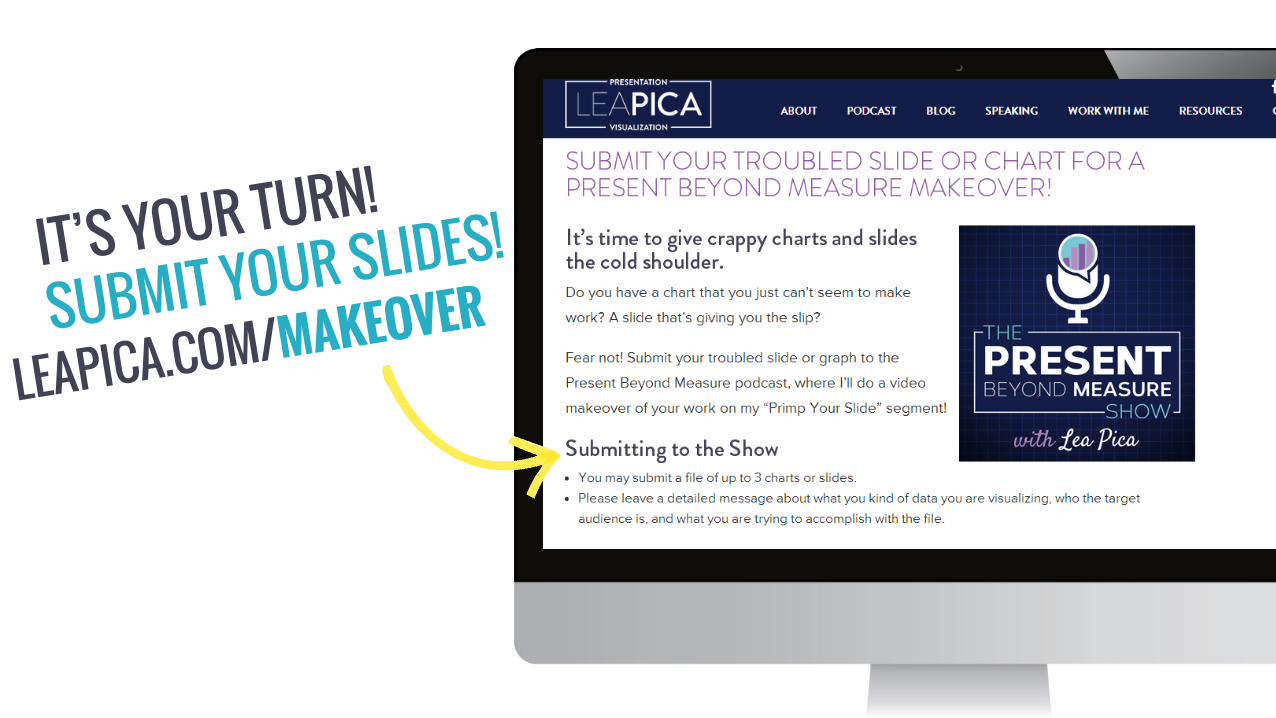
PrimpYour Slide
presents...
Chart & Slide Makeovers!

P.I.C.A.The Methodology:

Credit: Flickr / David Kingham
define: pi·ka1ˈpīkə;/
a small, cold-climate rodent with short limbs and spherical body and sometimes eats dead birds

Credit: Psychology Today.
define: pi·ca1ˈpīkə/an appetite for substances that are largely non-nutritive, such as soil, paper, clay, metal, chalk, glass, or sand


EXTREME VIZ MAKEOVERThe P.I.C.A. Methodology for Actionable Data Visualizations
EXAMPLE #1Dual-Axis Stacked Bar Chart
with Survey Data

~ @DonalPhipps
This submission is an early attempt to classify visitor behaviour.
We want to help marketing stakeholders understand the needs of customers visiting the site, so they can improve the quality & relevance of the online information.
Please don't shoot me for the pie chart, I have subsequently learned the error of my ways.”
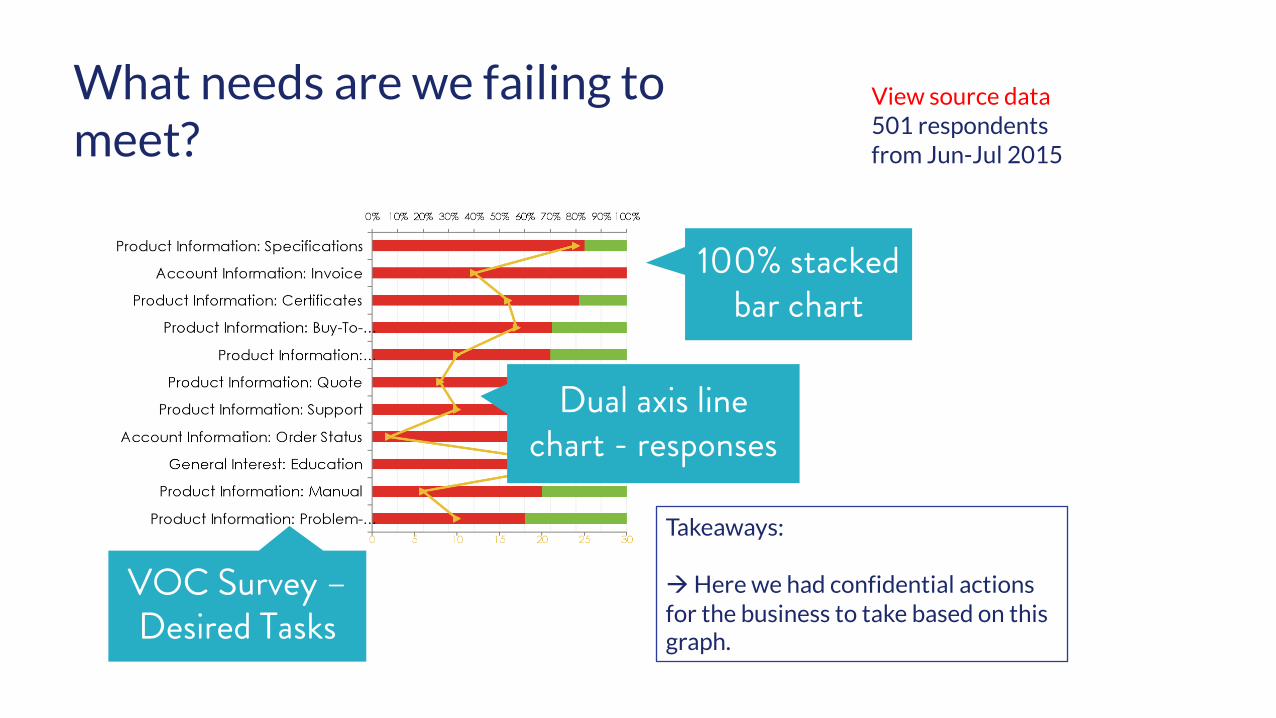
What needs are we failing to meet?
View source data 501 respondents from Jun-Jul 2015
Takeaways:
à Here we had confidential actions for the business to take based on this graph.
VOC Survey –Desired Tasks
100% stacked bar chart
Dual axis line chart - responses

What needs are we failing to meet?
View source data 501 respondents from Jun-Jul 2015
Takeaways:
à Here we had confidential actions for the business to take based on this graph.
Key problem areas not obvious
Dual axis line not labelled
Heavy cognitive load

urposeP

EXIST?Why do I

Q: What tasks had the highest percentage of unsuccessful visits?

VISUALIZATIONChoose the best
DOES NOT KNOWwhat your best chart choice is
Your visualization tool
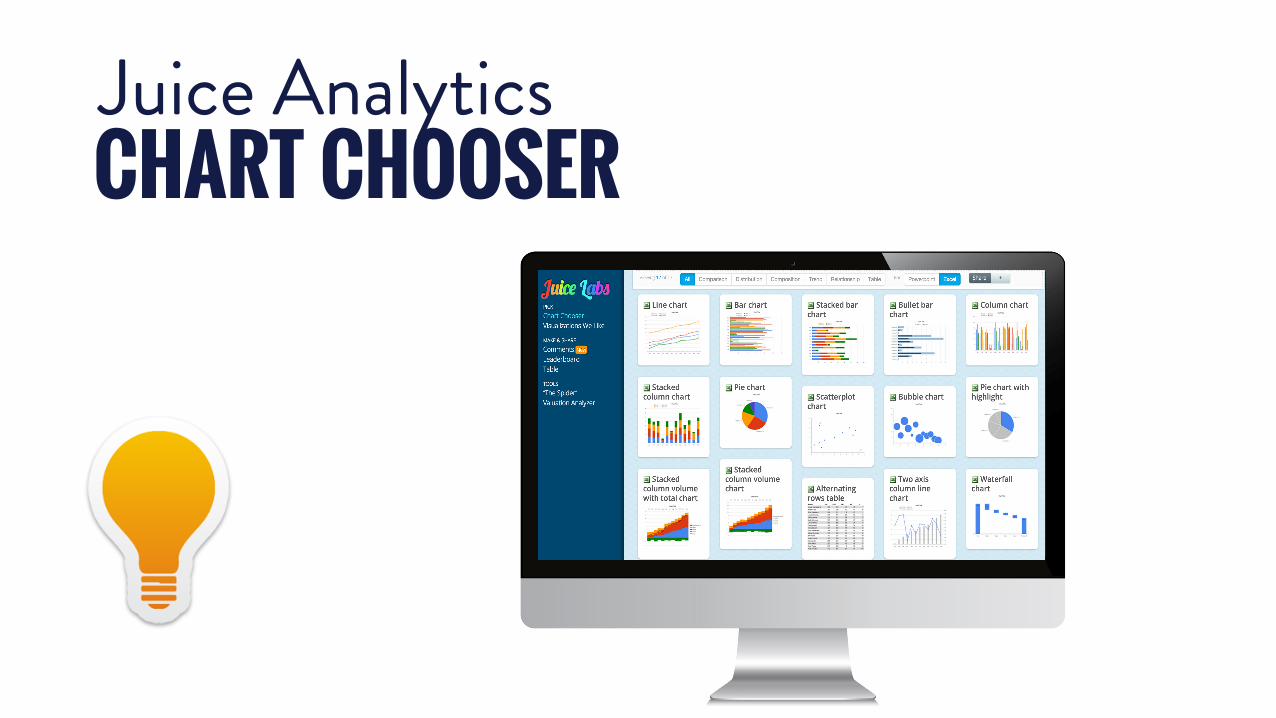
Juice AnalyticsCHART CHOOSER

Dona M. Wong
Chart
Selector
Dona M. WongChartSelector
LeaPica.com/ChartChooser

We need to talk about...
PIE CHARTS

Pie doneWRONG.
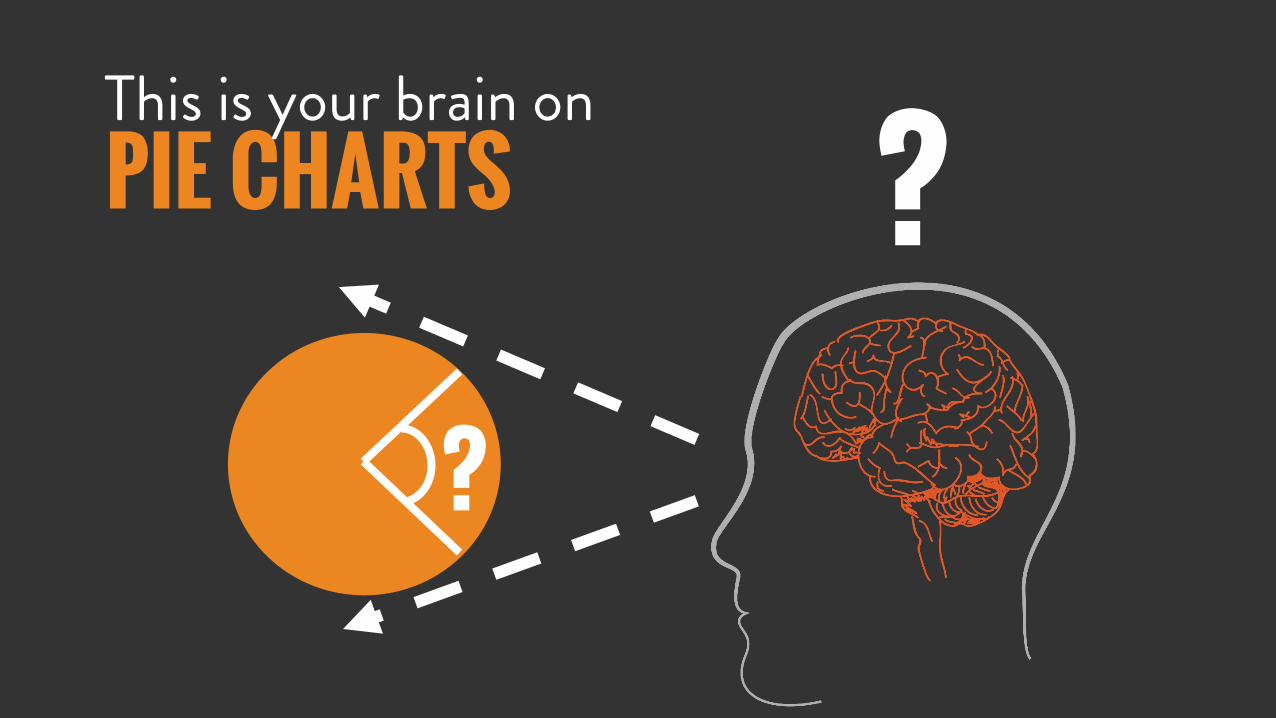
PIE CHARTS ??
This is your brain on

A: 100% Stacked Bar Chart

nsightI

Avinash Kaushik,

http://marketingsales.tyden.cz/rubriky/lide/ondrej-slama-jaky-byl-letosni-marketing-festival-v-brne_323057.html
~ AVINASH KAUSHIK
Analysts need to be able to distinguish betweendata and insights.”
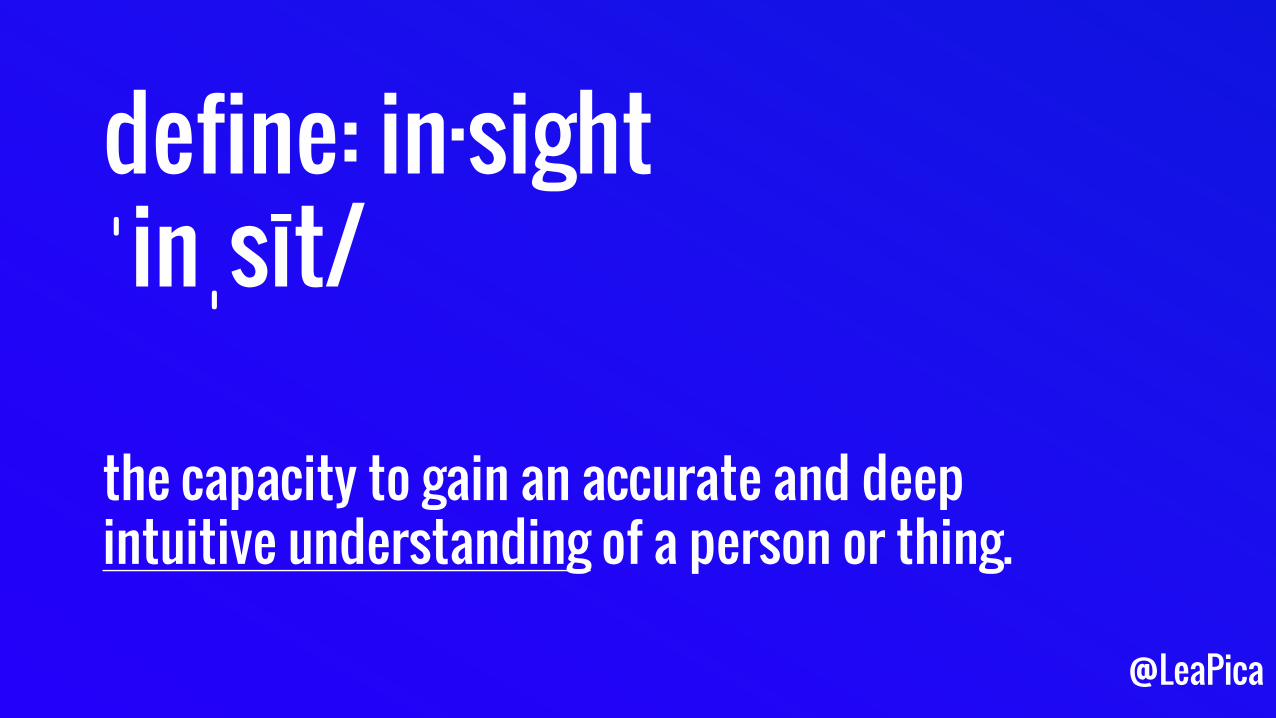
define: in·sightˈinˌsīt/
the capacity to gain an accurate and deep intuitive understanding of a person or thing.
@LeaPica

What needs are we failing to meet?
View source data 501 respondents from Jun-Jul 2015
Takeaways:
à Here we had confidential actions for the business to take based on this graph.

What needs are we failing to meet?
Remove dual axis

DUAL AXIS CHARTS
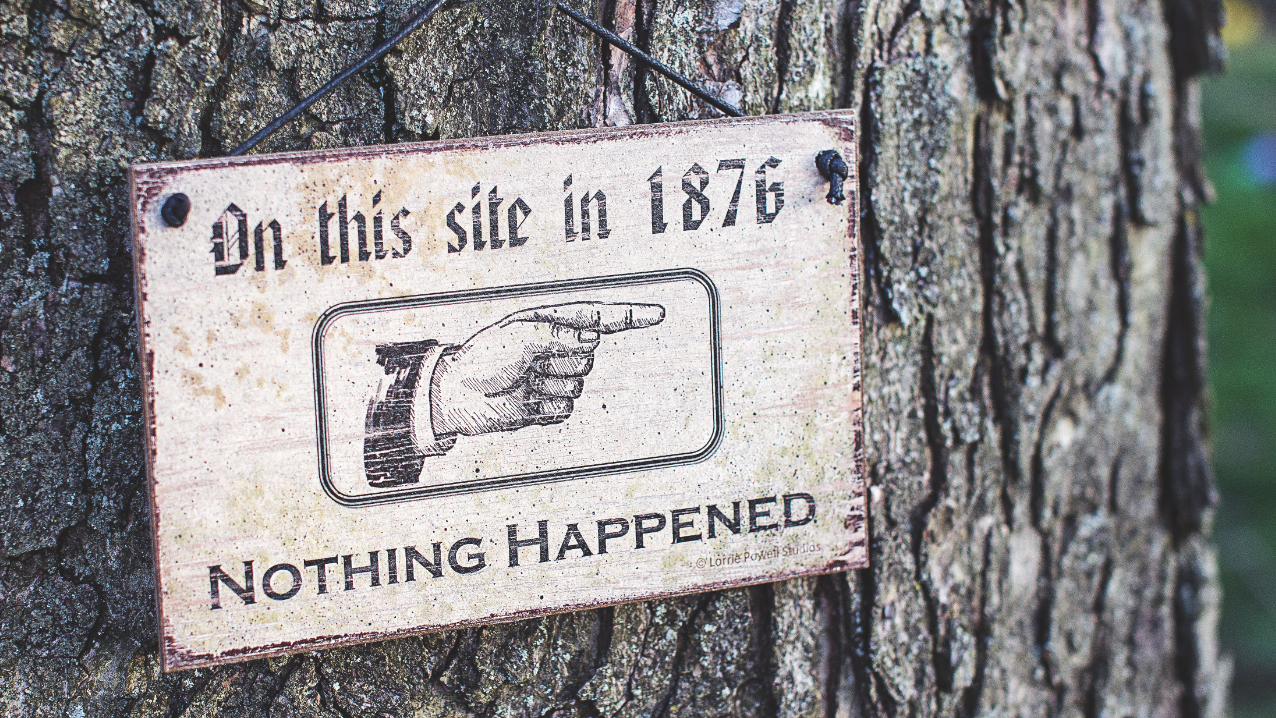
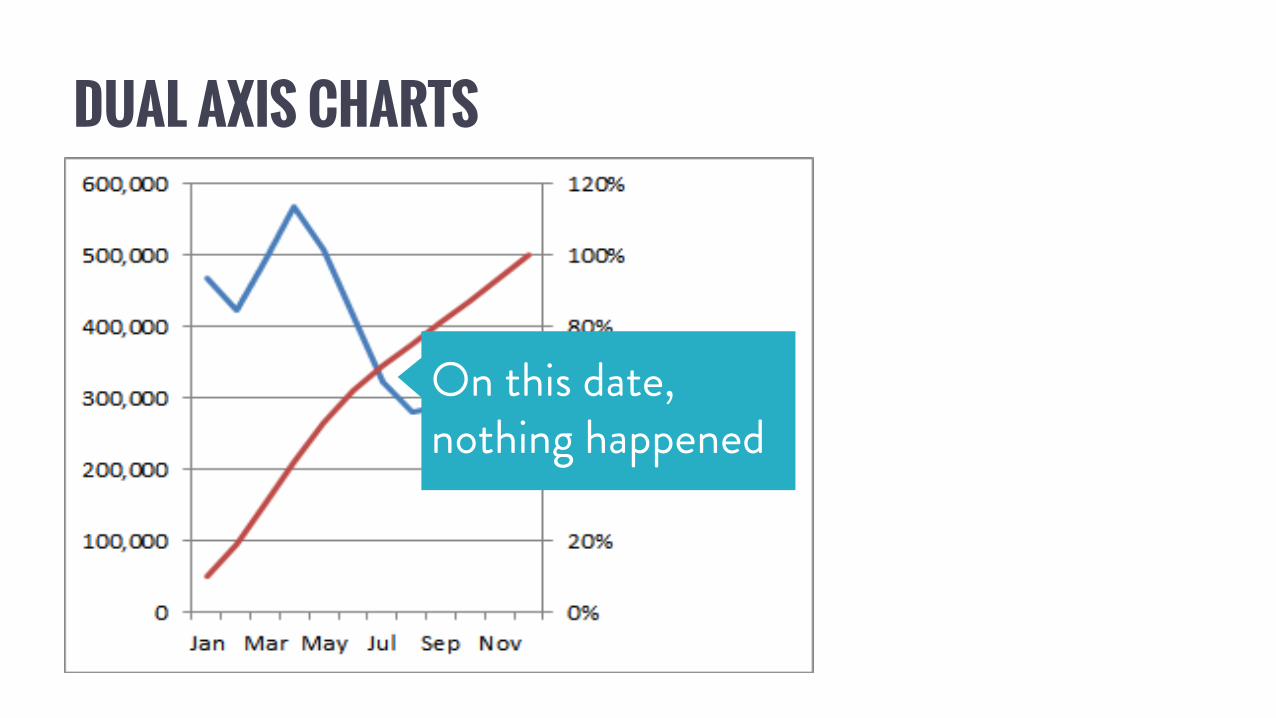
DUAL AXIS CHARTS
On this date, nothing happened

DUAL AXES, DUELING TRUTHS
Tyler Vigen,

SPURIOUS CORRELATIONS

What needs are we failing to meet?
0% 10%
20%
30%
40%
50%
60%
70%
80%
90%
100%
General Interest: Education
Product Information: Problem-Solving
Product Information: Manual
Product Information: Compatability/Cross-…
Product Information: Support
Product Information: Buy-To-Specification
Product Information: Quote
Product Information: Certificates
Product Information: Specifications
Account Information: Invoice
Account Information: Order Status Account information

Account Information Tasks Both Resulted in NO SUCCESSFUL VISITS
0% 10%
20%
30%
40%
50%
60%
70%
80%
90%
100%
General Interest: Education
Product Information: Problem-Solving
Product Information: Manual
Product Information: Compatability/Cross-…
Product Information: Support
Product Information: Buy-To-Specification
Product Information: Quote
Product Information: Certificates
Product Information: Specifications
Account Information: Invoice
Account Information: Order Status
% of Unsuccessful Visits Per User Task
McKinsey Title

ontextC

Q: How does response volume impact our decision?

A:Side-by-side bar chart

Account Information Tasks Both Resulted in NO SUCCESSFUL VISITS
0% 10%
20%
30%
40%
50%
60%
70%
80%
90%
100%
General Interest: Education
Product Information: Problem-Solving
Product Information: Manual
Product Information: …
Product Information: Support
Product Information: Buy-To-…
Product Information: Quote
Product Information: Certificates
Product Information: Specifications
Account Information: Invoice
Account Information: Order Status
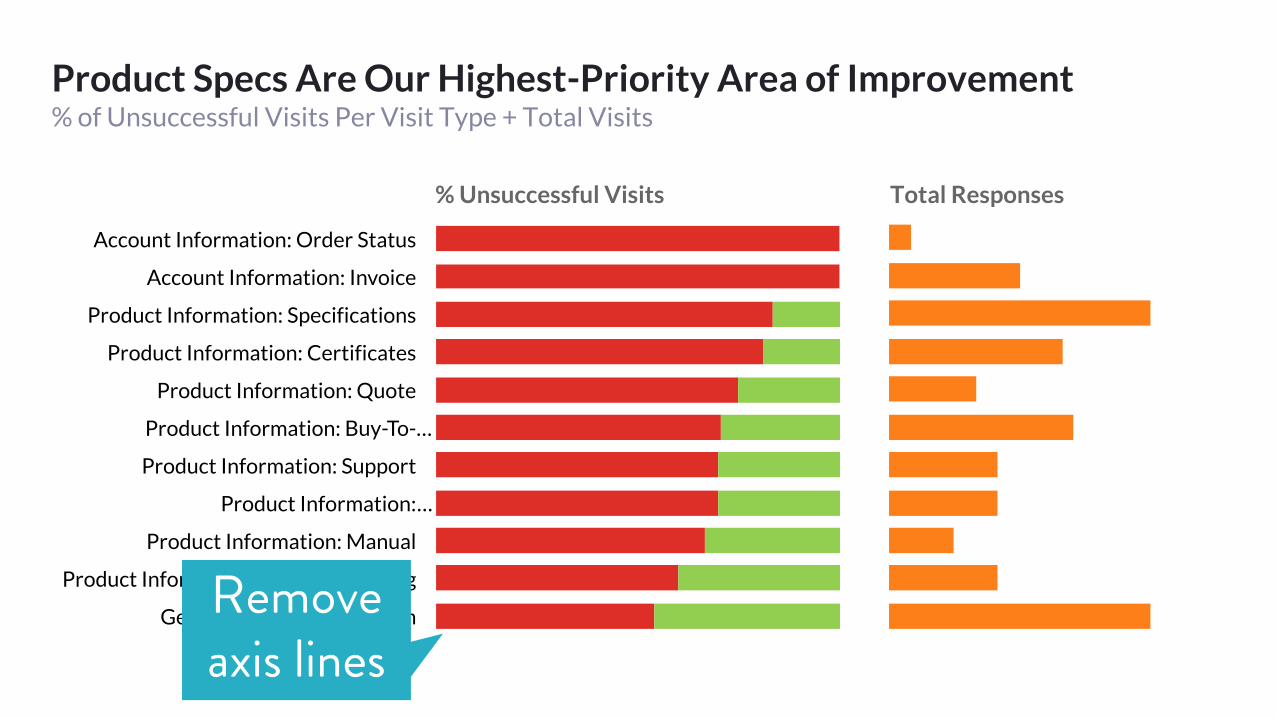
% of Unsuccessful Visits Per User Task + Total Visits
0 5 10 15 20 25 30
% Unsuccessful Visits Total Responses

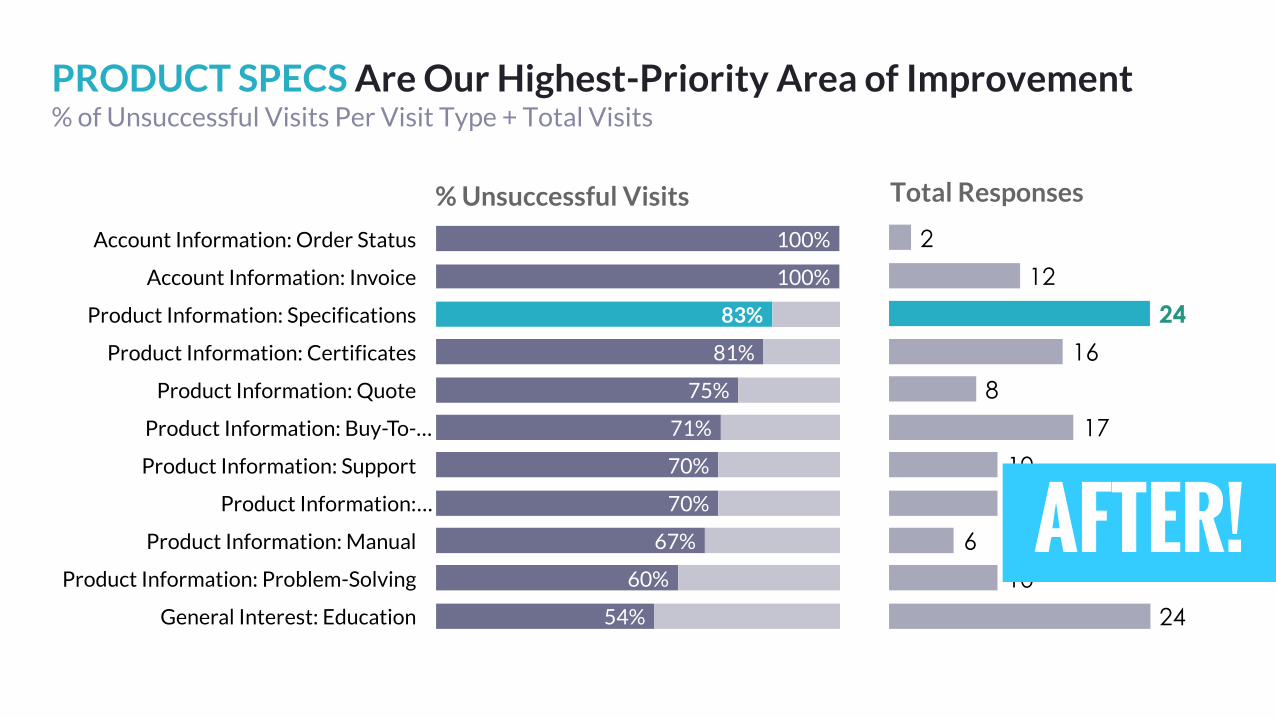
Product Specs Are Our Highest-Priority Area of Improvement
0% 10%
20%
30%
40%
50%
60%
70%
80%
90%
100%
General Interest: Education
Product Information: Problem-Solving
Product Information: Manual
Product Information: …
Product Information: Support
Product Information: Buy-To-…
Product Information: Quote
Product Information: Certificates
Product Information: Specifications
Account Information: Invoice
Account Information: Order Status
% of Unsuccessful Visits Per User Task + Total Visits
0 5 10 15 20 25 30
% Unsuccessful Visits Total VisitsAdjust headline

estheticsA

Product Specs Are Our Highest-Priority Area of Improvement
0%
10
%
20
%
30
%
40
%
50
%
60
%
70
%
80
%
90
%
10
0%
General Interest: Education
Product Information: Problem-Solving
Product Information: Manual
Product Information: …
Product Information: Support
Product Information: Buy-To-…
Product Information: Quote
Product Information: Certificates
Product Information: Specifications
Account Information: Invoice
Account Information: Order Status
% of Unsuccessful Visits Per Visit Type + Total Visits
0 5 10 15 20 25 30
% Unsuccessful Visits Total Responses
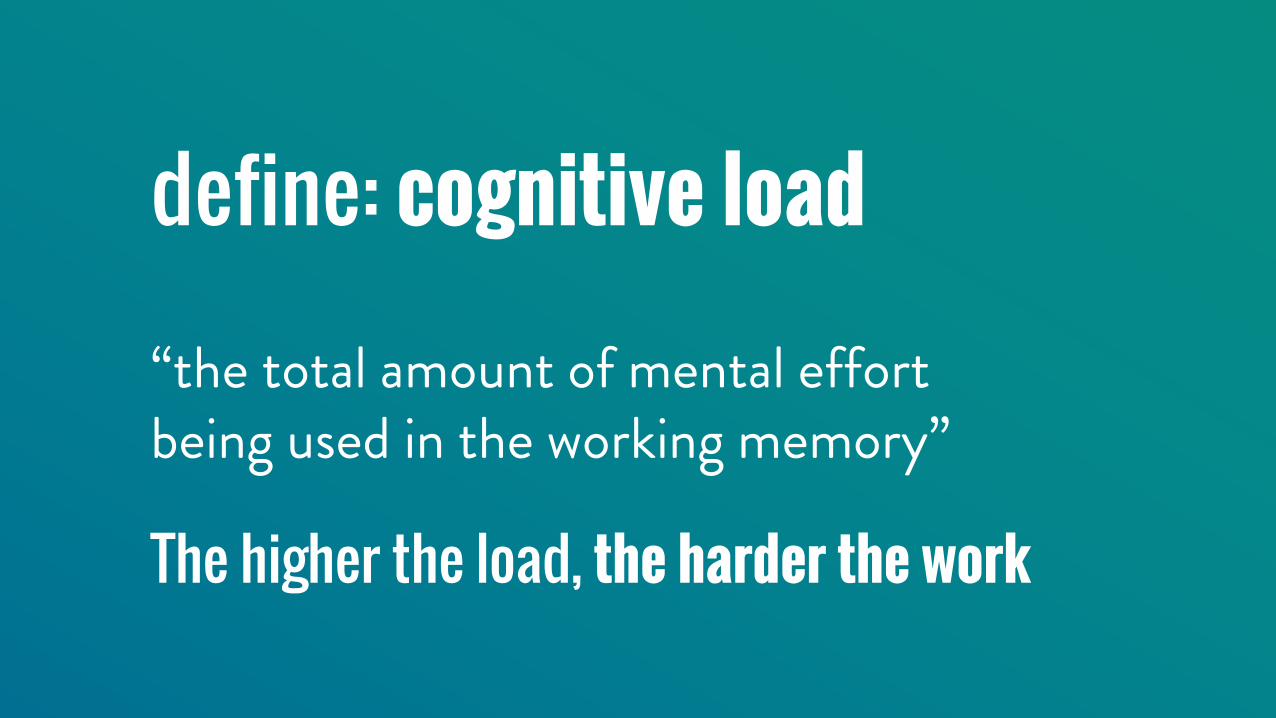
define: cognitive load
“the total amount of mental effort being used in the working memory”
The higher the load, the harder the work

Let’s doDETOX!

Product Specs Are Our Highest-Priority Area of Improvement
0%
10
%
20
%
30
%
40
%
50
%
60
%
70
%
80
%
90
%
10
0%
General Interest: Education
Product Information: Problem-Solving
Product Information: Manual
Product Information: …
Product Information: Support
Product Information: Buy-To-…
Product Information: Quote
Product Information: Certificates
Product Information: Specifications
Account Information: Invoice
Account Information: Order Status
% of Unsuccessful Visits Per Visit Type + Total Visits
0 5 10 15 20 25 30
% Unsuccessful Visits Total Responses
Decrease bar gap width to 50%

Product Specs Are Our Highest-Priority Area of Improvement
0%
10
%
20
%
30
%
40
%
50
%
60
%
70
%
80
%
90
%
10
0%
General Interest: Education
Product Information: Problem-Solving
Product Information: Manual
Product Information: …
Product Information: Support
Product Information: Buy-To-…
Product Information: Quote
Product Information: Certificates
Product Information: Specifications
Account Information: Invoice
Account Information: Order Status
% of Unsuccessful Visits Per Visit Type + Total Visits
0 5 10 15 20 25 30
% Unsuccessful Visits Total Responses
Remove gridlines
Product Specs Are Our Highest-Priority Area of Improvement
General Interest: Education
Product Information: Problem-Solving
Product Information: Manual
Product Information: …
Product Information: Support
Product Information: Buy-To-…
Product Information: Quote
Product Information: Certificates
Product Information: Specifications
Account Information: Invoice
Account Information: Order Status
% of Unsuccessful Visits Per Visit Type + Total Visits
% Unsuccessful Visits Total Responses
Remove axis lines
Product Specs Are Our Highest-Priority Area of Improvement
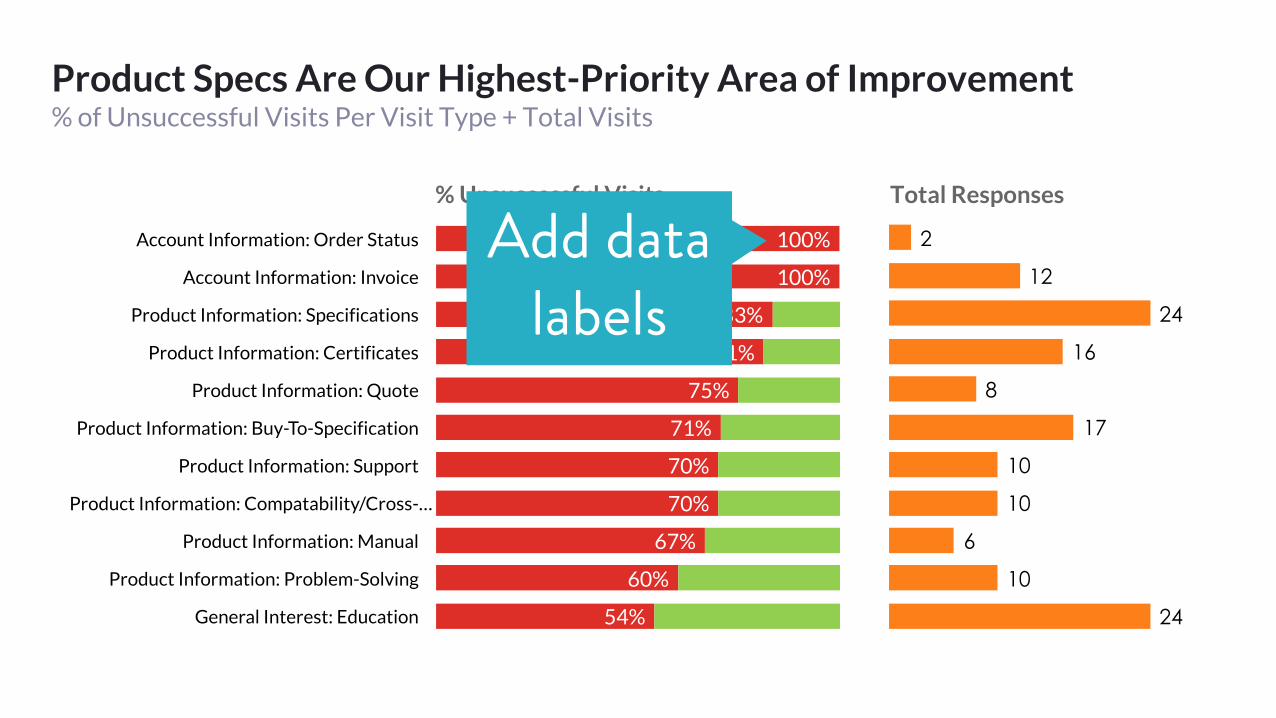
54%
60%
67%
70%
70%
71%
75%
81%
83%
100%
100%
General Interest: Education
Product Information: Problem-Solving
Product Information: Manual
Product Information: Compatability/Cross-…
Product Information: Support
Product Information: Buy-To-Specification
Product Information: Quote
Product Information: Certificates
Product Information: Specifications
Account Information: Invoice
Account Information: Order Status
% of Unsuccessful Visits Per Visit Type + Total Visits
24
10
6
10
10
17
8
16
24
12
2
% Unsuccessful Visits Total Responses
Add data labels

Product Specs Are Our Highest-Priority Area of Improvement
54%
60%
67%
70%
70%
71%
75%
81%
83%
100%
100%
General Interest: Education
Product Information: Problem-Solving
Product Information: Manual
Product Information: …
Product Information: Support
Product Information: Buy-To-…
Product Information: Quote
Product Information: Certificates
Product Information: Specifications
Account Information: Invoice
Account Information: Order Status
% of Unsuccessful Visits Per Visit Type + Total Visits
2410
61010
178
1624
122
% Unsuccessful Visits Total Responses
Recolor to gray shades

PRODUCT SPECS Are Our Highest-Priority Area of Improvement
54%
60%
67%
70%
70%
71%
75%
81%
83%
100%
100%
General Interest: Education
Product Information: Problem-Solving
Product Information: Manual
Product Information: …
Product Information: Support
Product Information: Buy-To-…
Product Information: Quote
Product Information: Certificates
Product Information: Specifications
Account Information: Invoice
Account Information: Order Status
% of Unsuccessful Visits Per Visit Type + Total Visits
2410
61010
178
1624
122
% Unsuccessful Visits Total Responses
Use highlight color to emphasize

Don’t letEXCEL DECIDEwhat matters to
YOUR AUDIENCE

What needs are we failing to meet?
View source data 501 respondents from Jun-Jul 2015
Takeaways:
à Here we had confidential actions for the business to take based on this graph.
Before...
PRODUCT SPECS Are Our Highest-Priority Area of Improvement
54%
60%
67%
70%
70%
71%
75%
81%
83%
100%
100%
General Interest: Education
Product Information: Problem-Solving
Product Information: Manual
Product Information: …
Product Information: Support
Product Information: Buy-To-…
Product Information: Quote
Product Information: Certificates
Product Information: Specifications
Account Information: Invoice
Account Information: Order Status
% of Unsuccessful Visits Per Visit Type + Total Visits
2410
61010
178
1624
122
% Unsuccessful Visits Total Responses
AFTER!

uper secret chartshhhhhh!S
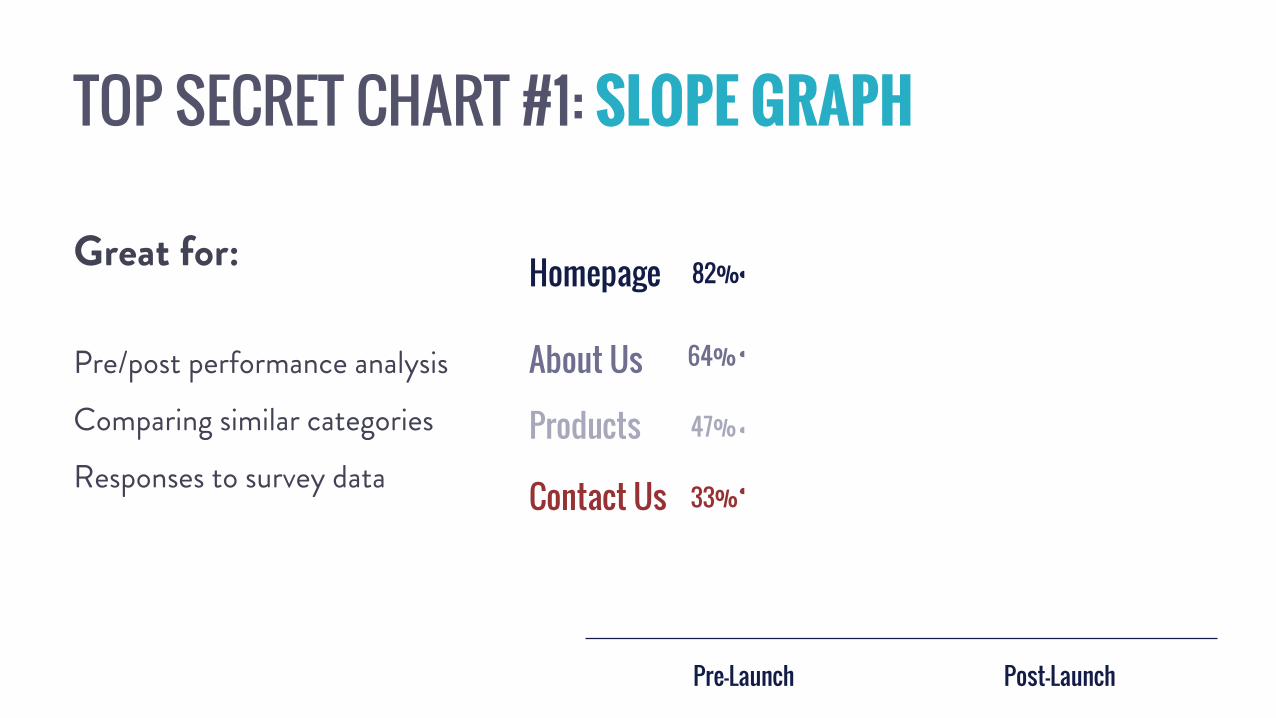
TOP SECRET CHART #1: SLOPE GRAPH
82%
62%64%54%
47%
31%33%39%
Pre-Launch Post-Launch
Homepage
About Us
Products
Contact Us
Great for:
Pre/post performance analysis
Comparing similar categories
Responses to survey data

TOP SECRET CHART #2: DOT PLOT
Great for:
Pre/post performance analysis
Comparing similar categories
Category ranking change
46%
24%
38%
92%
85%
59%
42% 50%

Cole Nussbaumer KnaflicSTORYTELLING WITH DATA

AWESOME VIZ READING LIST

RECAPBe Your
AUDIENCEUse Your Tools Maximize Data
WISELY ABSORPTION
Three Pillars

Be Your AUDIENCE
Use Your Tools Maximize DataWISELY ABSORPTION

Be Your AUDIENCE
Use Your Tools Maximize DataWISELY ABSORPTION

Be Your AUDIENCE
Use Your Tools Maximize DataWISELY ABSORPTION

What challenges do you face?

.com


Facts do notCEASE TO EXIST
IGNOREDbecause they are
~ Aldous Huxley
@LeaPica

VIZ RESPONSIBLY, my friends.


![[CXL Live 16] How To Present Your Testing Results to Get Results by Lea Pica](https://img.dokumen.tips/doc/110x75/587017231a28ab7f428b5b9f/cxl-live-16-how-to-present-your-testing-results-to-get-results-by-lea-pica.jpg)