Embed Size (px)
Citation preview

1
MarketSim ModelingKey elements

2
Steps in a MarketSim projectItem Detail Timeframe Notes
Kick-off & Business
question refinement
Understand the category
Set data gathering scheduling1 to 2 days
ROMI Training First session ½ dayTo the wider marketing
team
Data gathering See separate sheet 1 to 3 wksDepends on Market
Research sophistication
Data set validationInitial data validation, check for
completeness2 to 3 days
Model development and
calibrationDepends on completeness
4 wks to 5
wks
Depends on category
complexity
Preliminary results
presentation
With key decision-maker to make sure
results make sense, deepen business
question understanding
1 day
Includes:
ROMI, Brand elasticity,
price elasticity,
distribution elasticity
Develop
recommendations; answer
business questions
Run simulations to perform
optimization, run sensitivity analyses1 to n wks
Depends on business
question complexity
ROMI TrainingSecond session combined with results
delivery½ day
To the wider marketing
team
Begin 4wkly cycle Develop data update timing & planning ½ day

Data sets Scanner/Transaction data – Nielsen/IRI
Price (promoted/unpromoted) by brand by SKU by channel)
Distr. (weighted distribution) by brand by SKU by channel
Display/Feature (weighted distribution) by brand by SKU by channel
Digital/social
Own - Adobe, Google analytics/Facebook Insights and others
Competitive – SocialBakers
Brand Imagery – monthly, quarterly, 6-monthly, annually, (whatever is available. If none available, field a study at begin and end of project)
Brand association scores
Initial awareness and persuasion; Prior use
Usage and Attitudes for general category knowledge and dynamics
Mass Media – From agency
PR – if available for major events
BTL (Trade) – From sales team for costs of consumer/trade promotions
Product attribute (functional) breakdown
Generated with help from client for functional attributes. This can also be read from IRI product classifications
Product profit margins by SKU – only needed if optimizing price or if ROI is desired
Internal data sources

MarketSim timeframes
Strategic marketing decision support
4
Initial conditions
• Awareness
• Penetration
• Etc.
Initial agent learning
• (typically 6mo.)
Calibration
• (typically 24mo.)
Validation
• (typically
6mo.)
4wkly update process
Simulation/projection
• (12 or 24mo.)
Validation is always the last 6 months. As opposed to statistical
modeling where the validation can be from any time period.
Because ABM has a history, it needs to be the last period.Today
3yrs
ago
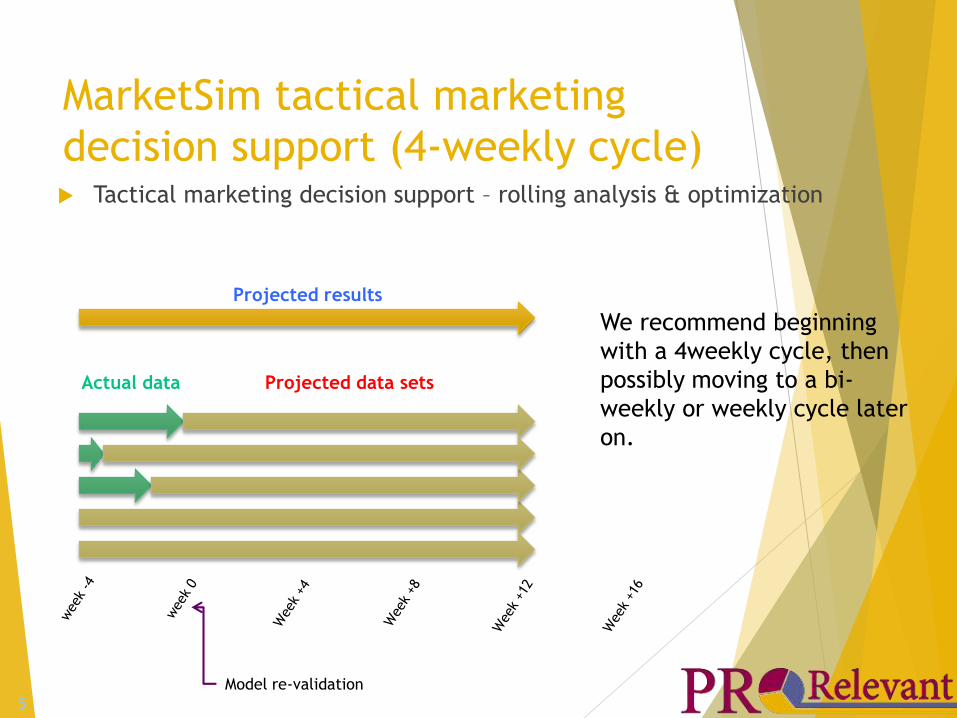
MarketSim tactical marketing
decision support (4-weekly cycle) Tactical marketing decision support – rolling analysis & optimization
5
Actual data Projected data sets
Model re-validation
Projected results
We recommend beginning
with a 4weekly cycle, then
possibly moving to a bi-
weekly or weekly cycle later
on.

6
Model & Simulation
Veracity
6
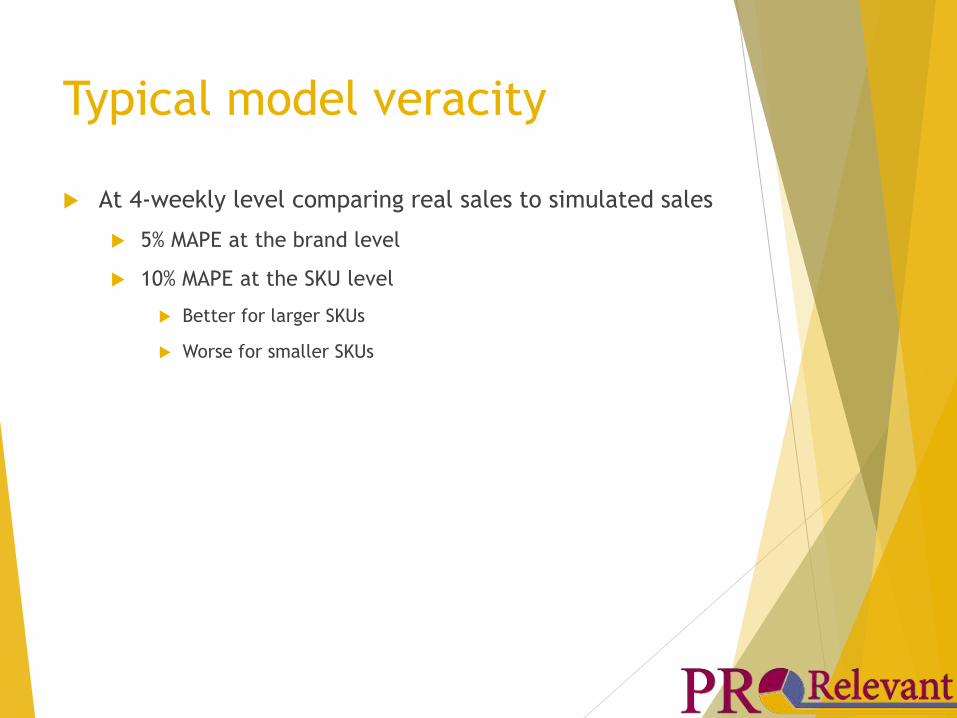
Typical model veracity
At 4-weekly level comparing real sales to simulated sales
5% MAPE at the brand level
10% MAPE at the SKU level
Better for larger SKUs
Worse for smaller SKUs

Agent population v MAPE Error
For a single brand (Unit sales), represents confidence
level of simulation agent population
0.0%
2.0%
4.0%
6.0%
8.0%
10.0%
25k 50k 100k 200k
% D
iffe
rence
Population Size
MAPE Error v. Population Size

9
Case Study
MarketSim™ Strategic InsightsFMCG Case Study: Food
9
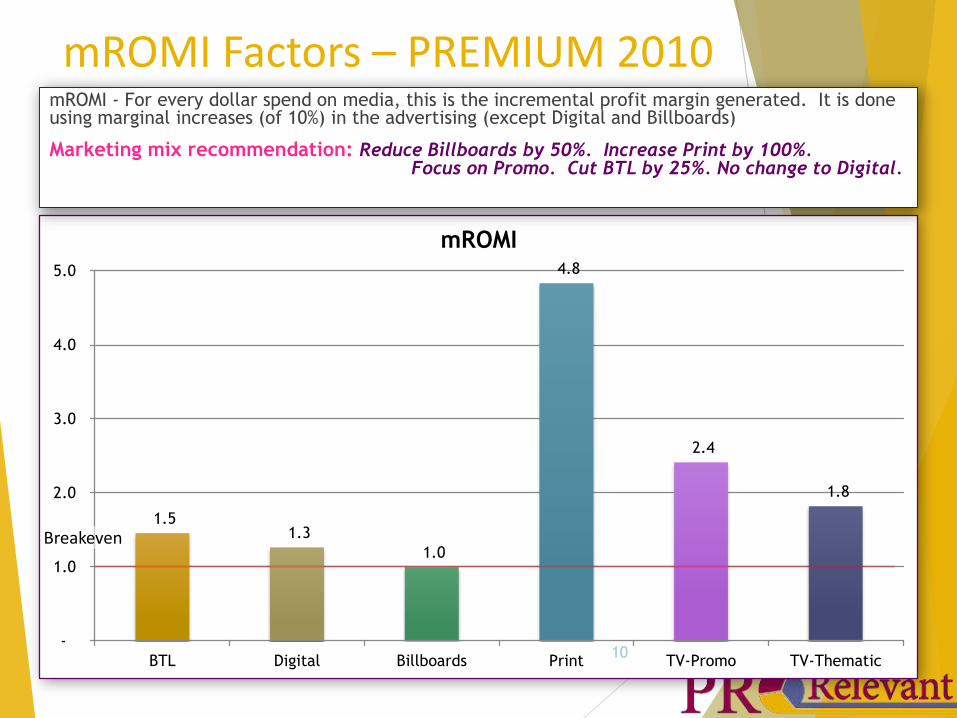
1.5 1.3
1.0
4.8
2.4
1.8
-
1.0
2.0
3.0
4.0
5.0
BTL Digital Billboards Print TV-Promo TV-Thematic
mROMI
mROMI Factors – PREMIUM 2010mROMI - For every dollar spend on media, this is the incremental profit margin generated. It is done using marginal increases (of 10%) in the advertising (except Digital and Billboards)
Marketing mix recommendation: Reduce Billboards by 50%. Increase Print by 100%.Focus on Promo. Cut BTL by 25%. No change to Digital.
10
Breakeven

0
0.5
1
1.5
2
2.5This brand is recommended by doctors
This brand has a taste that my childlikes
This brand gives the best affordablenutrition
This brand makes me proud to buy itfor my children
This brand helps me to be a goodmother
This brand helps my child progress inlife
This brand helps my child to becomemore intelligent
This brand helps my child to be bettereveryday
This brands knows all there is to knowabout nutrition
This brand brings my child excellentnutrition
This is a brand I can trust
This brand helps my child get the mostout of life
This brand offers me good value formy money
This brand helps my childs immunity
PREMIUM SEGMENT
Premium Segment: Consumer preferences top attributes‘Brand recommended by doctors’ is top attribute. Taste is second. 2 of 3 targeted attributes
are in top preferred attributes of top 14
Recommend messaging theme: ‘This brand helps me to be a good mother’ and ‘This brand helps my child progress in life’
attributes
11
• Product centric• Child centric• Mom centric
Bran
d D
This brand helps me to be a
good mother
This brand helps my child
progress in life

12
(60.0)
(30.0)
-
30.0
60.0
-30% -20% -10% 0% 10% 20% 30%
Price (rel.) elasticity -PREMIUM(M USD)
GUM
IF
(800,000)
(600,000)
(400,000)
(200,000)
-
200,000
400,000
600,000
800,000
-30% -20% -10% 0% 10% 20% 30%
Price (rel.) elasticity -PREMIUM
(vol – 1,000Kgs)
GUM
IF
Relative price elasticity - Mainstream
12
Decreasing price versus the category by 5% delivers 14.9M US. This price change is a relative price change to the rest of the category.
Price elasticity of all SKUs in Growing Up Milk (GUM) and Infant Formula (IF) in +/-10% range are linear. For both IF and GUM, lowering price leads to more profit. Especially strong for GUM. Care must be taken not to invoke a price war, if the overall price is changed in the category.
We recommend further simulations to optimize pricing between variants
-5%

13
3.4 4.0 1.0
17.8 13.6
4.6
-
5.0
10.0
15.0
20.0
25.0
Total contr margin 2009 Total contr margin 2010 Total contr margin 2011Q1
Incr. contribution margindue to 10% increase in wghtd distr perc. (M USD)
GUM Mainstream
IFT Mainstream
Scenario analysis: Wghtd distr %
13
In 2010 and 2011 the base wghtd distr percentage is less than 2009
21.2
17.6
5.6
Increasing distribution by 10% delivers 17.6M US. We recommend a distribution increase of at least 10% above existing values for all SKUs. (some with lower current distribution will be higher, others with current higher distribution won’t increase as much) The cost will be the investment in trade marketing plus internal sales costs. (10% of Trade 3.9M USD + 10% of BTL 6.2M USD + ??? Sales)
D/L distribution is declining. It has impact on advertising effectivenessTBD: What is the cost of 10% increased weighted distribution percentage? Is it more than the trade marketing expense in 2010 of 38.5M US? Increasing the wghtd distribution is a medium to long term effort
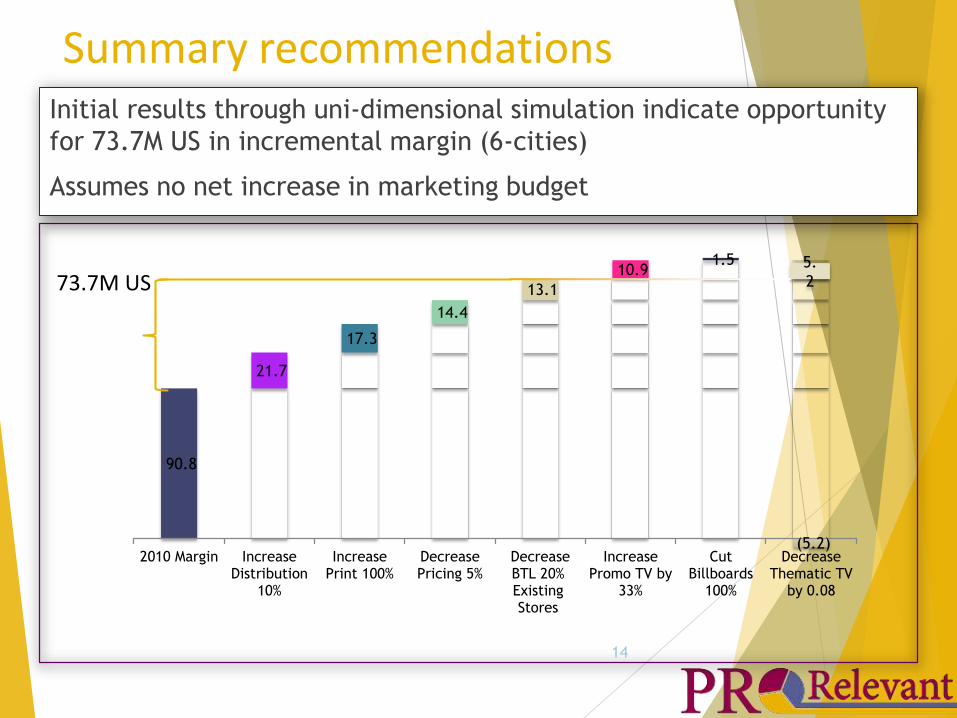
90.8
21.7
17.3
14.4
13.1
10.9 1.5
(5.2)2010 Margin Increase
Distribution10%
IncreasePrint 100%
DecreasePricing 5%
DecreaseBTL 20%ExistingStores
IncreasePromo TV by
33%
CutBillboards
100%
DecreaseThematic TV
by 0.08
73.7M US
Summary recommendations
14
Initial results through uni-dimensional simulation indicate opportunity
for 73.7M US in incremental margin (6-cities)
Assumes no net increase in marketing budget
5.
2

15
15
• Drive long term strategic
change in marketing decision-
making methods
• Provide training to over 2,000
senior marketers, globally
• Build consumer centric
software (MarketSim family of
products)
North America
Russia
Malaysia
Hong Kong
Vietnam
Kenya
Strategic decision-making support Global experience
Sri Lanka
Singapore
Japan
Morocco
Indonesia
Tanzania
+1 404-816-4344, Atlanta, USA
+65 9185-6443, Singapore
www.ProRelevant.com