Embed Size (px)
Citation preview
Private Label in Western EconomiesLosing share
Tim EalesDirector of Strategic Insight, IRI
June 2016
IRI Special Report

Copyright © 2016 Information Resources, Inc. (IRI Infoscan). Confidential and Proprietary. 2
• In 2015 private label value market share in Europe fell by 0.6 points to 38.3% compared to the previous year as a share of the total FMCG market. Private label unit market share also dropped – by 0.5 points – to 47.4%. These figures show that the downward trend from 2014 has continued and highlight the challenging conditions that private label retailers and manufacturers across Europe continue to face.
• France has the highest private label share decrease of the eight countries that were monitored in 2015 yet it has a high private label value share at 34.1%, compared to Italy’s 17.2% value share and Australia’s 13.9% value share. The United Kingdom (UK) has the best result with an increase of 0.4 points that brings its value share to an impressive 51.8% in 2015.
• It is interesting to see that volume sales on promotion (in % by country) for private label and national brands were closely competing in the United States (US) in 2015: private label’s promotion market share was 37.7% and national brands’ promotion market share was 43.4%. In the other seven countries the gap was far wider. The US also had the highest private label promotion market share in 2015 at 37.7%. The UK took second place at 30.6%.
• The food sector continues to be a key area for private label manufacturers across Europe. Frozen food (43%) and chilled & fresh (39%) were the category leaders in 2015 in terms of value market share. Household (31.2%) and then pet food (26.5%) were the best performing non-food categories whilst confectionery (12.1%) and personal care (13.9%) struggled to increase their value share.
Key Findings
Copyright © 2016 Information Resources, Inc. (IRI Infoscan). Confidential and Proprietary. 3
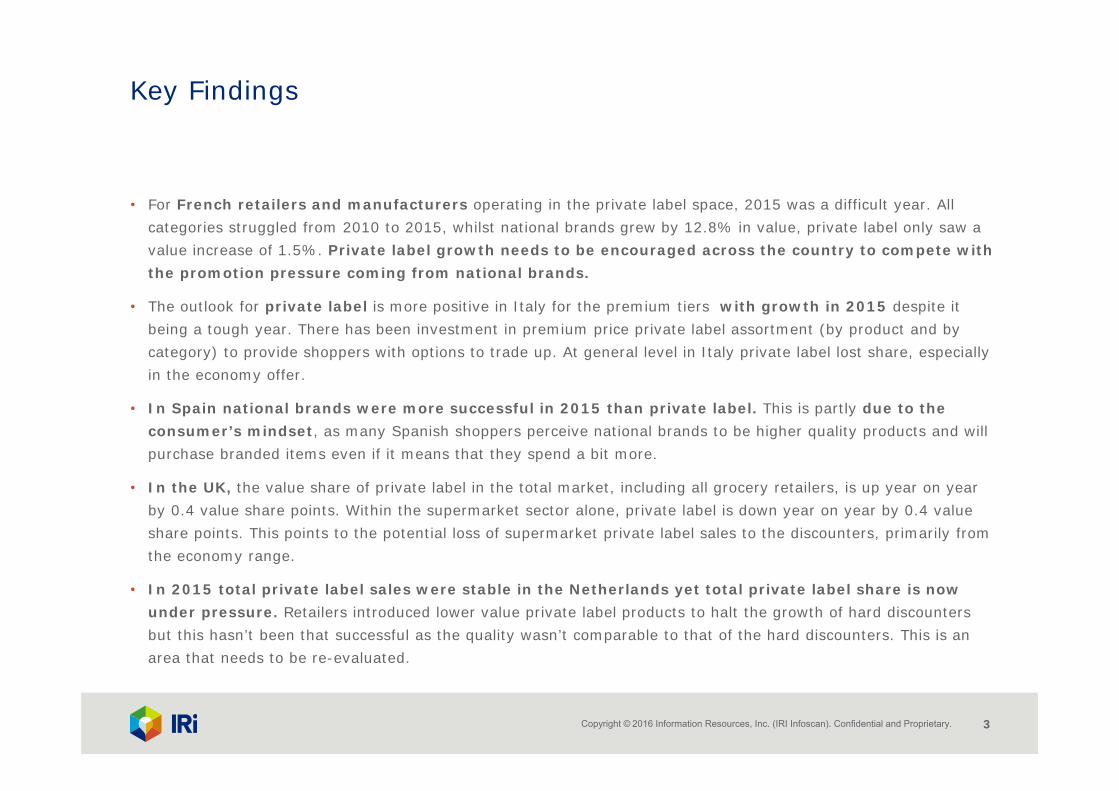
• For French retailers and manufacturers operating in the private label space, 2015 was a difficult year. All categories struggled from 2010 to 2015, whilst national brands grew by 12.8% in value, private label only saw a value increase of 1.5%. Private label growth needs to be encouraged across the country to compete with the promotion pressure coming from national brands.
• The outlook for private label is more positive in Italy for the premium tiers with growth in 2015 despite it being a tough year. There has been investment in premium price private label assortment (by product and by category) to provide shoppers with options to trade up. At general level in Italy private label lost share, especially in the economy offer.
• In Spain national brands were more successful in 2015 than private label. This is partly due to the consumer’s mindset, as many Spanish shoppers perceive national brands to be higher quality products and will purchase branded items even if it means that they spend a bit more.
• In the UK, the value share of private label in the total market, including all grocery retailers, is up year on year by 0.4 value share points. Within the supermarket sector alone, private label is down year on year by 0.4 value share points. This points to the potential loss of supermarket private label sales to the discounters, primarily from the economy range.
• In 2015 total private label sales were stable in the Netherlands yet total private label share is now under pressure. Retailers introduced lower value private label products to halt the growth of hard discounters but this hasn’t been that successful as the quality wasn’t comparable to that of the hard discounters. This is an area that needs to be re-evaluated.
Key Findings

Copyright © 2016 Information Resources, Inc. (IRI Infoscan). Confidential and Proprietary. 4
• In Germany private label is decreasing (-0.8 points in value share) although it remains high with a value market share and a unit market share at 38.4% and 50.9% respectively. Shoppers tend to accept higher prices for higher quality goods, from national brands and premium private label products, in an extremely price sensitive market where discount formats dominate. As a result there has been slightly more support for branded goods where assortment has grown by 5.0% compared to 3.2% growth for private label goods since 2013.
• In the US, private label is a $123 billion market which represents 16.4% of the value market share. Despite this low penetration compared to other western countries, and a potential growth opportunity, it has decreased in value (-0.2 points) and in unit (-0.1 points) during 2015; and this despite assortment and promotion increase.
• Private label share in Australia is lower than its share in many European countries and so retailers are keen to improve private label presence and share.
Key Findings

Western Economies Summary

Copyright © 2016 Information Resources, Inc. (IRI Infoscan). Confidential and Proprietary. 6
GDP 2015 % change versus 2014 in Europe
Euro area (18 countries) GDP +1.7% for 2015
Source : Eurostat
Growth rates of real GDP volume
1.7 1.2
1.9
0.7
3.1
2.2
-0.5
-3
-2
-1
0
1
2
3
4
5
Germany France Netherlands Italy Spain UK Greece
Average of first 3 quarters for Spain and the Netherlands. For Greece, estimate is based on the average for four quarters.

Copyright © 2016 Information Resources, Inc. (IRI Infoscan). Confidential and Proprietary. 7
4.5
10.5
6.4
11.4
20.3
4.9
24.3
Germany France Netherlands Italy Spain UK Greece
Unemployment levels in Europe
Euro area (18 countries) unemployment down from 11.3% in December 2014 to 10.5% in December 2015.
Source : Eurostat February 2016 : Table name - Harmonised unemployment rate monthly data
DEC2015
% unemployment rate in December 2015 compared to December 2014
4.5% 10.9% 7.0% 12.0% 23.5% 5.4% 27.1%
Nov2015
Nov2015

Copyright © 2016 Information Resources, Inc. (IRI Infoscan). Confidential and Proprietary. 8
FMCG in Europe full year 2015, % change versus previous year
1.6 1.2 0.5
3.0 1.8
-1.8 -1.8
Germany France Netherlands Italy Spain UK Greece
1.5 0.6
-0.5
2.2 0.9
-0.7
-4.4
VALUE TREND
VOLUME TREND
The year of 2015 was a better one for FMCG in most countries as national recessionary trends abated. Value sales were boosted by price increases in France, Italy, Netherlands and Spain. Italy recorded the fastest value growth whereas in 2014 it was Germany. Volume growth is still hard to achieve but only The Netherlands, UK and Greece reduced in volume, with the decline in UK being due to rapid growth of the discounter sector, not included in this measure.
Unit trend for Greece
2015Average 1.0%
2015 Average0.7%

Copyright © 2016 Information Resources, Inc. (IRI Infoscan). Confidential and Proprietary. 9
38.3%
47.4%
26.7%
18.6%13.4%
63.9 pt
PL ValueMarket Share
PL UnitMarket Share
PL AssortmentShare
PL Share of AllPromoted Volume
% of PL Volume onPromo
Unit Price Index PLvs National Brand
2015
Private label’s share for total FMCG and explanatory factors, promotion, assortment and price, in Europe (France, Germany, Italy, Netherlands, Spain, UK)Private label explanatory factors, shares of total FMCG market in % and price index with evolution versus a year ago, in share points, in Europe.
Sources: Value Share, Unit Share and Price Index
IRI Infoscan hypermarkets and supermarkets (Spain and Italy)
IRI Infoscan Total Market including hard discounters for Germany, the Netherlands and France (including Drive)
UK Kantar Worldpanel total market 52 w/e 3rd January 2016 for share, IRI Infoscan hypermarkets and supermarkets for price
- 0.6 pt -0.5 pt -2.0pt -1.7 pt 0.0 pt
Sources: Promotions
IRI Infoscan hypermarkets and supermarkets (UK, France, Italy, Spain, Netherlands)
IRI Infoscan grocery and drugstores excluding hard discounters in Germany
Sources: Assortment
IRI Infoscan hypermarkets and supermarkets (France, Italy, Spain, Netherlands, UK only)
-0.6 pt

Copyright © 2016 Information Resources, Inc. (IRI Infoscan). Confidential and Proprietary. 10
17.2%
41.5%
34.1%
51.8%
39.9% 38.4%
16.4%13.9%
Italy Spain France UK Netherlands Germany US Australia
PL Value Share 2015
Private label market share and value in euro, in European countries, the US and Australia, with evolution in share points versus a year ago.
Private label’s value share by country in Western economies
-0.2 pt - 0.4 pt - 1.0 pt +0.4 pt -0.3 pt -0.8 pt -0.2pt +0.2 pt
Sources: IRI Infoscan hypermarkets and supermarkets for Spain and Italy; Kantar Worldpanel total market 52 w/e 3rd January 2016 for the UK; IRI Infoscantotal market including hard discounters for Germany, the Netherlands and France (including Drive); IRI Infoscan total food for the US; IRI total food for Australia.
7.6 b 16.6 b 33.6b 53.7 b 7.3 b 92.2b45.7 b 6.4 b

Copyright © 2016 Information Resources, Inc. (IRI Infoscan). Confidential and Proprietary. 11
22.9%
12.5%9.5%
30.6%
11.5%
2.9%
37.7%
10.6%
36.1%
26.8%23.2%
64.5%
20.5%17.7%
43.4%46.0%
Italy Spain France UK Netherlands Germany US Australia
% PL Volume on Promotion 2015 % NB Volume on Promotion 2015
Private label and national brands in % volume on promotion in Europe, the US and Australia, with evolution in share points, versus a year ago.
Volume sales on promotion in % by country, private label versus national brands, in Western economies
Sources: IRI Infoscan hypermarkets and supermarkets (UK, France, Italy, Spain and Netherlands); IRI Infoscan grocery and drugstores excluding hard discount in Germany; IRI Infoscan total food in the US (% unit sales); IRI total food for Australia.
-2.9 pt -1.2 pt -0.5 pt -4.6 pt 0.0 pt 1.7pt-0.2 pt -1.1pt
-0.6pt -2.0pt -0.2pt -1.3pt -7.1pt -0.4pt+0.9pt 0.9pt
PL
NB

Copyright © 2016 Information Resources, Inc. (IRI Infoscan). Confidential and Proprietary. 12
81.9 pt73.4 pt
58.8 pt
70.4 pt 73.8 pt
60.2 pt
88.5 pt
55.4 pt
Italy Spain France UK Netherlands Germany US Australia
Private Label vs. National Brands Unit Price Index 2015
Private label price level in Europe, the US and Australia, index of private label unit price versus national brands unit price, with evolution, in index points, versus a year ago.
Private label’s price level by country in Western economies
+1.6 pt +1.0 pt +0.5 pt 0.0 pt -0.9 pt -0.3pt-0.7pt -1.0 pt
Sources: Price Index: IRI Infoscan hypermarkets and supermarkets for UK, Spain and Italy; IRI Infoscan total market including hard discounters for Germany, the Netherlands and France (including Drive); IRI Infoscan total food in the US; IRI total market in Australia

Copyright © 2016 Information Resources, Inc. (IRI Infoscan). Confidential and Proprietary. 13
14.1%
29.6%
39.0%
12.1%
43.0%
18.3%
31.2%
13.9%
26.5%
Alcoholic Drinks Ambient Food Chilled & FreshFood
Confectionery Frozen Food Non-AlcoholicDrinks
Household Personal Care Pet Food
Value Market Share 2015
Private label value share in Europe with evolution, in share points, versus a year ago.
Private label’s value share by category in Europe (France, Germany, Italy, Netherlands, Spain, UK)
-0.7 pt -0.4 pt -1.3 pt 0.0 pt -0.8 pt -1.0 pt -0.2 pt -0.2 pt -0.4 pt
Sources: IRI Infoscan hypermarkets and supermarkets (UK, France, Italy, Spain and Netherlands); IRI Infoscan grocery and drugstores excluding hard discounters in Germany

Copyright © 2016 Information Resources, Inc. (IRI Infoscan). Confidential and Proprietary. 14
14.3%13.6% 13.1%
12.1% 11.7%
18.4%
11.9%13.0%
5.5%
13.4%
AlcoholicDrinks
Ambient Food Chilled &Fresh Food
Confectionery Frozen Food Non-AlcoholicDrinks
Household Personal Care Pet Food Total
% PL Volume on Promotion 2015
% Private label volume on promotion in Europe with evolution, in share points, versus a year ago.
Private label’s % volume on promotion by category in Europe (France, Germany, Italy, Netherlands, Spain, UK)
-1.9 pt -2.0 pt -1.8 pt -1.1 pt -3.1 pt -0.4 pt -1.2 pt 0.0pt -1.7 pt-1.2pt
Sources: IRI Infoscan hypermarkets and supermarkets (UK, France, Italy, Spain and Netherlands); IRI Infoscan grocery and drugstores excluding hard discounters in Germany.

Copyright © 2016 Information Resources, Inc. (IRI Infoscan). Confidential and Proprietary. 15
• Encouraging economy signs in Europe with gross domestic product (GDP) at +1.7% for 2015. By the end of 2015, all countries were back to growth with positive GPD, except Greece which remains at -0.5% GDP rate and the highest unemployment rate (24.3%), although this has now started to reduce. Spain showed the highest GDP growth trend (+3.1%) but unemployment that remained high (20.3%). Next was the economic growth of the UK (+2.2%), where the unemployment rate has been lowered to 4.9% slightly above the best in class, Germany, which had an unemployment rate of only 4.5%. It is encouraging to see that unemployment levels have decreased in all countries, apart from in Germany, where it was stable.
• And the FMCG sector seems to be benefiting from this momentum. After several years of turmoil with big discrepancies between countries, most countries were back to growth; the UK and Greece being exceptions due to a price war between retailers and discounters and for Greece a weak economy. FMCG growth for 2015 was +0.7% in volume and +1.0% in value. Italy has the fastest rate of growth in both value (+3.0%) and volume (+2.2%),supported by a hot summer season that helped seasonal categories.
• In the western economies studied, private label’s share is declining apart from in the UK and Australia although the context for these two countries is different: UK remains the country with the highest private label market share (of 51.8%) while Australia as the lowest penetration of private label with 13.9% of market share. The total value share of private label in Europe is 38.3% but in decline of 0.6 point versus year ago.
General Insights

Copyright © 2016 Information Resources, Inc. (IRI Infoscan). Confidential and Proprietary. 16
• In Europe in 2015 private label value market share was 38.3% while private label unit market share was 47.4%. These figures are both down (-0.6% and -0.5%) compared to the previous year. It’s interesting to see that the private label share of all promoted volume has also fallen from a year ago. It’s down -2.0 points at 18.6% and the percentage of private label volume on promotion has dropped (by -1.7 points) to 13.4%. Nationalbrands remain highly promoted for the benefit of most shoppers who are searching for (and expecting) quality from national brands.
• The UK, Spain, the Netherlands and Germany have the highest rankings for private label value share in 2015, versus a year ago. The UK has a substantial lead over its European counterparts at 51.8%, followed by Spain at 41.5%. The value share figures are much lower for Italy, the US and Australia (below 20% for these three countries). Yet of the eight countries analysed only two – the UK and Australia - have seen a point increase on their private label value share results.
• The UK dominates again, when the percentage of volume sales on promotion for private labels versus national brands, is considered across countries. In 2015, in the UK, the national brand share of volume on promotion was 64.5% compared to 30.6% for private label. The closest to this leading position is Australia at 46.0% for national brands and 10.6% for private label. However despite a positive picture there was little growth for the eight countries in this area.
General Insights

Copyright © 2016 Information Resources, Inc. (IRI Infoscan). Confidential and Proprietary. 17
• Private label’s assortment is shrinking across Europe. This trend is impacting national brands as well. After years of assortment increase, this slow down is due to fast moving consumer goods (FMCG) retailers and manufacturers which are focusing on cutting their range and assortment for higher performance of categories, brands and point of sales.
• In Southern European countries, the price gap of private label with national brands is shrinking (-1.7 points in Italy in 2015) under the promotion pressure but also due to a strong interest for shoppers for premium ranges and products that private labels managed to develop at good price (organic, local specificities…). In France and in Italy premium ranges of private label are performing very well. Meanwhile, in the North of Europe, in Australia and the US, private labels’ price remains stable or is decreasing, trying to regain market shares and/or to compete with the high promotional activity of national brands. The fierce price war that is taking place in several European countries (mainly in the UK and France) contributes to a continued focus on price.
• In Europe, value share of all categories are in decline or stable with the biggest drops shown for chilled & fresh food (-1.3 points), non-alcoholic drinks (-1.0 points) and frozen food (-0.8 points). Non-alcoholic drinks and chilled & fresh are facing high promotional activity coming from national brands; frozen food saw the biggest reduction in promotional activity for private label across all categories.
• Frozen food, chilled & fresh food and household are the leading categories when private label’s value share by category in Europe is reviewed. Frozen food commanded a 43.0% value market share in 2015, with chilled & fresh food at 39.0% but both are decreasing.
General Insights

Copyright © 2016 Information Resources, Inc. (IRI Infoscan). Confidential and Proprietary. 18
• The categories of confectionery, personal care and alcoholic drinks struggle to compete in this sector with value market shares of less than 15% in 2015. Strong national brands affinity with shoppers who are more willing to buy their favorite brands. Despite some successful innovations in the past years (Mercadona face cream) it’s hard for the private label to grow in the these categories. Personal care is also facing the strong growth of specialist retail chain with their own brands as well but more appealing for shoppers.
• Across Europe the volume on promotion by category figures were quite similar in range in 2015 but all decreasing. With the exception of pet food (at only 5.5%) the findings for private label volume on promotion were fairly consistent, ranging from 18.4% (for non-alcoholic drinks) to 11.7% for frozen food.
General Insights

France Overview

Copyright © 2016 Information Resources, Inc. (IRI Infoscan). Confidential and Proprietary. 20
34.1%
46.8%
25.1%19.9%
9.5%
58.8 pt
PL ValueMarket Share
PL UnitMarket Share
PL AssortmentShare
PL Share of AllPromoted Volume
% of PL Volume onPromo
Unit Price Index PLvs National Brand
2015
Private label’s share for total FMCG and explanatory factors, promotion, assortment and price, in France.
Private label explanatory factors, shares of total FMCG market in % and price index with evolution versus a year ago, in share points, in France.
-1.0 pt -1.3 pt -0.4 pt -1.8 pt +0.5 pt
Source; IRI Infoscan total market including hard discounters for share and price; IRI Infoscan hypermarkets and supermarkets for assortment and promotions
-0.5 pt

Copyright © 2016 Information Resources, Inc. (IRI Infoscan). Confidential and Proprietary. 21
12.1%
28.0%
38.0%
10.2%
43.7%
20.4%
30.8%
13.7%
20.4%
27.7%
AlcoholicDrinks
Ambient Food Chilled &Fresh Food
Confectionery Frozen Food Non-alcoholicdrinks
Household Personal Care Pet Food Total
PL Value Share 2015
Private label value share in France with evolution, in share points, versus a year ago.
Private label’s value share by category in France
-1.1 pt -1.0 pt -1.4 pt -0.2 pt -1.6 pt -1.1 pt -0.8 pt -0.4 pt -0.6 pt
Source: IRI Infoscan hypermarkets and supermarkets
-1.1pt
For consistency, this category analysis and resulting ‘Total’ across categories EXCLUDES
Hard Discounters

Copyright © 2016 Information Resources, Inc. (IRI Infoscan). Confidential and Proprietary. 22
21.5%18.2%
33.9%37.8%
40.7%
PL ValueMarket Share
Increasing
PL UnitMarket Share
Increasing
PL AssortmentShare Increasing
PL Share of AllPromoted Volume
Increasing
Unit Price Index PL vsNational Brand
Decreasing
Proportion of categories where private label is improving its competitive position in France
Total FMCG, value and unit market share, promotion & assortment share and price competiveness, in France.
Source: IRI Infoscan hypermarkets and supermarkets
50%

Copyright © 2016 Information Resources, Inc. (IRI Infoscan). Confidential and Proprietary. 23
Private label tiers: market share and evolution in France
2015 with change vs. 2014 Value Market Share in %
Value point change
Market Share Units
Units point change
Value % change
Units % change
TOTAL PRIVATE LABEL 27.7 -1.1 37.8 -1.4 -3.1 % -3.7 %
Standard Private Label 22.6 -1.0 30.1 -1.2 -3.5 % -3.8 %
Economy Private Label 2.3 -0.2 4.7 -0.3 -5.6 % -6.8 %
Premium Private Label 2.8 0.1 2.9 0.1 2.8 % 3.0 %
Source: IRI Infoscan hypermarkets and supermarkets

Copyright © 2016 Information Resources, Inc. (IRI Infoscan). Confidential and Proprietary. 24
• Private label value market share was 34.1% in 2015 (as a share of the total FMCG market) while private label unit market share was 46.8% for the same period.
• The categories with the highest private label value share in 2015 were frozen food (43.7%), chilled & fresh food (38%) and household (30.8%). Alcoholic drinks and confectionery recorded the lowest private label value share figures.
• 2015 was a challenging year for private label in France. Its value market share was only 34.1%, with evidence of an accelerating downward trend. In 2009 FMCG experts in France predicted a high private label market share in the future, similar to that of the UK. However, several factors have influenced this state of play and this has led to a strengthening of national brands’ performance rather than private labels’.
• Major changes in the law have led to an aggressive price war between retailers. Deflation has become the norm for national brands and so private label have lost their price competitiveness which has impacted upon their share of assortment. In response retailers have used category management strategies to try to improve performance and yet this has led to a decrease in the share of assortment from 26.2% in 2012 to 25.2% in 2015.
• These figures highlight the challenging conditions for private label manufacturers: from 2010 to 2015 national brands grew 12.8% in value while private label only saw a value increase of 1.5% and there was a volume growth of 7.7% for national brands and a volume decline of 7.1% for private label.
Insights for France

Copyright © 2016 Information Resources, Inc. (IRI Infoscan). Confidential and Proprietary. 25
• It is a critical time for private label manufacturers in France. As retailers have focused on the price war among national brands, private label has been downgraded in terms of assortment, innovation, promotion and price competitiveness. In addition local brands are emerging and providing a point of differentiation for consumers and smart shoppers are also taking advantage of national brands’ price deflation to select higher value products.
• Steps need to be taken to improve private label growth. This will improve margins for retailers and also provide a defensive strategy against Lidl and its rising sales. Yet a significant investment will be required to improve promotions and boost performance in a tough FMCG environment that is shaped by price wars.
• On a positive note there are growth opportunities for private label. Long term consumption trends - such as regional products and organic - are natural territory for private label sales success.
Insights for France

Italy Overview

Copyright © 2016 Information Resources, Inc. (IRI Infoscan). Confidential and Proprietary. 27
17.2%20.2% 21.0%
13.8%
22.9%
81.9 pt
PL ValueMarket Share
PL UnitMarket Share
PL AssortmentShare
PL Share of AllPromoted Volume
% of PL Volume onPromo
Unit Price Index PLvs National Brand
2015
Private label’s share for total FMCG and explanatory factors, promotion, assortment and price, in Italy
Private label explanatory factors, shares of total FMCG market in % and price index with evolution versus a year ago, in share points, in Italy.
-0.2 pt -0.6 pt -0.4 pt -1.7 pt +1.6 pt-2.9 pt
Source; IRI Infoscan hypermarkets and supermarkets
Copyright © 2016 Information Resources, Inc. (IRI Infoscan). Confidential and Proprietary. 28
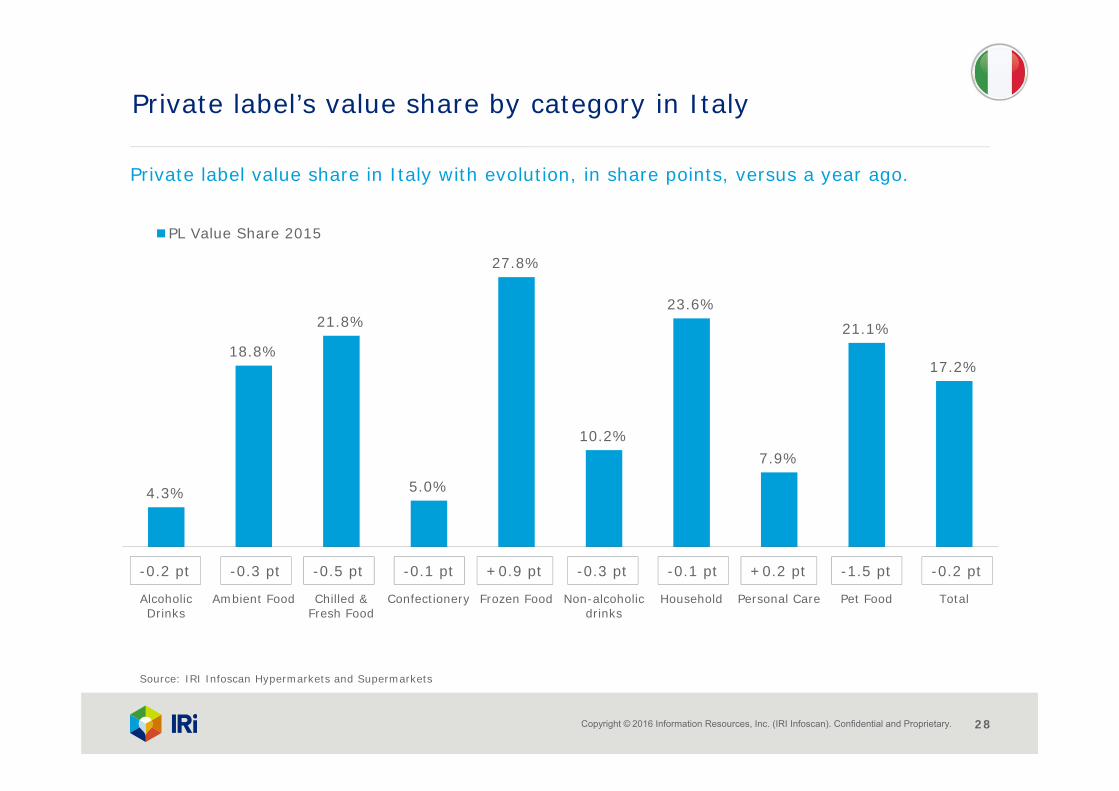
4.3%
18.8%
21.8%
5.0%
27.8%
10.2%
23.6%
7.9%
21.1%
17.2%
AlcoholicDrinks
Ambient Food Chilled &Fresh Food
Confectionery Frozen Food Non-alcoholicdrinks
Household Personal Care Pet Food Total
PL Value Share 2015
Private label’s value share by category in Italy
Private label value share in Italy with evolution, in share points, versus a year ago.
-0.2 pt -0.3 pt -0.5 pt -0.1 pt +0.9 pt -0.3 pt -0.1 pt +0.2 pt -1.5 pt
Source: IRI Infoscan Hypermarkets and Supermarkets
-0.2 pt

Copyright © 2016 Information Resources, Inc. (IRI Infoscan). Confidential and Proprietary. 29
51.8% 51.5%
39.8% 40.8%
54.1%
PL ValueMarket Share
Increasing
PL UnitMarket Share
Increasing
PL AssortmentShare Increasing
PL Share of AllPromoted Volume
Increasing
Unit Price Index PL vsNational Brand
Decreasing
Proportion of categories where private label is improving its competitive position in Italy
Total FMCG, value and unit market share, promotion and assortment share and price competiveness, in Italy.
50%
Source: IRI Infoscan hypermarkets and supermarkets
Copyright © 2016 Information Resources, Inc. (IRI Infoscan). Confidential and Proprietary. 30
• Since May 2015 private label value sales have been growing in Italy. This is positive news as private label sales declined throughout 2014 and 2015 was a tough year overall. Private label market share is decreasing in value but value sales were 9.6 million euros in 2015. These sales generated value in 300 different categories (with a value of 204 million euros).
• Private label’s value market share (of the total FMCG market) was 17.5% in 2015. This includes hypermarkets, supermarkets, small shops, discounters and drugstores. If hard discounters only are considered the market share is far greater at approximately 54%. Private label unit market share was 20.2% for the same period.
• The key private label players are the main Italian retailers: Coop Italia, Conad, Esselunga, Carrefour and Gruppo PAM. Retailers in Italy have analysed their private label economy tier assortment and made reductions by 30 to 40%. In contrast to this they have also increased their premium price private label assortment to offer shoppers a trade up on a particular product or in a particular category.
• National brands used promotional activities as a mechanic to compete against private label in 2015. Branded products under promotion were often a lower price than their private label counterparts. This led to national brands gaining market share in 2015, along with an effective assortment strategy that saw private label products lose space on the shelf. Private Label assortment did not increase until the end of 2015.
Insights for Italy

Copyright © 2016 Information Resources, Inc. (IRI Infoscan). Confidential and Proprietary. 31
• The frozen food category commanded the highest private label value share in 2015 at 27.8%. Household and chilled & fresh food ranked quite closely with 23.6% and 21.8% respectively. This is a growth of 0.9% for the frozen food category and a success story for manufacturers and retailers in the frozen food sector. It is likely that this rise is a result of investments by retailers during this time period.
• Private label quality is important. A Shopper Insights survey by IRI reveals that 68% of interviewees consider private label quality to be a key feature (The Shopper Insights survey, 2015).
• The standard tier is the most significant segment within the private label market in Italy. It registered a moderate growth of 2.5% in 2015. The premium price tier experienced good growth whilst the economy tier struggled. Retailers invested more in premium products to sustain their margins. Retailers’ assortment investments change in the premium tier increased by +5.4% compared to -27.6% for economy tier products.
• Shopper loyalty, assortment and pricing are key areas to focus on. There is a need to increase purchase frequency and also to improve the convenience perception of private label products. Improving out of stocks is a growth strategy for retailers. An IRI On Shelf Availability Barometer report (with ECR Italy) found that 4.7% of private label sales were lost due to poor management of the shelf.
Insights for Italy

Spain Overview

Copyright © 2016 Information Resources, Inc. (IRI Infoscan). Confidential and Proprietary. 33
41.5%
49.1%
37.9%
31.0%
12.5%
73.4 pt
PL ValueMarket Share
PL UnitMarket Share
PL AssortmentShare
PL Share of AllPromoted Volume
% of PL Volume onPromo
Unit Price Index PLvs National Brand
2015
Private label’s share for total FMCG and explanatory factors, promotion, assortment and price, in Spain
Private label explanatory factors, shares of total FMCG market in % and price index with evolution versus a year ago, in share points, in Spain.
-0.4 pt -0.7 pt -0.3 pt -1.1 pt +1.0 pt-1.2 pt
Source: IRI Infoscan hypermarkets and supermarkets

Copyright © 2016 Information Resources, Inc. (IRI Infoscan). Confidential and Proprietary. 34
20.8%
50.3%
42.1%
25.7%
56.4%
21.4%
53.6%
33.1%
45.9%41.5%
AlcoholicDrinks
Ambient Food Chilled &Fresh Food
Confectionery Frozen Food Non-alcoholicdrinks
Household Personal Care Pet Food Total
PL Value Share 2015
Private label’s value share by category in Spain
Private label value share in Spain with evolution, in share points, versus a year ago.
-0.5 pt +0.3 pt -1.0 pt 0.0pt -2.1pt 0.0 pt +0.4pt -0.8pt -1.9 pt -0.4pt
Source: IRI Infoscan hypermarkets and supermarkets

Copyright © 2016 Information Resources, Inc. (IRI Infoscan). Confidential and Proprietary. 35
36.1%41.4%
50.2% 50.2%
56.0%
PL ValueMarket Share
Increasing
PL UnitMarket Share
Increasing
PL AssortmentShare Increasing
PL Share of AllPromoted Volume
Increasing
Unit Price Index PL vsNational Brand
Decreasing
Proportion of categories where private label is improving its competitive position in Spain
Total FMCG, value and unit market share, promotion and assortment share and price competiveness, in Spain.
50%
Source: IRI Infoscan hypermarkets and supermarkets

Copyright © 2016 Information Resources, Inc. (IRI Infoscan). Confidential and Proprietary. 36
• In 2015 private label value market share was 41.5% and 84.0% of this share was held by the top ten retailers in the country. For the same period private label unit market share was 49.1%.
• The retailers to watch were Mercadona, Bon Preu, Lidl and Consum who all experienced increasing sales. In 2015 value sales evolution increased in Spain by 1.8%.
• At the end of 2014 two new retailers entered the Spanish market with different store types. Costco’s new low cost stores offer a shopping format that is a mix of cash and carry and hypermarket whereas Poundland’s Dealz stores are positioned between a convenience and small store, offering 60% of their assortment at a 1.50 euro price point.
• Carrefour, Covalco and Hermanos Martín have also leveraged the cash and carry and hypermarket store format and new types of convenience store are increasing in petrol stations.
• In 2015 national brands were more successful than private label. The former increased value sales by 2.5% compared to +0.9% for private label. In late 2015 private label prices were higher and this therefore affected consumption. At this time national brands’ consumption increased by 1.0%. The price gap between national brands and private label increased slightly but many shoppers will choose manufacturer brands over private label, even if it means spending a few more euros. 41.0% of shoppers will consider purchasing a branded product rather than another option.
Insights for Spain

Copyright © 2016 Information Resources, Inc. (IRI Infoscan). Confidential and Proprietary. 37
• This shopper response may be due to manufacturers investing in promotional activities. In 2014, 27.4% of promotions were implemented by national brand manufacturers. This figure was 25.9% in 2015. These manufacturers are seeing rising sales and market share.
• In comparison private label share was 10.9% in 2015 and 12.6% in 2014.
• In Spain the quality perception of private label is linked to the image of the channels that promote products. Despite private label’s lower ranking the Spanish shopper has a positive perception of the channels that are connected to private label. This includes TV advertisements, customer service, store proximity and in store private label products occupy a wider, more organised space and have a cared for image.
• At a regional level private label share is lower in the north. This is influenced by several factors including unemployment and GDP figures and regional channel’s brand strategies. Interestingly Mercadona has recently opened its first store in Vizcaya (Basque Country), an area with the lowest private label share in Spain at 26.1%. This lower ranking in the north of the country may change in the months ahead.
• Spanish shoppers value private label and national brands similarly, demanding the same level of satisfaction from both. Shopper loyalty to national brands is linked to social level, impulse purchases and emotional senses of security and proximity.
Insights for Spain

Copyright © 2016 Information Resources, Inc. (IRI Infoscan). Confidential and Proprietary. 38
• Categories such as cleaning products have a lower fidelity than those of perfume or alcohol. Shopper loyalty is more ambivalent for the food categories where there is a primary need for a product and a lower level of exhibition.
• In Spain 78% of green products’ sales are from national brands. Private label share for green products was 22% in 2015, +3 points more than in 2014. There is an increasing assortment of green private label and some retailers such as Aldi, Carrefour, Alcampo and El Corte Inglés have their own line of green products.
• The shopper wants a balance of quality and price. With private label they tend to have the price but want better quality and with national brands they get the quality they desire but the price can be higher. Shopper centric strategies are necessary to increase shopper loyalty.
• The convenience category has seen a big increase in private label sales with prepared meals and easy to eat solutions such as spreadable tomato or hummus. Baby milk powder has also experienced a major sales increase (+700% in value) and in the beauty sector make up has increased its value sales by 21%. This is due to several retailers who are investing in this category.
• Growth strategies for retailers include opening new stores, mergers, convenience and proximity formats and implementing price strategies.
Insights for Spain

The United Kingdom Overview

Copyright © 2016 Information Resources, Inc. (IRI Infoscan). Confidential and Proprietary. 40
51.8%57.2%
29.6%
21.0%
30.6Pt
70.4 pt
PL ValueMarket Share
PL UnitMarket Share
PL AssortmentShare
PL Share of AllPromoted Volume
% of PL Volume onPromo
Unit Price Index PLvs National Brand
2015
Private label’s share for total FMCG and explanatory factors, promotion, assortment and price, in the United Kingdom
Private label explanatory factors, shares of total FMCG market in % and price index with evolution versus a year ago, in share points, in the United Kingdom.
+0.4 pt +0.9 pt -2.4 pt 0.0 pt-4.6 pt
Source: Kantar Worldpanel total market UK 52 w/e 3rd January 2016 for value and unit shares. IRI Infoscan hypermarkets and supermarkets for price and promotion
-0.6pt

Copyright © 2016 Information Resources, Inc. (IRI Infoscan). Confidential and Proprietary. 41
16.6%
29.9%
55.4%
8.8%
47.0%
19.9%
26.8%
10.8%
19.7%
28.2%
AlcoholicDrinks
Ambient Food Chilled &Fresh Food
Confectionery Frozen Food Non-alcoholicdrinks
Household Personal Care Pet Food Total
PL Value Share 2015
Private label’s value share by category in the United Kingdom
Private label value share in the United Kingdom with evolution, in share points, versus a year ago.
-0.5 pt +0.3 pt -1.4 pt -0.4pt +0.6pt -0.9 pt +0.7pt -0.4pt -0.1pt
Source: IRI Infoscan hypermarkets and supermarkets
-0.4pt
For consistency, this category analysis and resulting ‘Total’ across categories EXCLUDES
M&S and Hard Discounters

Copyright © 2016 Information Resources, Inc. (IRI Infoscan). Confidential and Proprietary. 42
42.0%46.8%
33.2%
52.0%
PL Value Market ShareIncreasing
PL Unit Market ShareIncreasing
PL Share of All PromotedVolume Increasing
Unit Price Index PL vsNational Brand Decreasing
Proportion of categories where private label is improving its competitive position in the United Kingdom
Total FMCG, value and unit market share, promotion and assortment share and price competiveness, in the United Kingdom.
Source: IRI Infoscan hypermarkets and supermarkets
50%
Copyright © 2016 Information Resources, Inc. (IRI Infoscan). Confidential and Proprietary. 43
• The value share of private label in the total market is up year on year by 0.4 value share points. Within the supermarket sector, private label is down year on year by 0.4 value share points. This points to the potential loss of supermarket private label sales to the discounters, primarily from the economy range.
• On average, packs of private label products sell for a 30% lower price than national brands in supermarkets. This index has increased for food and reduced for non-food but overall has hardly changed in the latest year. UK shopping basket data shows that prices of private label items are slowly getting closer to national brands’ prices as trade promotion support is being reduced.
• The largest retailers are reducing their range of items stocked to simplify their offering to shoppers and to reduce costs. The overall average reduction across 2015 is 5% but in Tesco it is 10%. Private Label ranges have been reduced more quickly than national brands.
• Trade promotion support is reducing for private label and national brands. Trade promotions are less widespread and less generous for private label compared with national brands and are being withdrawn more quickly.
• Looking ahead, the discounters are set to increase their share of grocery spend which will inevitably continue to affect own label sales elsewhere.
• Tesco’s new ‘Farm’ rebranding of its own label value lines could, if successful, stimulate more branding in the produce and fresh categories where private label is dominant.
• If the economy continues to recover, this will very likely be to the detriment of private label – but uncertainty around the European referendum could make consumers want to save money again.
Insights for the United Kingdom
Copyright © 2016 Information Resources, Inc. (IRI Infoscan). Confidential and Proprietary. 44
• Private label sales are being hit by shoppers moving to the discounters: as they become more popular with shoppers and open more stores, Aldi and Lidl will continue to grow and compete directly and strongly with supermarkets’ private label offers.
• People feel they can afford brands again: shoppers have more money in their pockets, with wage inflation now higher than price inflation, combined with the impact of recent cheaper fuel prices.
• Private label ‘everyday prices’ are dropping faster than brands: retailers, most recently Co-operative Food, are cutting the everyday prices of their private label products more than brands; a trend that is set to continue.
• The promotional price gap is closing: IRI data in 2016 shows the highest ever levels of deal depth over eight weeks for branded products. This makes brands more price competitive and more attractive to consumers.
• Frozen foods private label share is rising: despite losing unit share, private label frozen foods are increasing in price as promotional support reduces. This is increasing the relative price of private label frozen food.
• Household private label share is rising: supermarkets have been hit by customers buying branded household products in bargain stores such as Poundland.
Insights for the United Kingdom

The Netherlands Overview

Copyright © 2016 Information Resources, Inc. (IRI Infoscan). Confidential and Proprietary. 46
39.9%
47.4%
28.1%
18.2%
11.5%
73.8 pt
PL ValueMarket Share
PL UnitMarket Share
PL AssortmentShare
PL Share of AllPromoted Volume
% of PL Volume onPromo
Unit Price Index PLvs National Brand
2015
Private label’s share for total FMCG and explanatory factors, promotion, assortment and price, in the Netherlands
Private label explanatory factors, shares of total FMCG market in % and price index with evolution versus a year ago, in share points, in the Netherlands.
-0.3 pt 0.0 pt -0.8 pt -0.4 pt -0.9 pt0.0 pt
Source; IRI Infoscan total market including hard discounters for share and price. IRI Infoscan hypermarkets and supermarkets for assortment and promotions
Copyright © 2016 Information Resources, Inc. (IRI Infoscan). Confidential and Proprietary. 47
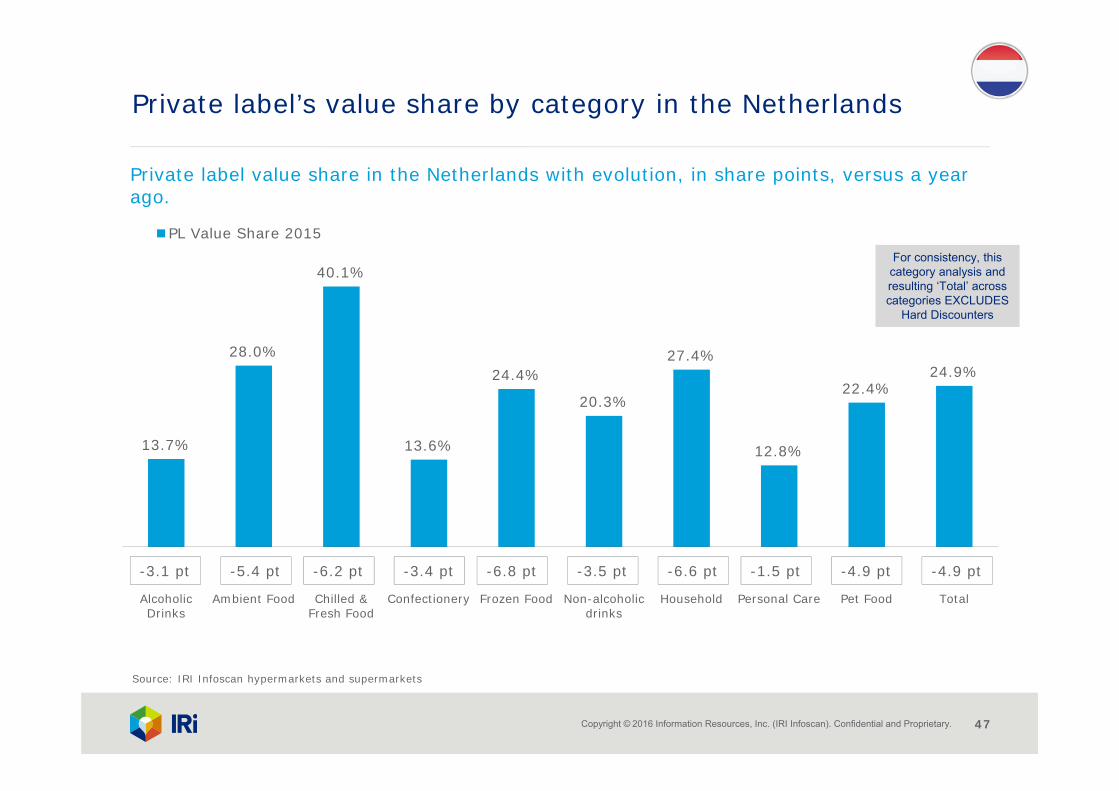
13.7%
28.0%
40.1%
13.6%
24.4%
20.3%
27.4%
12.8%
22.4%24.9%
AlcoholicDrinks
Ambient Food Chilled &Fresh Food
Confectionery Frozen Food Non-alcoholicdrinks
Household Personal Care Pet Food Total
PL Value Share 2015
Private label’s value share by category in the Netherlands
Private label value share in the Netherlands with evolution, in share points, versus a year ago.
-3.1 pt -5.4 pt -6.2 pt -3.4 pt -6.8 pt -3.5 pt -6.6 pt -1.5 pt -4.9 pt
Source: IRI Infoscan hypermarkets and supermarkets
-4.9 pt
For consistency, this category analysis and resulting ‘Total’ across categories EXCLUDES
Hard Discounters
Copyright © 2016 Information Resources, Inc. (IRI Infoscan). Confidential and Proprietary. 48
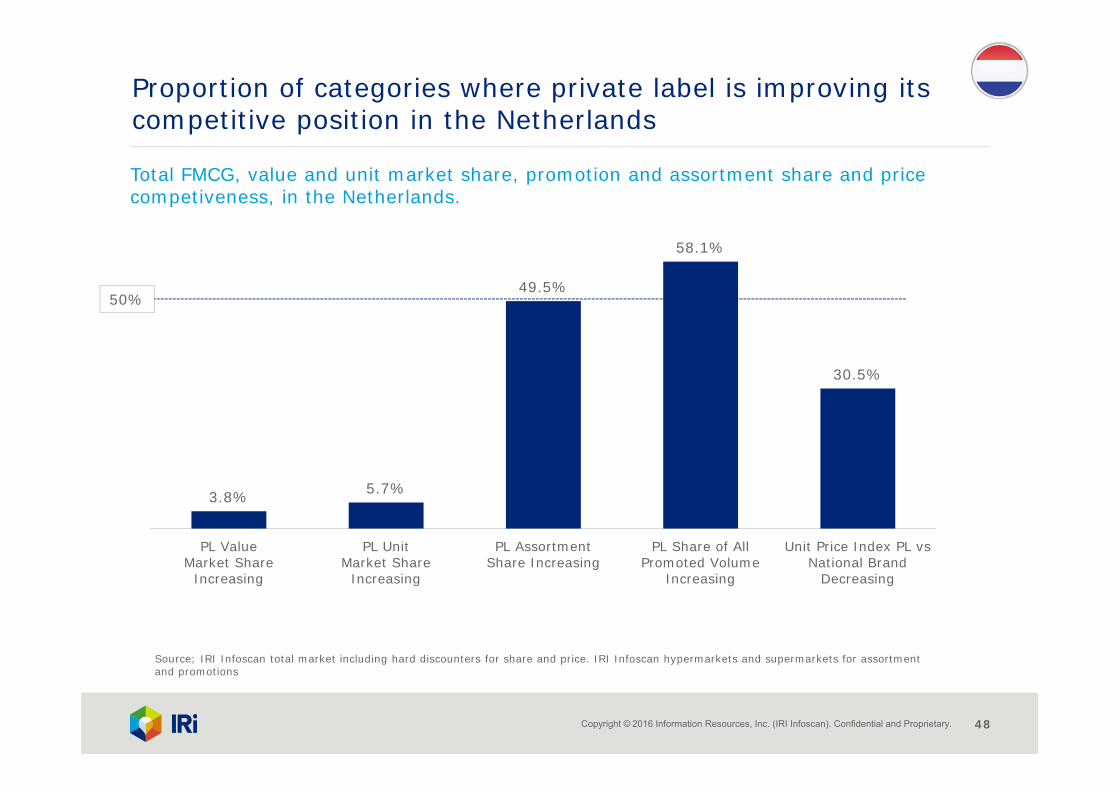
3.8% 5.7%
49.5%
58.1%
30.5%
PL ValueMarket Share
Increasing
PL UnitMarket Share
Increasing
PL AssortmentShare Increasing
PL Share of AllPromoted Volume
Increasing
Unit Price Index PL vsNational Brand
Decreasing
Proportion of categories where private label is improving its competitive position in the Netherlands
Total FMCG, value and unit market share, promotion and assortment share and price competiveness, in the Netherlands.
50%
Source; IRI Infoscan total market including hard discounters for share and price. IRI Infoscan hypermarkets and supermarkets for assortment and promotions

Copyright © 2016 Information Resources, Inc. (IRI Infoscan). Confidential and Proprietary. 49
• In 2015 total private label sales were stable. The economy tier was under pressure whilst the standard and premium tiers displayed growth. In 2015 private label unit market share was 47.4% (of the total FMCG market) and private label value market share was 39.9%.
• The retail landscape in the Netherlands has been shaped by a merger between Jumbo and the second most important retailer, C1000. Jumbo has expanded significantly in recent years and is now expected to focus upon optimisation in the years ahead.
• Total private label share is now under pressure. Retailers introduced lower value private label products to halt the growth of hard discounters but this hasn’t been particularly successful as the quality wasn’t comparable to that of the hard discounters. This is an area that needs to be re-positioned. Overall, regular private label products are perceived to be good quality.
• In the Netherlands high levels of promotion activities and innovation are viewed as the best tools to enable national brands to combat private label. National brands are beginning to regain market share through deep discounts and big multi-buys.
• Overall private label share is under pressure in all major categories but there are exceptions. For example, coffee, eggs, natural dairy and snack nuts are all categories that are growing well.
• A recommendation is to use private label to create differentiation and not use it as a defensive brand.
Insights for The Netherlands

Copyright © 2016 Information Resources, Inc. (IRI Infoscan). Confidential and Proprietary. 50
• After several years of strong assortment increases on private label there is now more stability. Overall national brands are gaining assortment share once again although there are some differences by category.
• Private label promotion activity is lower than that of leading national brands. The promotional share for private label is decreasing further in categories with strong national brands, as uplifts are generally higher for these brands than for private label. Private label manufacturers need to invest in proven promotional activities where they will see a good return of investment.
• The key growth strategies for private label are to: re-position the economy tier of private label, increase the quality of products and add value by harnessing consumer trends such as health and sustainability.
• While national brand manufacturers need to innovate, be distinctive and create shopper preference to achieve paths to growth.
Insights for The Netherlands

Germany Overview

Copyright © 2016 Information Resources, Inc. (IRI Infoscan). Confidential and Proprietary. 52
38.4%
50.9%
8.3%2.9%
60.2 pt
PL ValueMarket Share
PL UnitMarket Share
PL Share of All PromotedVolume
% of PL Volume onPromo
Unit Price Index PL vsNational Brand
2015
Private label’s share for total FMCG and explanatory factors, promotion and price, in Germany
Private label explanatory factors, shares of total FMCG market in % and price index with evolution versus a year ago, in share points, in Germany.
-0.8 pt -0.6 pt -0.8 pt -0.7 pt+2.9 pt
Source; IRI Infoscan total market including hard discounters for share and price. IRI Infoscan grocery and drugstores excluding hard discounters for promotions
Copyright © 2016 Information Resources, Inc. (IRI Infoscan). Confidential and Proprietary. 53
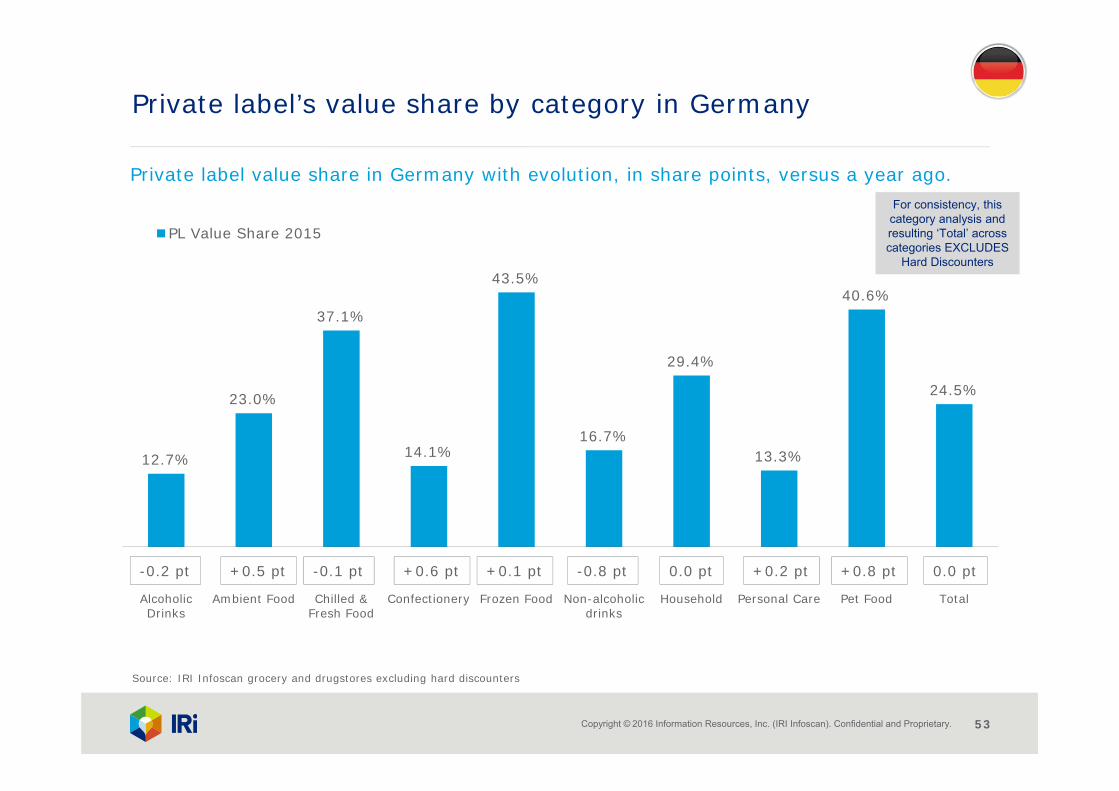
12.7%
23.0%
37.1%
14.1%
43.5%
16.7%
29.4%
13.3%
40.6%
24.5%
AlcoholicDrinks
Ambient Food Chilled &Fresh Food
Confectionery Frozen Food Non-alcoholicdrinks
Household Personal Care Pet Food Total
PL Value Share 2015
Private label’s value share by category in Germany
Private label value share in Germany with evolution, in share points, versus a year ago.
-0.2 pt +0.5 pt -0.1 pt +0.6 pt +0.1 pt -0.8 pt 0.0 pt +0.2 pt +0.8 pt
Source: IRI Infoscan grocery and drugstores excluding hard discounters
0.0 pt
For consistency, this category analysis and resulting ‘Total’ across categories EXCLUDES
Hard Discounters

Copyright © 2016 Information Resources, Inc. (IRI Infoscan). Confidential and Proprietary. 54
59.1% 57.0%
46.7%49.2%
PL Value Market ShareIncreasing
PL Unit Market ShareIncreasing
PL Share of All PromotedVolume Increasing
Unit Price Index PL vsNational Brand Decreasing
Proportion of categories where private label is improving its competitive position in Germany
Total FMCG, value and unit market share, promotion and assortment share and price competiveness, in Germany.
50%
Source: IRI Infoscan grocery and drugstores excluding hard discounters

Copyright © 2016 Information Resources, Inc. (IRI Infoscan). Confidential and Proprietary. 55
• In 2015 private label value market share and private label unit market share were high at 38.4% and 50.9% respectively (as a share of the total FMCG market). However, private label is losing versus branded goods with value and unit market share slightly decreasing, even though private label share of all promoted volume has risen but on very low base.
• Shoppers tend to accept higher prices for higher quality goods in an extremely price sensitive market where discount formats dominate and private label has a significant volume sales share.
• Consumer trends highlight a move towards premiumisation, support for natural, healthy, regional products and a desire for more assortment options. As a result there has been slightly more support for branded goods (excluding low profile categories such as bread and milk) and since 2013 branded goods have grown their assortments by 5.0% (the number of SKUs) compared to 3.2% growth for private label goods.
• In Germany the hard discounters, Lidl and Aldi, are losing value sales to the supermarkets – in contrast to the hard discounter success story in many other European countries. Lidl (-1.6%) and Aldi (-3.0%) are struggling against EDEKA (+4.0%), REWE (+5.6%) and Kaufland/Markant (+3.5%). The only retailer to be losing value sales is Metro at -3.3%.
Insights for Germany

Copyright © 2016 Information Resources, Inc. (IRI Infoscan). Confidential and Proprietary. 56
• Aldi has developed a new positioning to attract younger shoppers and to increase the frequency of purchase. The hard discounter is also offering more branded goods – and at a lower price. Both Aldi and Lidl are also improving their store appearances to project a higher quality image.
• In most categories there has been an increase in market share for branded goods and the price gap between branded and private label goods has reduced. As a result of up-trading, prices grew overall for FMCG even if it was only a slight rise by 0.6%.
• Successful categories – for private label value share - in Germany include frozen food, pet food, chilled and fresh food and household.
• In the chilled and fresh food category private labels have developed slightly below average value sales due to an average lower price level (compared to the previous year) while total volume sales have increased. When hard discounters are analysed the effect is even more pronounced. The fall in prices can be attributed to the end of the milk quota, the Russian embargo and a high quantity of milk globally in 2015.
• Looking ahead there will be opportunities for private label to innovate and follow consumer trends but overall private label will continue to struggle if the economic climate remains positive in Germany.
• There will be an increase in the differentiation and competition of retailer formats and accounts and there will either be an increase in innovation and assortment breadth and depth or a move towards simplification for retailers.
Insights for Germany

The United States Overview

Copyright © 2016 Information Resources, Inc. (IRI Infoscan). Confidential and Proprietary. 58
16.4% 18.1%11.8%
19.4%
37.7%
88.5 pt
PL ValueMarket Share
PL UnitMarket Share
PL AssortmentShare
PL Share of AllPromoted Volume
% of PL Units onPromo
Unit Price Index PLvs National Brand
2015
Private label’s share for total FMCG and explanatory factors, promotion, assortment and price, in the US
Private label explanatory factors, shares of total FMCG market in % and price index with evolution versus a year ago, in share points, in the US.
-0.2 pt -0.1 pt 0.2pt 0.7pt -0.3 pt1.7 pt
Source; IRI Infoscan total US multi-outlet w/ C-Store (supermarkets, drugstores, mass market retailers, gas/C-stores, military commissaries and select club & dollar retail chains), for share and price; IRI Infoscan total US : food, for assortment and promotions

Copyright © 2016 Information Resources, Inc. (IRI Infoscan). Confidential and Proprietary. 59
0.1%
17.2%
31.7%
3.3%
20.0%
11.0%
18.7%
12.5%10.1%
18.5%
AlcoholicDrinks
Ambient Food Chilled &Fresh Food
Confectionery Frozen Food Non-alcoholicdrinks
Household Personal Care Pet Food Total
PL Value Share 2015
Private label’s value share by category in the US
Private label value share in the US with evolution, in share points, versus a year ago.
0.0pt -0.2pt -0.6pt 0.0pt -0.1pt -0.1 pt 0.0pt -0.3pt -0.6 pt
Source: IRI Infoscan total US : food
-0.3pt
For consistency, this category analysis and resulting ‘Total’ across categories is from Total
US:Food retailers

Copyright © 2016 Information Resources, Inc. (IRI Infoscan). Confidential and Proprietary. 60
• Private label is a $123 billion market in the United States.
• Dollar sales grew 2.6 percent during 2015, driven by price increases and movement toward premium-tier private label solutions.
• Unit sales saw minimal growth for the year, at 0.3 percent, though pockets of much stronger growth exist across select aisles and categories.
• Private label momentum, dollars and units, is outpacing industry average, proof that private label solutions are viewed as a viable alternative to higher-priced national brand solutions.
• The grocery channel demonstrates the largest private label presence, with store brands accounting for more than 19 percent of dollar sales and 22 percent of unit sales. Grocery channel performance outpaced industry average across all departments, except home care.
• Within the channel share climbed for both of these measures.
• Performance at the department level is mixed, with private label unit share falling in frozen food and beauty and climbing in other departments.
Insights for the United States

Copyright © 2016 Information Resources, Inc. (IRI Infoscan). Confidential and Proprietary. 61
• Private label share of dollar channel dollar sales is slightly less than 14 percent.
• However, dollar channel private label performance is outpacing competing channels, as dollar retailers build their private label assortment and promotional strategies to underscore the channel’s strong value proposition.
• For the year, dollar channel private label dollar share climbed 0.4 points and unit share grew 0.6 points; meanwhile share trends in club, convenience and drug channels were flat or negative.
• Within dollar, private label share is much higher versus industry average in general merchandise and health care departments (24.5 percent and 23.8 percent, respectively); for the year, share grew in health care, but slid in home care
Insights for the United States

Australia Overview

Copyright © 2016 Information Resources, Inc. (IRI Infoscan). Confidential and Proprietary. 63
13.9%
22.5%
15.8%
6.3%10.6%
55.4 pt
PL ValueMarket Share
PL UnitMarket Share
PL AssortmentShare
PL Share of AllPromoted Volume
% of PL Units onPromo
Unit Price Index PLvs National Brand
2015
Private label’s share for total FMCG and explanatory factors, promotion, assortment and price, in Australia
Private label explanatory factors, shares of total FMCG market in % and price index with evolution versus a year ago, in share points, in Australia
0.2 pt 0.6 pt -0.3 pt -0.5 pt -1.0 pt-1.1 pt
Source: IRI MarketEdge Australia total market

Copyright © 2016 Information Resources, Inc. (IRI Infoscan). Confidential and Proprietary. 64
6.4%
22.0% 21.7%
4.7%
19.3%
8.2%
13.9%
8.7%
12.0%13.9%
AlcoholicDrinks
Ambient Food Chilled &Fresh Food
Confectionery Frozen Food Non-alcoholicdrinks
Household Personal Care Pet Food Total
PL Value Share 2015
Private label’s value share by category in Australia
Private label value share in Australia with evolution, in share points, versus a year ago.
0.0 pt -0.4 pt 1.1 pt 0.0 pt 2.4 pt 0.2 pt 0.4 pt 0.1 pt -1.0 pt
Source: IRI MarketEdge Australia total market, excludes some sensitive categories
0.2 pt

Copyright © 2016 Information Resources, Inc. (IRI Infoscan). Confidential and Proprietary. 65
• Private label share in Australia is lower than its share in many European countries and so retailers are keen to improve private label presence and share. In addition Aldi’s organic growth and current expansion in two states is leading other retailers to review and adapt their private label strategies. A further challenge may develop in time if Lidl does enter the Australian market.
• Woolworths and Coles – the two largest supermarkets – have recently announced that they are making changes to their private label offerings to combat the consumer perception that Aldi provides better quality products.
• In a retail environment that is experiencing a major expansion by hard discounters deep discount promotions have become increasingly popular to build sales. However the stronger promotional strategies from national brands have not strengthened their position versus private label.
• In conjunction with an increased private label drive by the major retailers, suppliers have launched these deep discount promotions as a strategic response to the private label pressure they’ve experienced and also as a result of falling consumer confidence and economic growth. Therefore the average unit price (paid in supermarkets) has not increased.
• Interestingly with high promotion activity it would be assumed that national brands would regain market share but private label growth is higher than national brand growth.
• In 2015 private label increased its share of supermarket sales, continuing its trend of share gains in recent years.
Insights for Australia

Copyright © 2016 Information Resources, Inc. (IRI Infoscan). Confidential and Proprietary. 66
• Retailers have reduced the price of some private label ranges – resulting in the average private label unit price decreasing – while also launching premium private label ranges. The categories of ice cream, confectionery and biscuits are good examples of this and some have won product awards.
• Private label has gained share in most departments. It has experienced particular success in frozen food with strong growth in frozen fruit, ice cream and frozen vegetables. Despite the increased private label pressure, share dropped in ambient food where private label had its highest presence. Reduced sales in canned fish and shelf stable spreads have contributed to this lost share.
• Ambient food and alcoholic drinks are the largest revenue opportunities for Australian retailers. This is based on the fact that private label in these categories is currently under trading in comparison to their European counterparts. In addition, improving the quality of the base level overall will enable retailers to close the price gap with branded products and thereby provide shoppers with a more attractive proposition.
Insights for Australia

Path to Growth
Copyright © 2016 Information Resources, Inc. (IRI Infoscan). Confidential and Proprietary. 68
Manufacturers and retailers are looking for new paths for growth in western markets. With long established expertise in FMCG and retail business, as well as unique analytics solutions sustained by the most advanced technology, IRI pinpoints what matters to deliver growth for retailers and manufacturers whilst improving the shopper’s satisfaction.
• Price and promotion can’t be the only levers. Private label needs to build on more than just price to differentiate their positioning against national brands; Fairtrade, free range, organic and local positioning have demonstrated that this can be successful.
• Systematic promotion analysis must become the norm. With set goals, appropriate analytics solutions will simulate price and promotion tactics to improve margins, revenue, brand and category performance as well as competitive advantage.
• KPIs that measure both price gaps and share trends are critical metrics necessary for managing brand and category positions effectively. These should relate to shopper behaviour for a full picture of what is driving change.
• Brands need a clear view of what impacts each trip mission for each shopper segment if they are to gain market share and/or develop margins.
• Enhanced in-store execution helps manufacturers and retailers manage the in-store availability of their brands, minimising out of stocks and waste as well as enabling growth to be generated despite the tough retail environment.
Path to Growth

Copyright © 2016 Information Resources, Inc. (IRI Infoscan). Confidential and Proprietary. 69
• Stock control can be maximized by forecasting anticipated sales using diverse inputs including sales data, promotions, weather trends, holiday dates and other historic data. Brands can also use daily and store-by-store data to pinpoint where more stock may be needed on the shelf, where oversupply is causing wastage, or whether availability is impacting the efficiency of promotions.
• Manufacturers must focus on joint business planning with their retailer partners, to enhance the shopper experience. Manufacturers and retailers can use the same assortment optimisation solution that assesses the true value of each item, based on its attributes (such as, pack size, format, function, price band, etc.), to identify and understand crucial elements that influence shopper decisions and the drivers of growth for individual brands and category as a whole.
Path to Growth

How to win
Copyright © 2016 Information Resources, Inc. (IRI Infoscan). Confidential and Proprietary. 71
If you have enjoyed this report, you may be interested in the following IRI products and services, which provide customisable insights:
• IRI InfoScan Census® is a syndicated retail tracking service that enables manufacturers and retailers to acquire industry insights used to make better business decisions. InfoScan Census utilises the data that IRI collects from grocery, drug and mass merchandise retailers to provide the most comprehensive and accurate syndicated data offering in the fast moving consumer goods (FMCG) sector. With access to accurate, granular detail by category, geography, measure and time period, clients have the tools needed to develop marketing and sales strategies based on product performance, distribution and promotion responsiveness.
• IRI Analytics Advantage™ Suite provides global solutions for all strategic marketing needs. It enables retailers and manufacturers to get fast and in-depth category insights and dynamic analysis for identifying growth opportunities and measure business impact in term of return on investment, sales and profit. The Analytics Advantage Suite goes from in-store interviews to advanced modelling solutions.
FOR MORE INFORMATION, please contact your IRI Consultant or send an email to [email protected]
How to win

Copyright © 2016 Information Resources, Inc. (IRI Infoscan). Confidential and Proprietary. 72
• This report contains data gathered from six countries in Europe: France, Italy, Spain, the UK, Germany and the Netherlands. The data has been sourced from IRI Infoscan® retail databases; 52 weeks ending December 2014 versus December 2015 for all countries.
• Macro-categories analysed: chilled & fresh food, ambient food, frozen food, non-alcoholic drinks (including tea and coffee), household, personal care, confectionery, pet food/pet care and alcoholic drinks
• The market channels used for each country in this report are as follows:
Resources
Country Channels used
UK UK Kantar Worldpanel total market for headline sales and share, IRI Infoscan hypermarkets and supermarkets for assortment, price and promotions.
Spain IRI Infoscan hypermarkets and supermarkets
Germany IRI Infoscan Total Market including hard discounters for sales , share and price. Excluding hard discounters for promotions.
Netherlands IRI Infoscan Total Market including hard discounters for sales, share and price. Excluding hard discounters for assortment and promotions
Italy IRI Infoscan hypermarkets and supermarkets
France IRI Infoscan Total Market including hard discounters (including Drive). Excluding hard discounters for assortment and promotions.
US IRI Infoscan total US multi-outlet w/ C-Store (supermarkets, drugstores, mass market retailers, gas/C-stores, military commissaries and select club & dollar retail chains), for sales, share and price; IRI Infoscan total US : food, for assortment and promotions
Australia IRI MarketEdge Australia total market
• The Private Label Price Index has been calculated on the basis of the average price per pack across all private labels relative to the average price per pack across all national brands.