Embed Size (px)
Citation preview

Presents
Dive Mobile

22
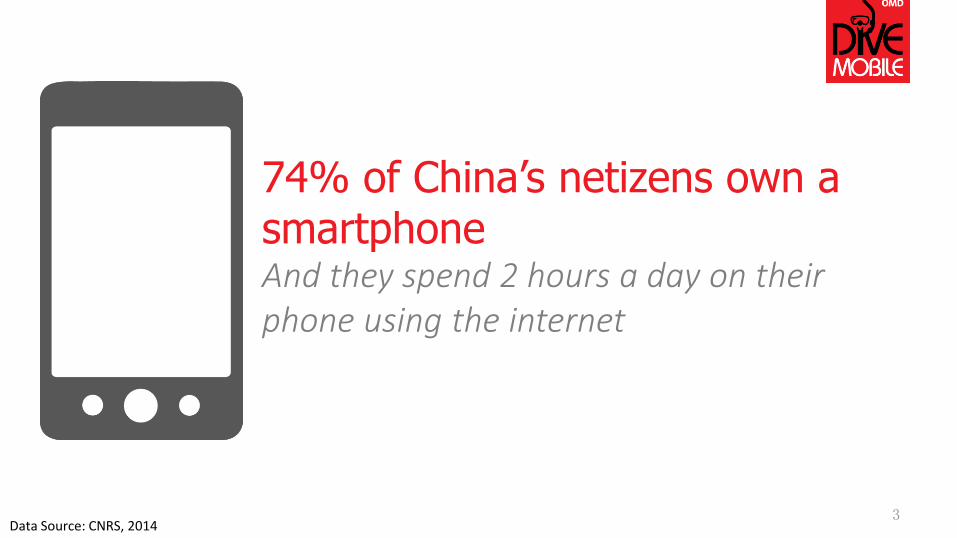
74% of China’s netizens own a smartphoneAnd they spend 2 hours a day on their phone using the internet
Data Source: CNRS, 20143

Radio, 17, 5%Print, 25, 7%
Tablet, 42, 12%
TV, 60, 17%
PC, 100, 29%
Mobile, 104, 30%
Radio Print Tablet TV PC Mobile
104 minMobile Daily Time Spent(without calling & SMS)
Source: Inmobi 2014.1
We spend more time on our
mobiles and tablets vs. any
other media 146 minutes are spent on mobile devices

Source: eMarketer5
Adspend has increased accordingly. Last year it grew by 600%.At the end of 2014, Chinese advertisers spent $6.4 billion on mobile internet ads, or 16% of all mobile ad spending globally.

But mobile ad spends still don’t match the growth in impressions
6
2013 2014
14% impressions of digital
0.5% of digital ad spend
17% impressions of digital
4.4% of digital ad spend
Source: iAdTracker, iMediaMatrix, mUserTracker

We know so little about what consumers think about mobile advertisingWe have some data on what people are doing on their mobiles but not what they think about brand communications on mobiles.
7

8
DOING THINKING
?

We wanted to knowWhat do people think about mobile ads?What kind of ads do they want to engage with?When are they most engaged? What happens when they accidentally click on ads?
9

So we askedQuantitative Research450 Respondents
One on one interviews in 7 marketsT1 - Shanghai, BeijingT2 - Xiamen, WuhanT3 - Hefei, Quanzhou, Shijiazhuang
10

89%Of people think mobile advertising is annoying or disruptive
11
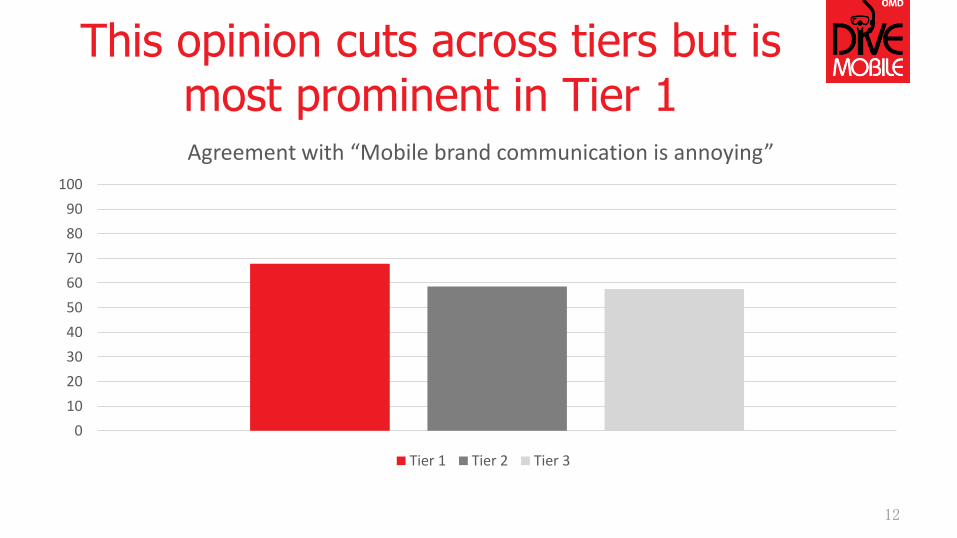
This opinion cuts across tiers but is most prominent in Tier 1
0
10
20
30
40
50
60
70
80
90
100
Agreement with “Mobile brand communication is annoying”
Tier 1 Tier 2 Tier 3
12

Most of their annoyance is due to misconceptions
0 10 20 30 40 50 60 70 80
Information is not reliable
Impacts my visual experience
Violates my personal data
Ads drain my battery
Leads to the wrong operation in the application
Ads waste my mobile data
Ads are not relevant to me
13

They aren’t necessarily wrong about junk advertising
14
8.5the number of ads an average person sees a day on their mobile

But, this is not the whole picture
15

75% Interesting
Our feelings toward mobile advertising is a bit more ambivalent
Necessary(2%)
94% Necessary
89% Annoying
16

This is consistent across tiers
0
10
20
30
40
50
60
70
80
90
100
Annoying Interesting Necessary
Tier 1 Tier 2 Tier 3
17

But how they react is different
4%
25%
28%
22%
Tier 1
18
4%
20%
28%
31%
Tier 2
1%
10%
30%
52%
Tier 3
Ignore
FeelInterested
Notice
Will Purchase
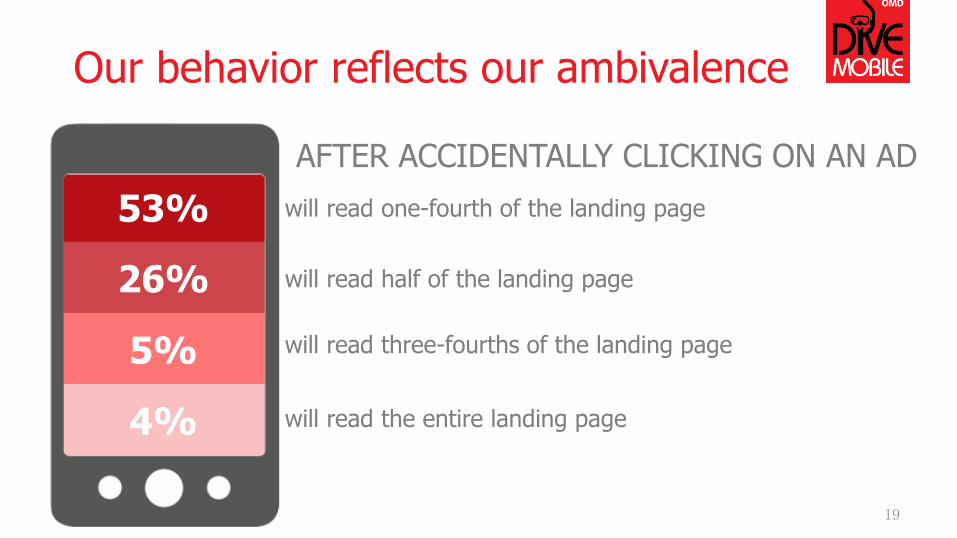
Our behavior reflects our ambivalence
19
will read one-fourth of the landing page53%
AFTER ACCIDENTALLY CLICKING ON AN AD
26% will read half of the landing page
5% will read three-fourths of the landing page
4% will read the entire landing page

Mobile ads have the biggest influence on purchase intent
20
ADVERTISEMENT PLACEMENT THAT WOULD INFLUENCE PURCHASE INTENTION MOST
38.7%Smartphone
30%PC
23%Tablet
8.3%Phablet

21
41%Smartphone
24%Tablet
18%PC
16%Phablet
49%Smartphone
26%Tablet
22%PC
3.3%Phablet
26%Smartphone
50%PC
19%Tablet
5%Phablet
Tier 1 Tier 2 Tier 3
Mobile is even more important in Tier 1 and 2

Those interested in your ads are 2.4 times more likely to purchase your product
22
Like
Annoyed
22.6%Notice
24.5%Notice
7.1%Will Purchase
2.9%Will Purchase

So, what do they want?
23

What we want from mobile ads is not so different from what we all look for in all advertising
24
Utility Amusement
Uniqueness Affirmation

But practicality reigns above all else
0% 5% 10% 15% 20% 25% 30% 35% 40% 45% 50%
Connects me with new people
Interesting experiences
Allows me to be an early adopter
Participation factor
Has talkability
Favourite celebrity involved
Well known brand
Provides company information
Interesting visuals
Relevant information
Practical rewards
Practical information
REASONS FOR ENGAGING WITH MOBILE ADS
25

Not all ad types are created equal
26
Picture Ad(48.6%)
Animation/Video Ad(36.1%)
PREFFERED AD FORMAT
Interstitial Ad(21.2%)

Not all ad spaces result in engagement
27
38.930.2
40.3 36.1
20.6
50.3 45.3
18.4
43.1
25.4
24.734.6
27.426.9
27.8
17.920.1
28.2
24.5
40.5
16.8 16.4 14.4 19
22.8
18.214.2
23.4
15.5 16
17.5 15.3 15.8 13.324.9
10.717.3
26.714 15.8
2 3.5 2.2 4.6 3.9 2.8 3.1 3.3 2.8 2.4
Auto Education Games Magazine Music Puzzle RealEstate
Social Tools Weather
Will purchase
Like it
Interesting
Take notice
Ignore

So, now what?
28

IMPLICATION
Invest where your audience is
Mobile adoption has increased many folds but ad spend has yet to grow accordingly. More ad budget should be allocated to mobile to keep up with the growth on eye balls on mobile devices.

IMPLICATION
Win hearts through better targeting
Mobile users while annoyed with mobile ads, they are still looking at the ads and will engage and interact with them if they are more targeted. Thus advertisers should invest in relevant mobile inventory to ensure on-target delivery.

IMPLICATION
Relevancy matters most
Focus on providing value and relevant information as this will increase ad engagement and interaction effectively driving up purchase intent. Then leverage interactive & rich media ad and video format to increase engagement.
IMPLICATION
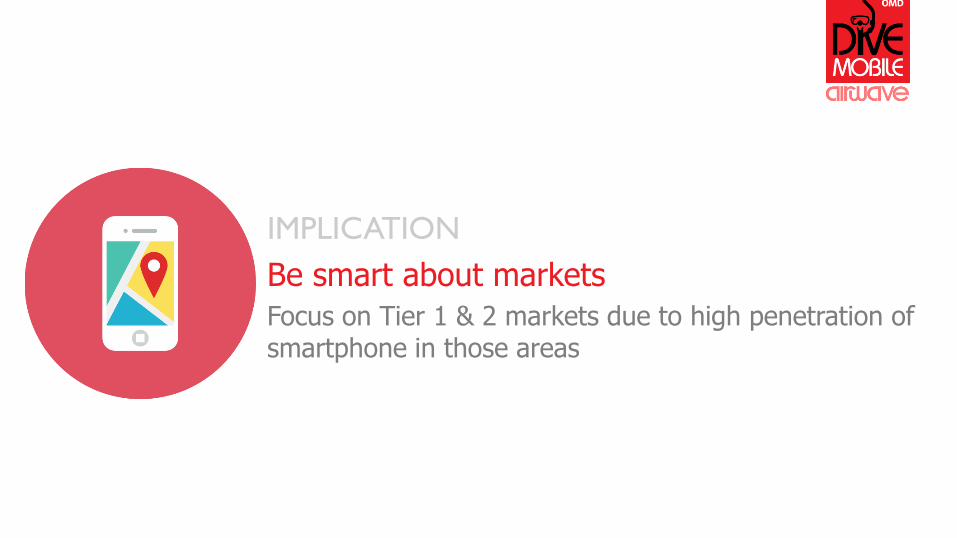
Be smart about markets
Focus on Tier 1 & 2 markets due to high penetration of smartphone in those areas

33
CONTACT US
Jeanette Phang
[email protected] BUSINESS INTELLIGENCE
Bhasker Jaiswal
[email protected] PARTNER - BUSINESS
INTELLIGENCE
Alvin Foo
[email protected] OF AIRWAVE