Embed Size (px)
Citation preview

&
2
7 Deadly Sins of A/B Testing
Director, Multichannel Marketing
Seth HutchingsData Analytics Consultant
Mackenzie Rae Knapp
8/5/163
Active Participants Reap Rewards
•Answer all poll questions
•Contribute a question or insightful comment during QA
•Supply mailing address
TESTING AND OPTIMIZATION
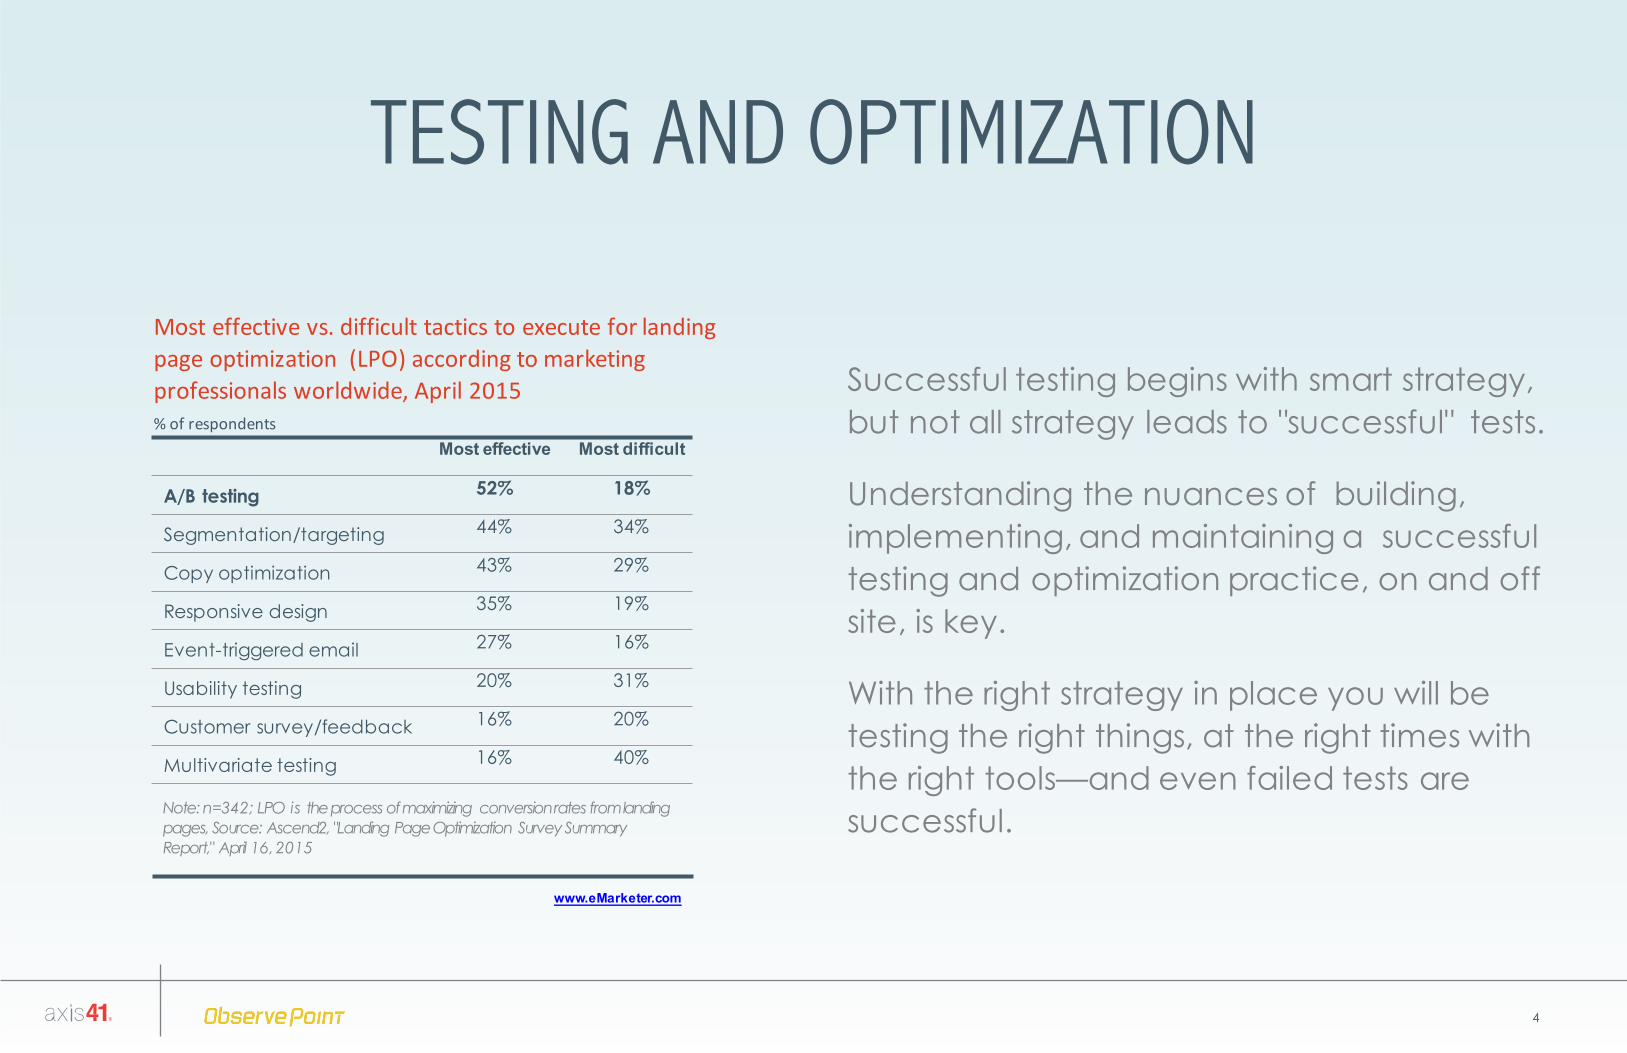
Successful testing begins with smart strategy, but not all strategy leads to "successful" tests.
Understanding the nuances of building, implementing, and maintaining a successful testing and optimization practice, on and off site, is key.
With the right strategy in place you will be testing the right things, at the right times with the right tools—and even failed tests are successful.
Most effective vs. difficult tactics to execute for landing page optimization (LPO) according to marketing professionals worldwide, April 2015% of respondents
Note: n=342; LPO is the process of maximizing conversion rates from landing pages, Source: Ascend2, "Landing Page Optimization Survey Summary Report," April 16, 2015
www.eMarketer.com
Most effective Most difficult
A/B testing 52% 18%
Segmentation/targeting 44% 34%
Copy optimization 43% 29%
Responsive design 35% 19%
Event-triggered email 27% 16%
Usability testing 20% 31%
Customer survey/feedback 16% 20%
Multivariate testing 16% 40%
4

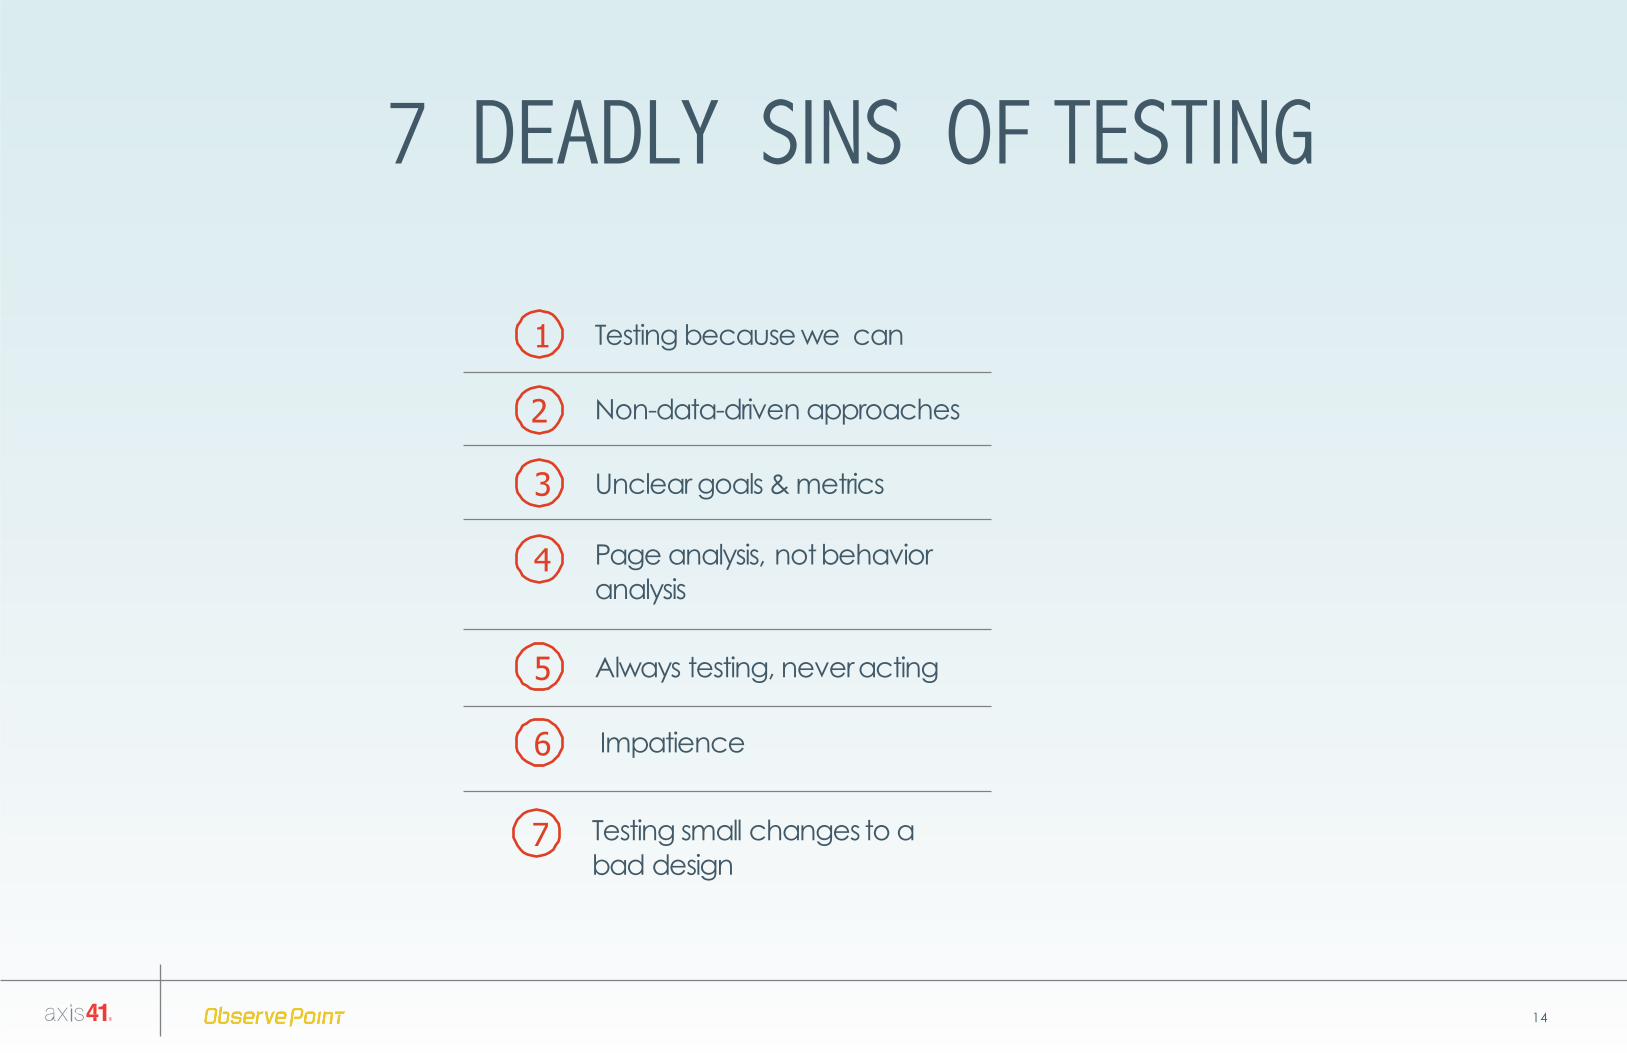
7 DEADLY SINS OF TESTING
It is often in the observation of our mistakes that the greatest insights and learnings are gained.
1
2
3
4
5
6
7
Testing because we can
Non-data-driven approaches
Unclear goals & metrics
Page analysis, not behavior analysis
Always testing, never acting
Impatience
Testing small changes to a bad design
5
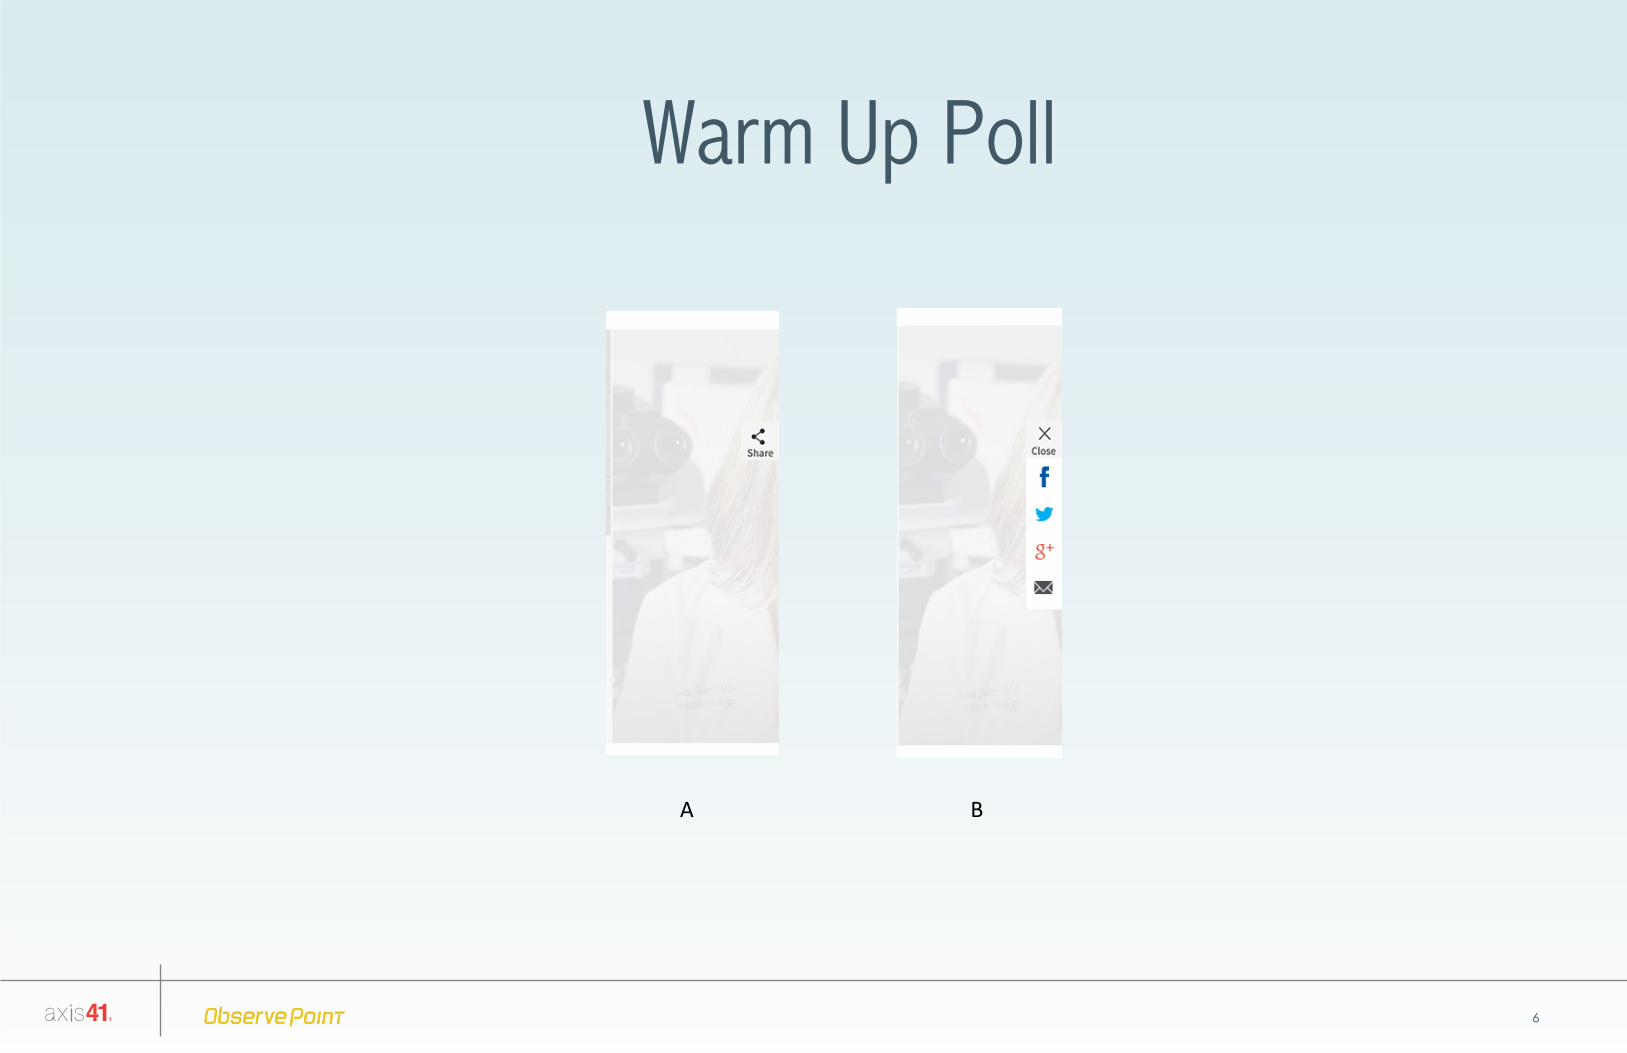
Warm Up Poll
6
A B

Deadly Sin No.1: Testing Because We Can
7
We have the tool now, I would like to get a test up and running asap, can we get one up in the next few hours?
• #1 deadly sin is launching a test without a strategic approach.
• What happens:• Obvious or non-directional tests.• UX best practices tested and proven.• Quick-win fails.
1 43 5
3
4
5
1
2
2 6

Deadly Sin No.2: Non-Data-Driven Approaches
8
• Often we see that tests are “gut” feeling tests or executive-defined tests.
• There are data collection issues that are not discovered until after the test.
• What happens:
• Distrust in the results and test moving forward.
• The real issues are not resolved or the potential success is not realized.
Change the Add to Cart button from:
ADD TO CART ADD TO CART
Downloads Checkout Rate Add to Cart Rate

Deadly Sin No.3: Unclear Goals & Metrics
9
• Misalignment between tests that are performed and tests that should be performed.
• Confusion on what the “winning” metric really should be, and which one can be.
• What happens:
• Tests are run, winners are selected but the overall goal of the site or campaign can be unaffected.
• Quick-win fails due to wrong winning metric.
Form Fill Conversion Downloads
Deadly Sin No.4: Page Analysis, Not Behavior Analysis
10
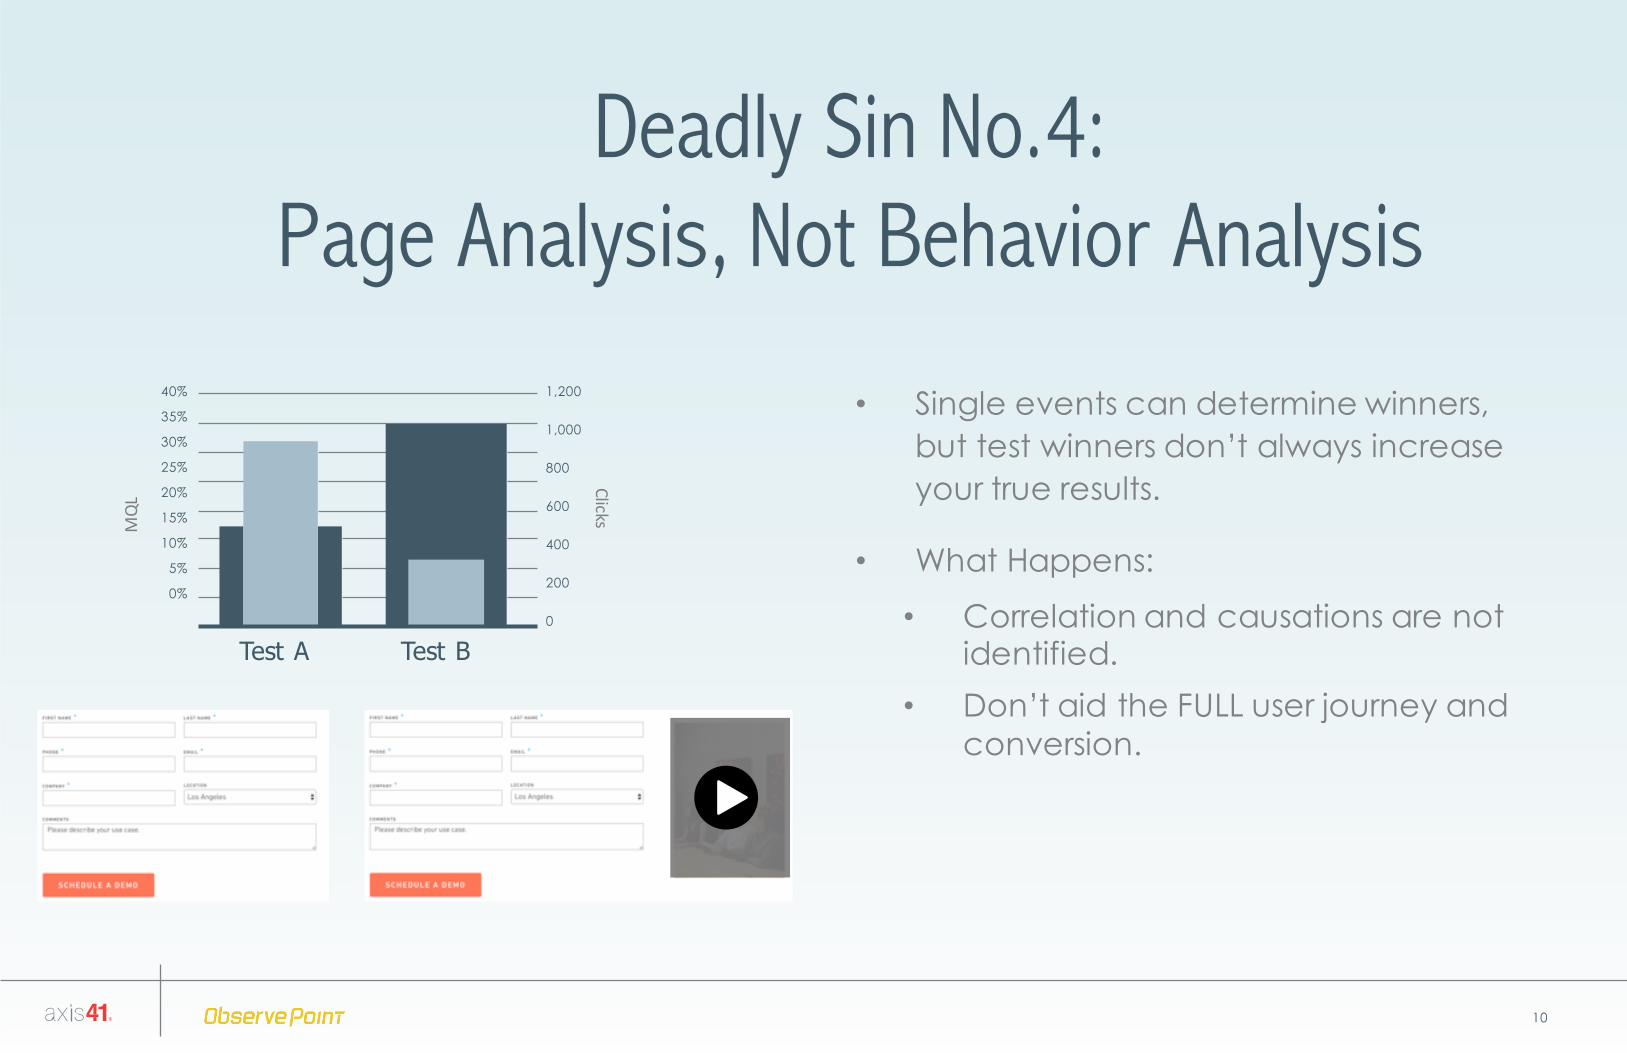
• Single events can determine winners, but test winners don’t always increase your true results.
• What Happens:
• Correlation and causations are not identified.
• Don’t aid the FULL user journey and conversion.
Test A Test B
40%
35%
30%
25%
20%
15%
10%
5%
0%
1,200
1,000
800
600
400
200
0
ClicksMQL
Deadly Sin No.5: Always Testing, Never Acting
11
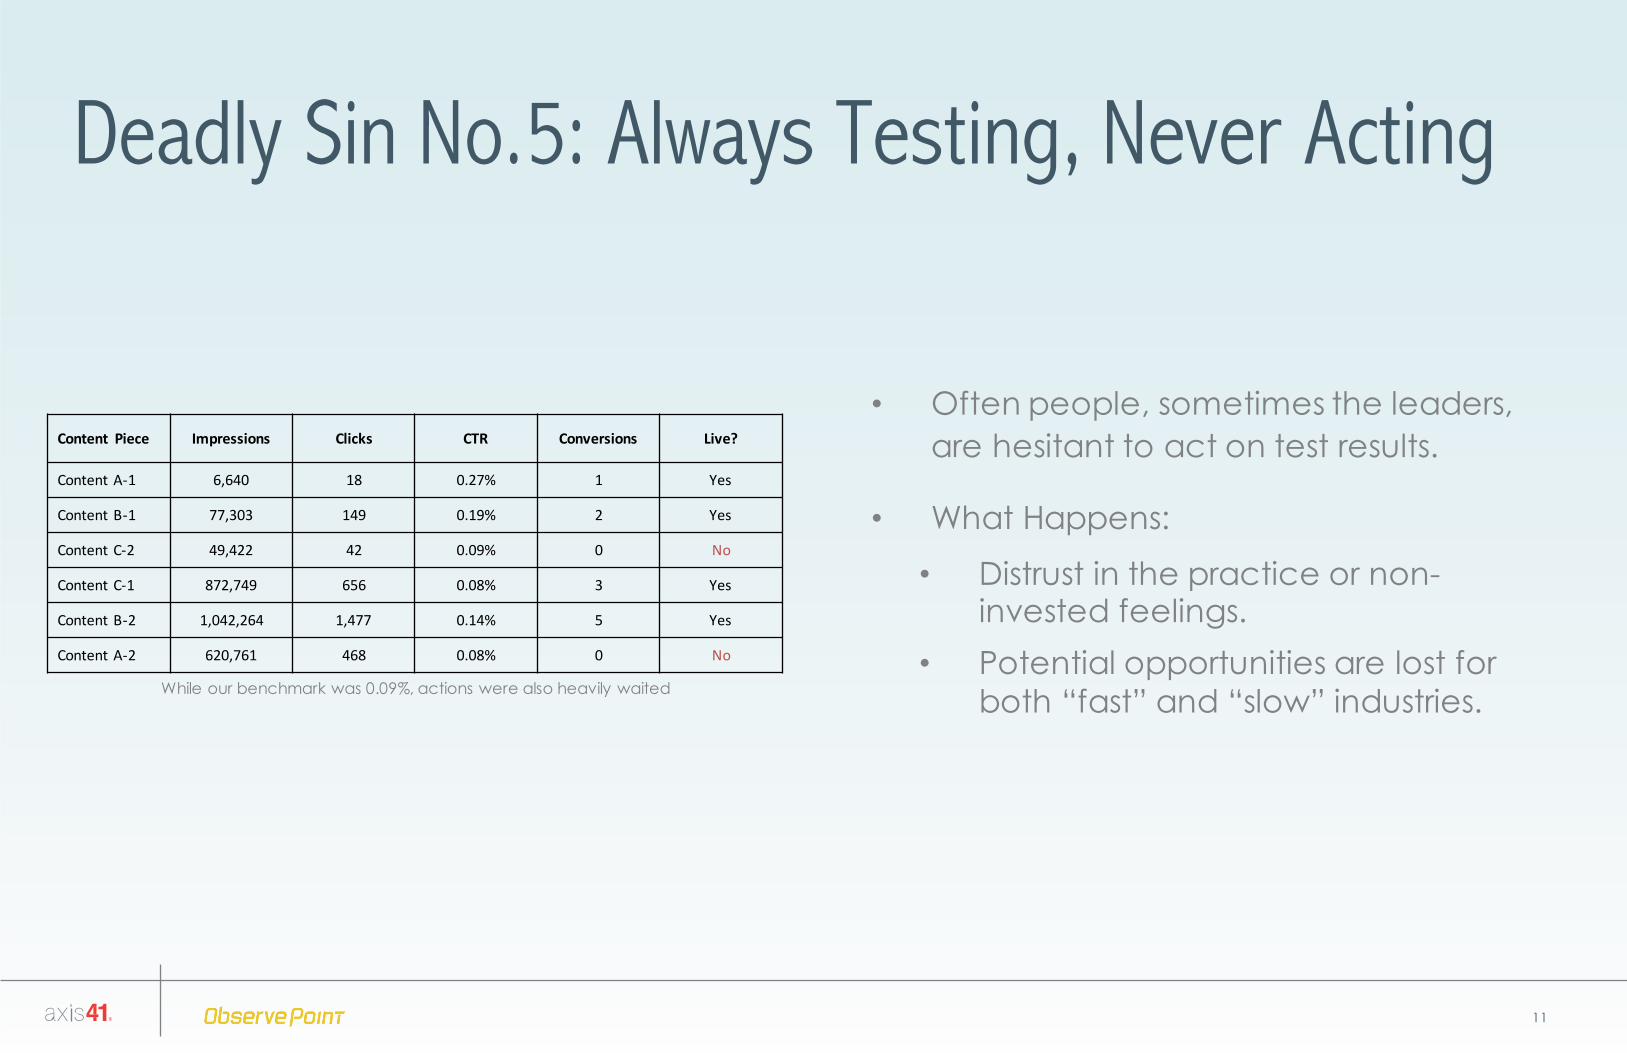
• Often people, sometimes the leaders, are hesitant to act on test results.
• What Happens:
• Distrust in the practice or non-invested feelings.
• Potential opportunities are lost for both “fast” and “slow” industries.
Content Piece Impressions Clicks CTR Conversions Live?
Content A-‐1 6,640 18 0.27% 1 Yes
Content B-‐1 77,303 149 0.19% 2 Yes
Content C-‐2 49,422 42 0.09% 0 No
Content C-‐1 872,749 656 0.08% 3 Yes
Content B-‐2 1,042,264 1,477 0.14% 5 Yes
Content A-‐2 620,761 468 0.08% 0 No
While our benchmark was 0.09%, actions were also heavily waited
Deadly Sin No.6: Impatience
12
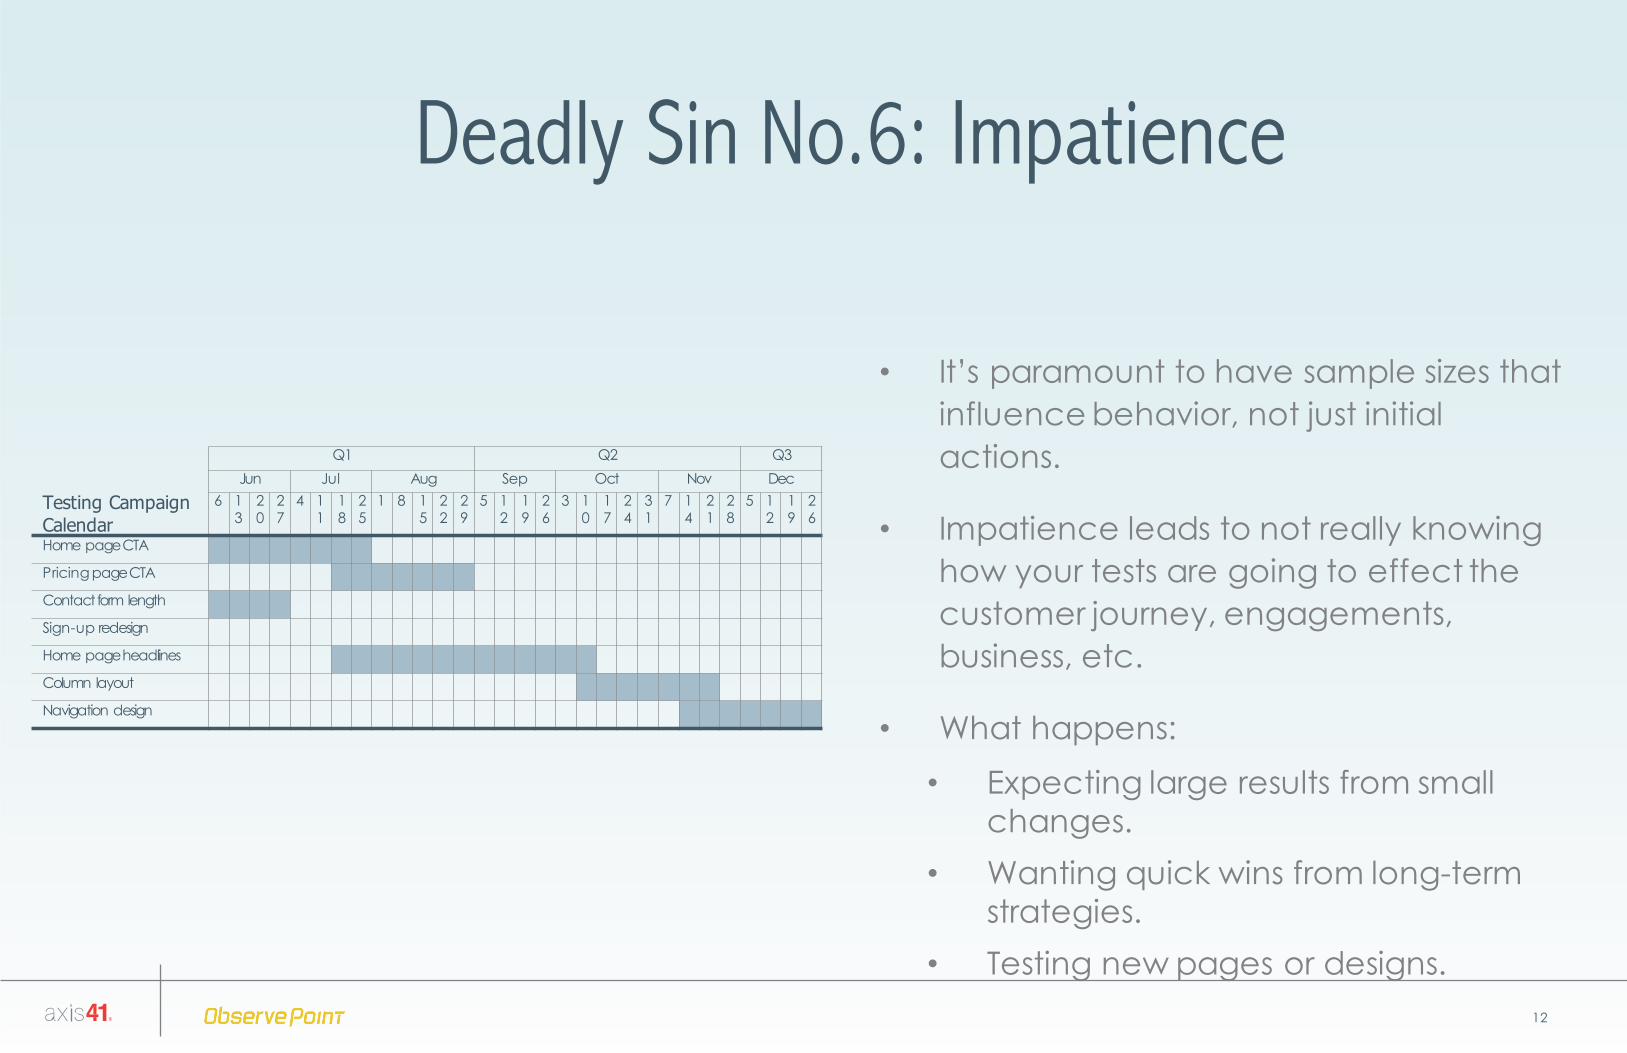
• It’s paramount to have sample sizes that influence behavior, not just initial actions.
• Impatience leads to not really knowing how your tests are going to effect the customer journey, engagements, business, etc.
• What happens:
• Expecting large results from small changes.
• Wanting quick wins from long-term strategies.
• Testing new pages or designs.
Testing Campaign Calendar
Q1 Q2 Q3Jun Jul Aug Sep Oct Nov Dec
6 13
20
27
4 11
18
25
1 8 15
22
29
5 12
19
26
3 10
17
24
31
7 14
21
28
5 12
19
26
Home pageCTA
Pricing pageCTA
Contact form length
Sign-up redesign
Home pageheadlines
Column layout
Navigation design
Deadly Sin No.7: Small Tests on Bad Designs
13
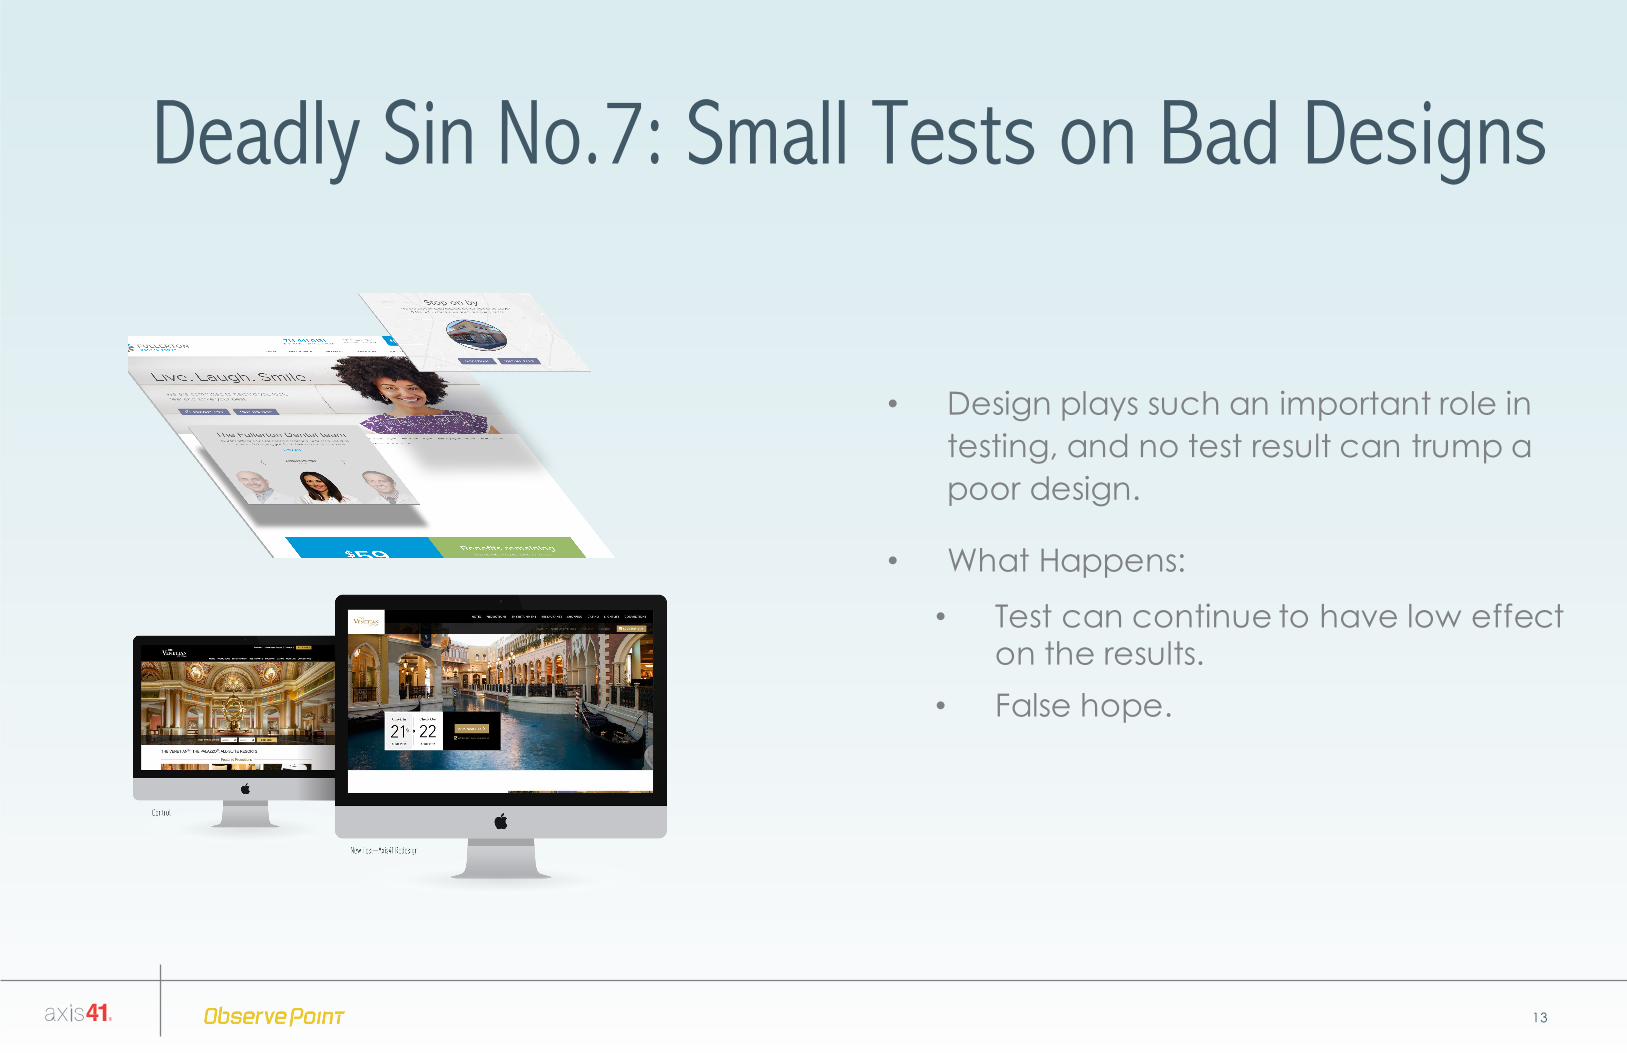
• Design plays such an important role in testing, and no test result can trump a poor design.
• What Happens:
• Test can continue to have low effect on the results.
• False hope.
7 DEADLY SINS OF TESTING
1
2
3
4
5
6
7
Testing because we can
Non-data-driven approaches
Unclear goals & metrics
Page analysis, not behavior analysis
Always testing, never acting
Impatience
Testing small changes to a bad design
14
15
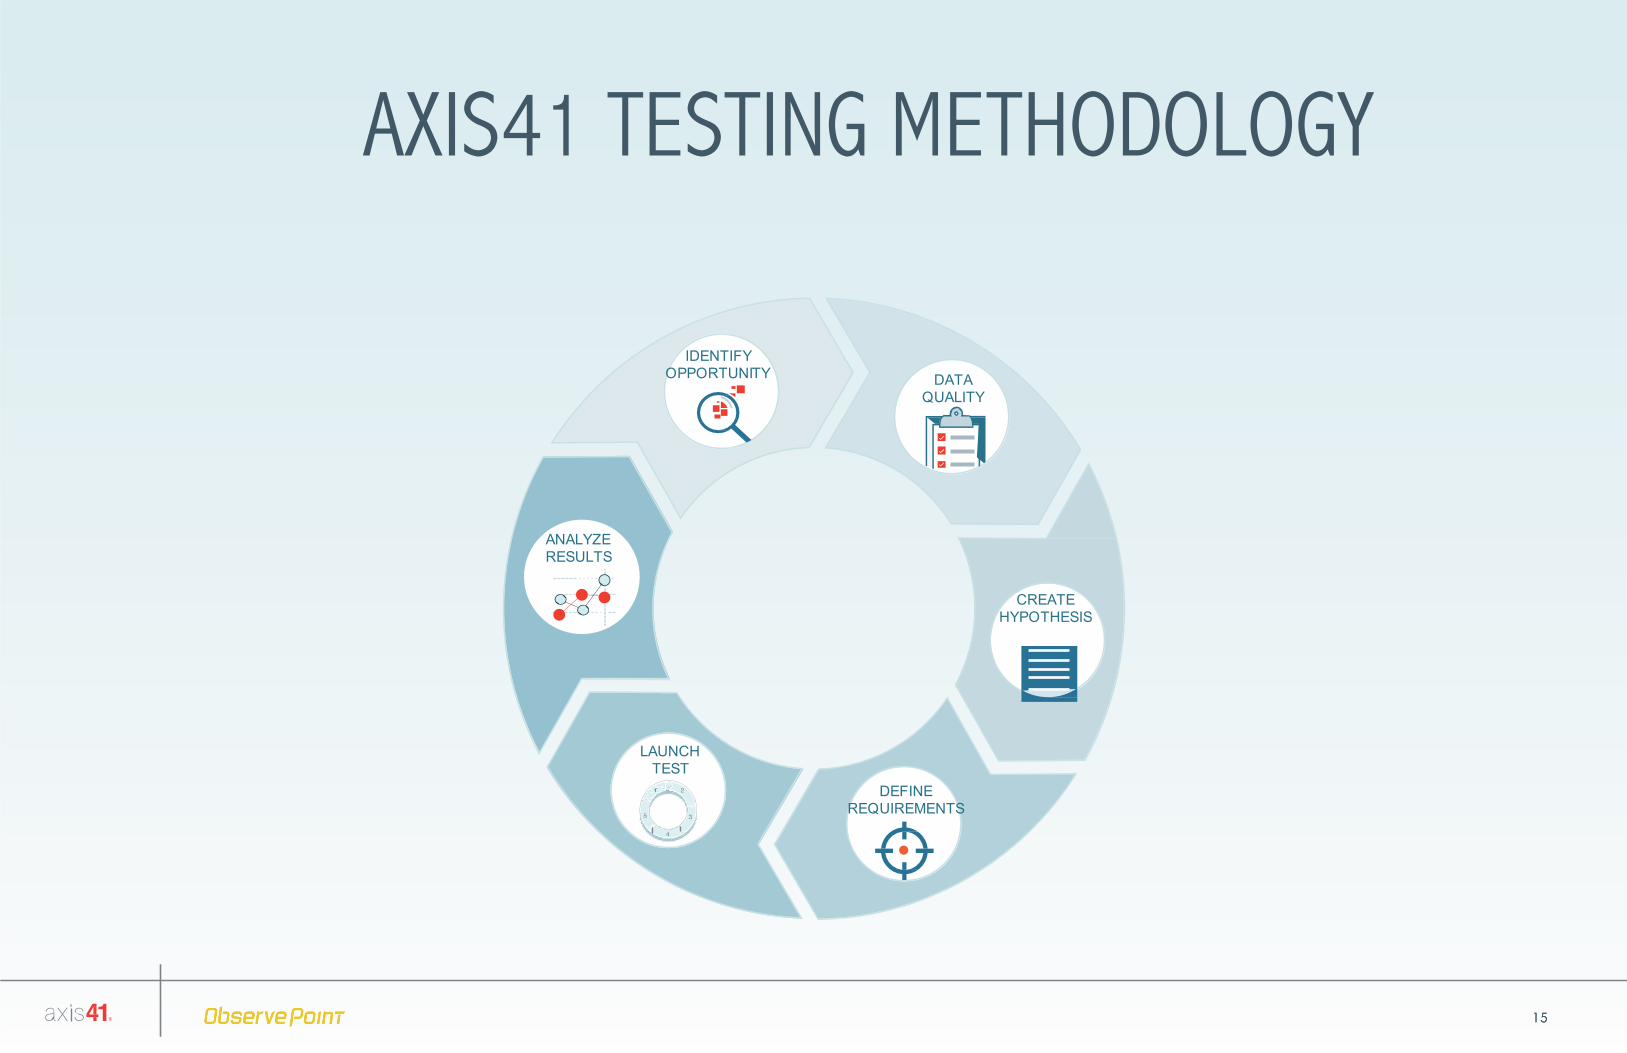
AXIS41 TESTING METHODOLOGY
15
DATA QUALITY
LAUNCH TEST
ANALYZE RESULTS
DEFINE REQUIREMENTS
CREATE HYPOTHESIS
IDENTIFY OPPORTUNITY
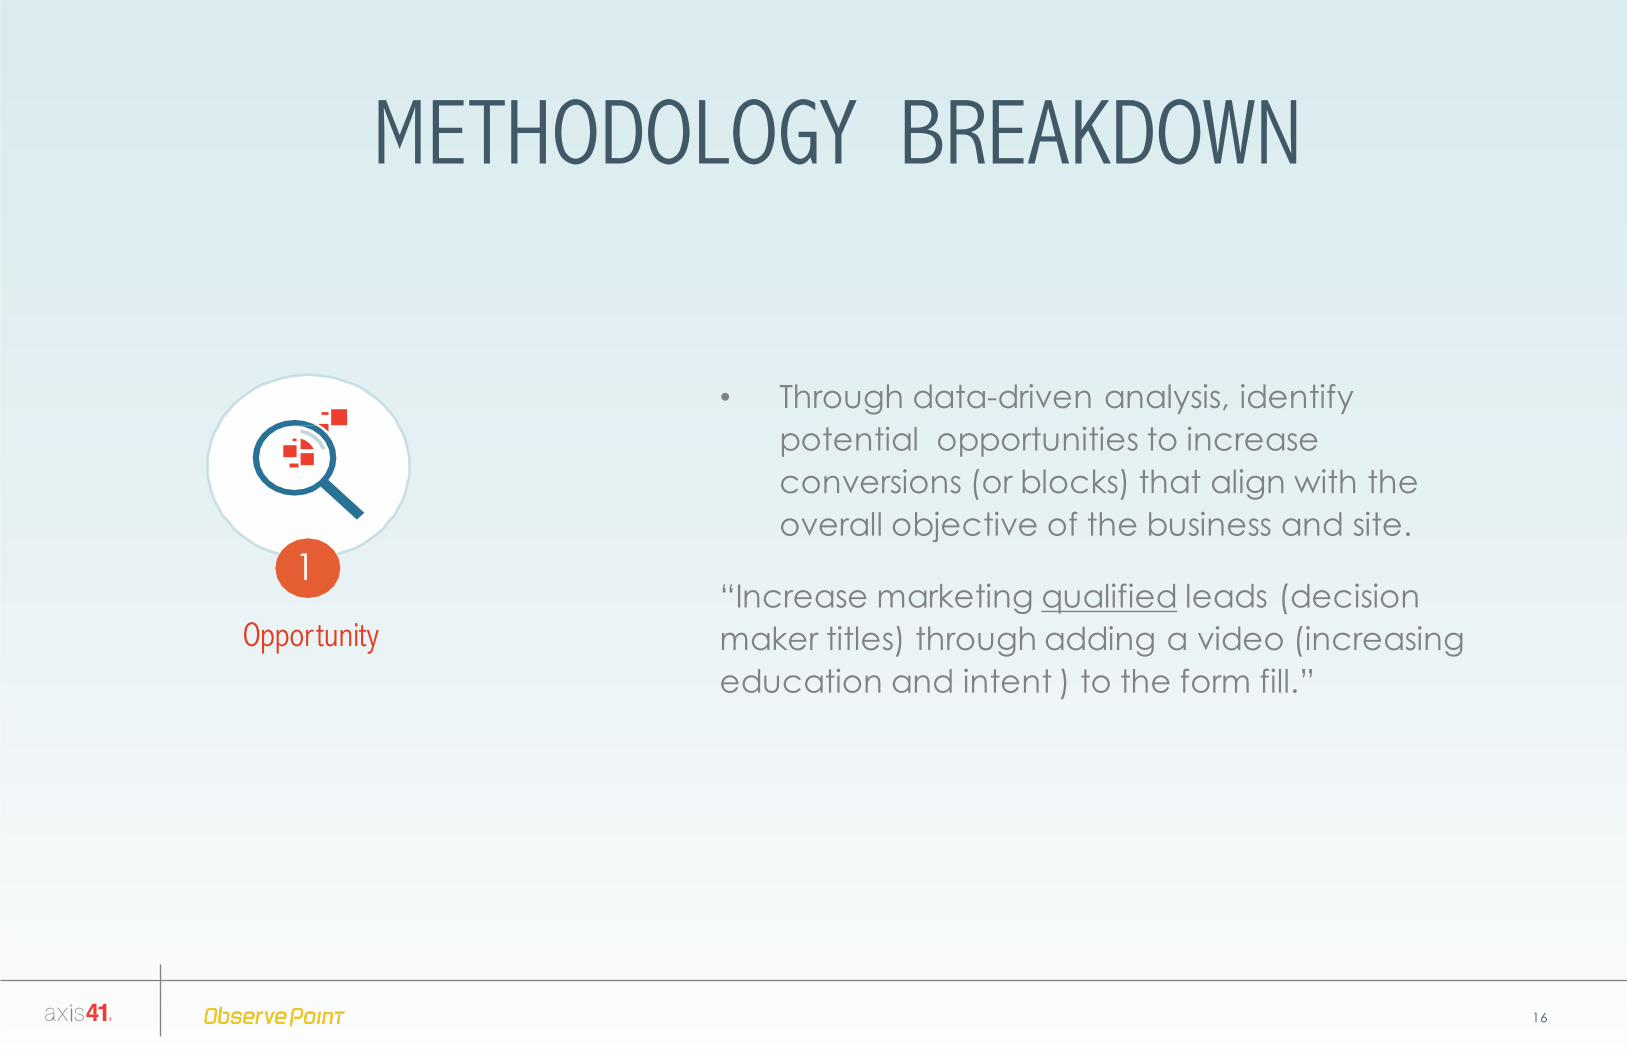
METHODOLOGY BREAKDOWN
• Through data-driven analysis, identify potential opportunities to increase conversions (or blocks) that align with the overall objective of the business and site.
“Increase marketing qualified leads (decision maker titles) through adding a video (increasing education and intent ) to the form fill.”
Opportunity
1
16
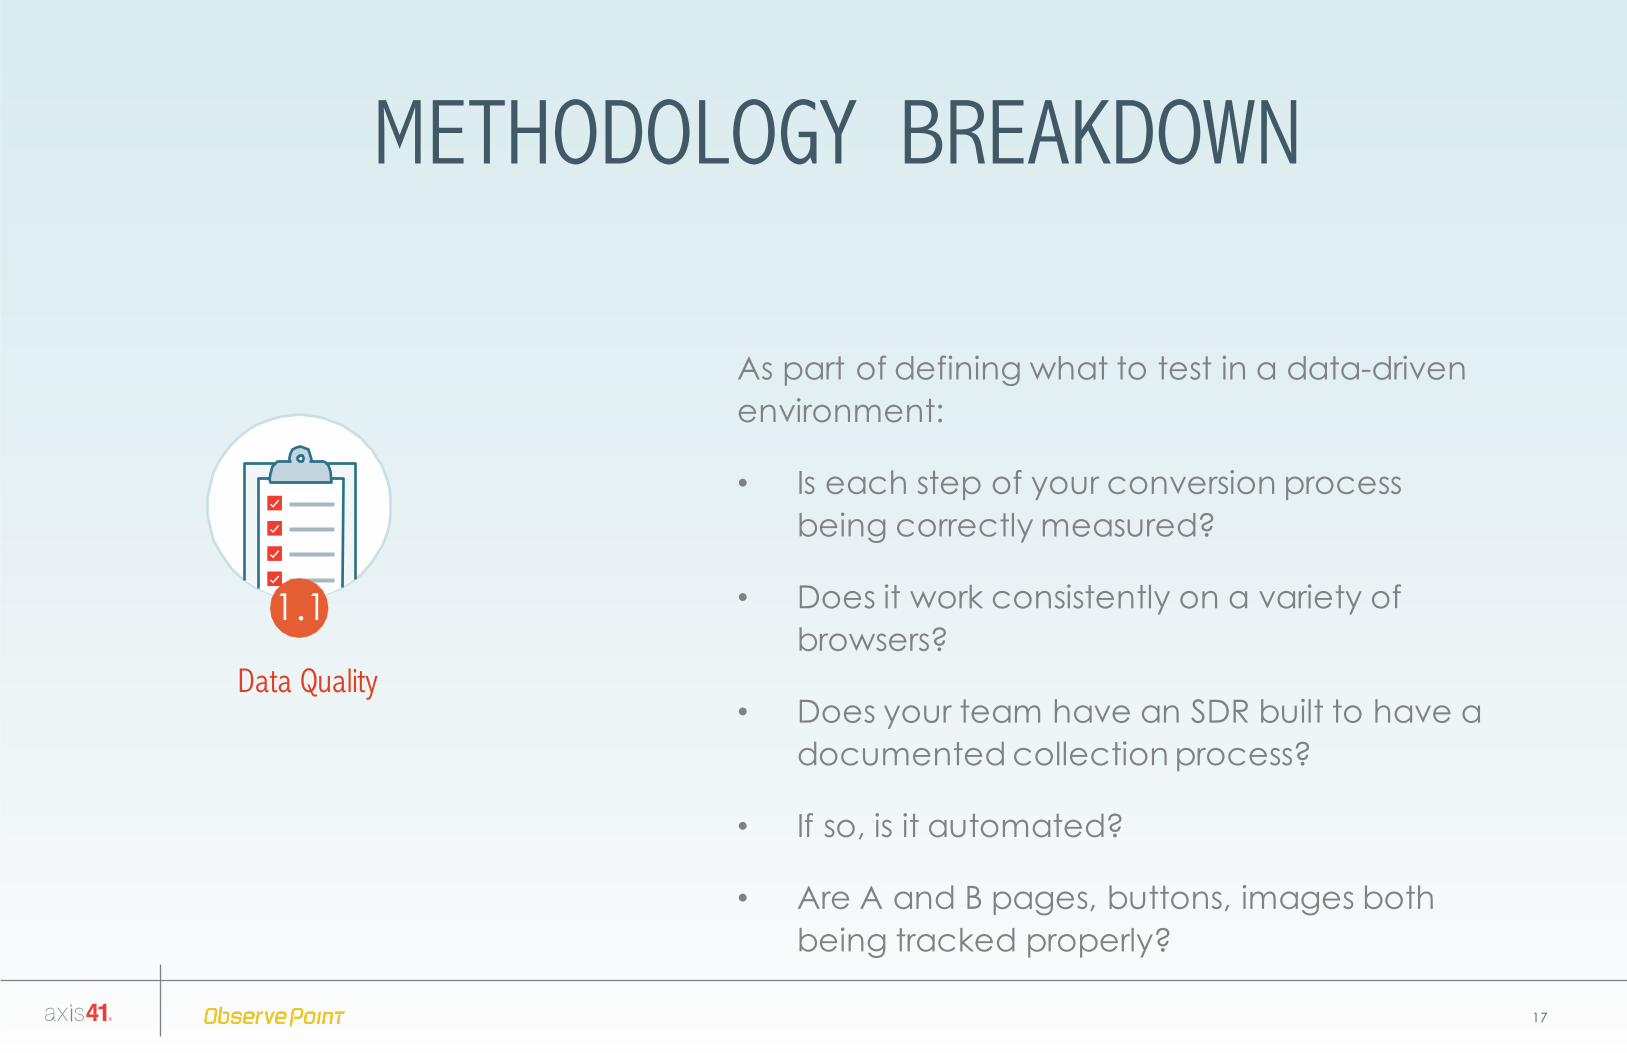
METHODOLOGY BREAKDOWN
Data Quality
1.1
17
As part of defining what to test in a data-driven environment:
• Is each step of your conversion process being correctly measured?
• Does it work consistently on a variety of browsers?
• Does your team have an SDR built to have a documented collection process?
• If so, is it automated?
• Are A and B pages, buttons, images both being tracked properly?

METHODOLOGY BREAKDOWN
18
2
Create hypothesis
• Summarize your hypothesis in one simple statement to guide the desired results and parameters.
• Clearly define the new test as compared to the original (control).
“If we add another menu to the masthead navigation, keeping the footer links constant, we should see a higher % of the share of voice shift from the footer to the masthead.”
METHODOLOGY BREAKDOWN
19
• Document the who, what, and why.
• Identify the design, text, copy, colors, elements, volume, timing, split (50/50), etc.
• Define the campaign RACI.
• Identify the technical needs forimplementation.
• Define statistical significance.
Define experiment and requirements
3
METHODOLOGY BREAKDOWN
20
Launch test
4
3
4
5
1 2
• Push it live…
• Run page tests:
• Audit the audience split.
• Make sure the testing technology didn’t effect analytics tags.
METHODOLOGY BREAKDOWN
21
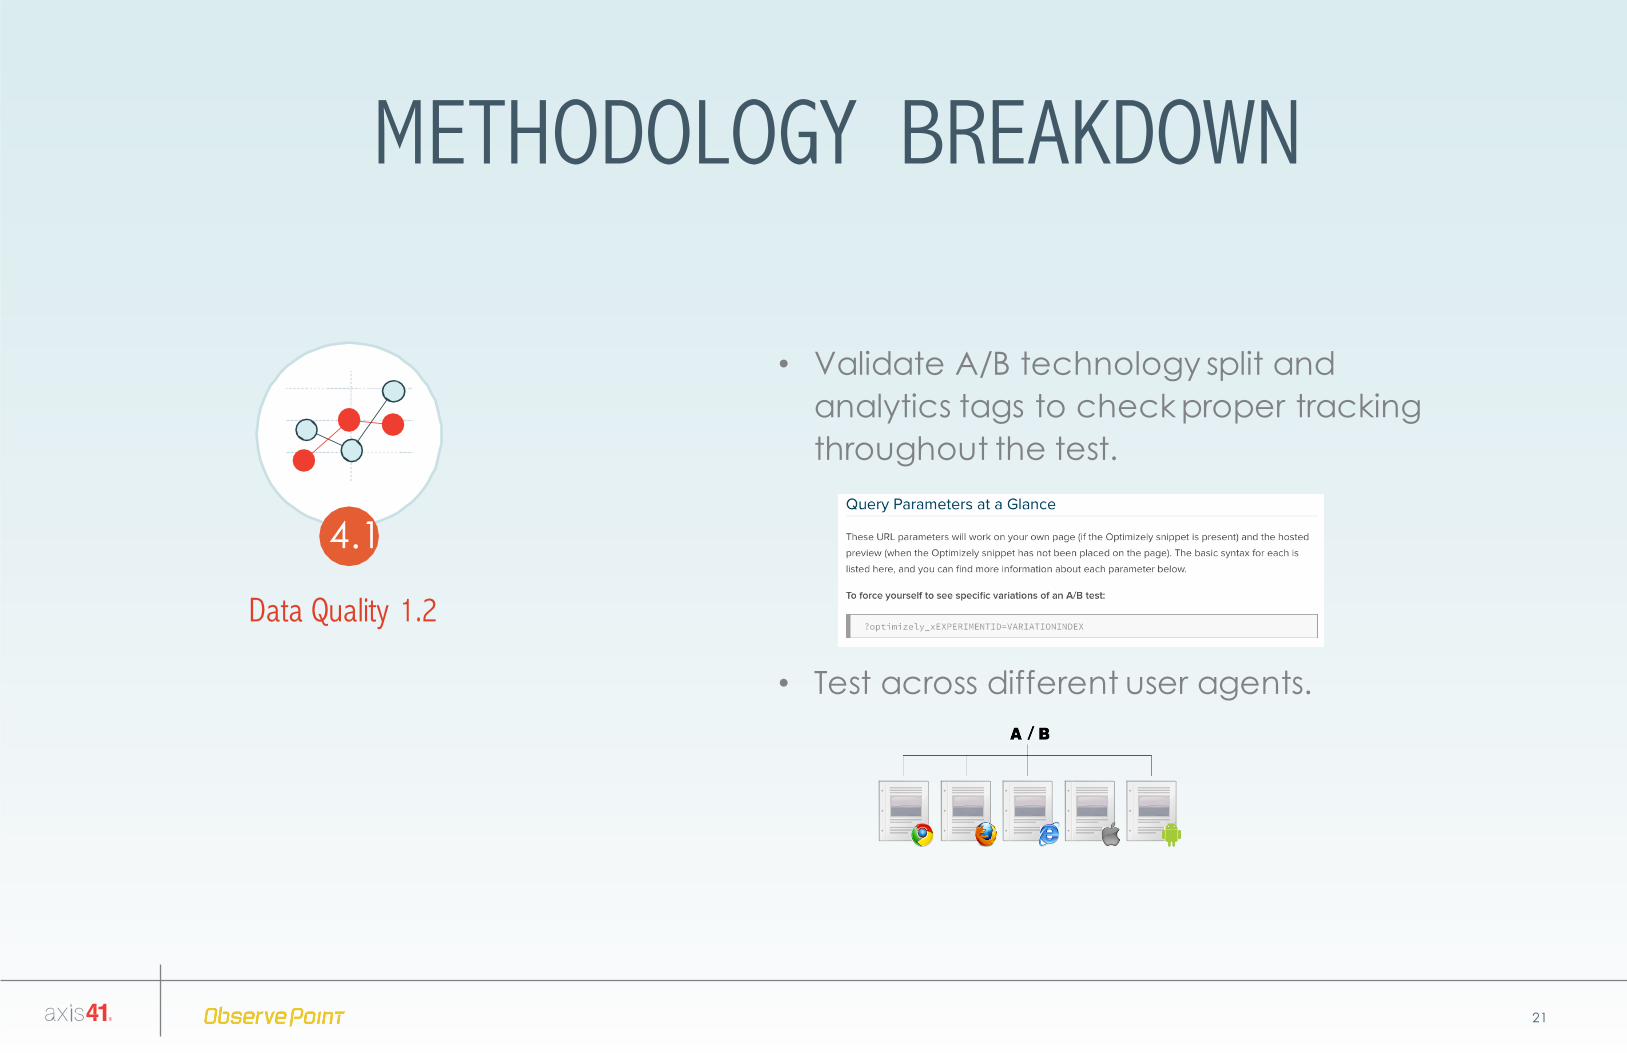
Data Quality 1.2
4.1
• Validate A/B technology split and analytics tags to check proper tracking throughout the test.
• Test across different user agents.
METHODOLOGY BREAKDOWN
22
Analyze results
5
• Analyze, analyze, and then analyze.
• Mature testing practices need to stay away from initial action analysis and dive into behavioral analysis.
• Make sure your analysis is visually and contextually clear to your audience.
• Know your audience and how they need to see the data.

23
AXIS41 TESTING METHODOLOGY
23
DATA QUALITY
LAUNCH TEST
ANALYZE RESULTS
DEFINE REQUIREMENTS
CREATE HYPOTHESIS
IDENTIFY OPPORTUNITY

24
TESTING IS A PRACTICEIt's more than just a tool.
Testing Campaign Calendar
Q1 Q2 Q3
Jun Jul Aug Sep Oct Nov Dec6 13 20 27 4 11 18 25 1 8 15 22 29 5 12 19 26 3 10 17 24 31 7 14 21 28 5 12 19 26
Home pageCTA
Pricing pageCTA
Contact form length
Sign-up redesign
Home pageheadlines
Column layout
Navigation design
Test A Test B
40%
35%
30%
25%
20%
15%
10%
5%
0%
1,200
1,000
800
600
400
200
0
24

25
425%Increase in converted clicks(July 2015 to March 2016)
212%Increase in conversion rate (leads)-58%
Decrease in cost per conversion($269 to $113)
156%Increase in click-through rate(1.31% to 3.36%)
56%Increase in completed check-outs
-21%Decrease in conversion rate (Subscribe)
EXAMPLE RESULTS

with
FREEANALYSIS ON 1 A/B TEST
Identify Holes in Web Tag Deployment
Make Sure Your Big Data is Telling the Truth
Increase the ROI of your MarTech stack
Testing & Optimization Stategy
Reporting and Analysis
Audit and Implementation
www.observepoint.com www.axis41.comContact Us | 801.303.6300Contact Us | 855.878.8466
with
FREEWEBSITE AUDIT