Embed Size (px)
Citation preview

Continuous Improvement Toolkit . www.citoolkit.com
Continuous Improvement Toolkit
Histograms and Boxplots

Continuous Improvement Toolkit . www.citoolkit.com
Check Sheets
Data Collection
Process Mapping Flowcharting
Flow Process Charts
5S
Value Stream Mapping
Control Charts
Mistake Proofing
Tree Diagram*
Understanding Performance
Fishbone Diagram
Design of Experiment
Implementing Solutions**
Creating Ideas
Brainstorming Attribute Analysis
Deciding & Selecting
Decision Tree
Force Field Analysis Cost Benefit Analysis
Voting
Planning & Project Management*
Value Analysis
Kaizen Events
Quick Changeover
Managing Risk
FMEA
PDPC
RAID Log*
Observations
Focus Groups
Understanding Cause & Effect
Pareto Analysis
IDEF0
5 Whys
Matrix Diagram Kano Analysis
KPIs
Lean Measures
Importance-Urgency Mapping
Waste Analysis
Fault Tree Analysis
Relationship Mapping*
Benchmarking**
SCAMPER**
C&E Matrix
Confidence Intervals
Pugh Matrix
SIPOC*
Prioritization Matrix
Stakeholder Analysis
Critical-to Tree
Paired Comparison
Improvement Roadmaps
Interviews
QFD
Graphical Analysis
Lateral Thinking
Hypothesis Testing
Visual Management
Ergonomics
Reliability Analysis
Cross Training
How-How Diagram**
Flow
Time Value Map
ANOVA
Gap Analysis*
Traffic Light Assessment
TPN Analysis
Decision Balance Sheet
Suggestion systems
Risk Assessment*
Automation Simulation
Break-even Analysis
Service Blueprints
DMAIC
Process Redesign
Run Charts
TPM
Control Planning
Chi-Square
SWOT Analysis
Capability Indices
Policy Deployment
Data collection planner*
Affinity Diagram Questionnaires
Probability Distributions
Bottleneck Analysis**
MSA
Descriptive Statistics
Cost of Quality*
Process Yield
Histograms & Boxplots
Just in Time
Pick Chart
Portfolio Matrix
Four Field Matrix
Root Cause Analysis Data Snooping
Morphological Analysis Sampling
Spaghetti Diagram
Pull
OEE
Mind Mapping*
Project Charter
PDCA
Designing & Analyzing Processes
Correlation Scatter Plots Regression
Gantt Charts
Activity Networks RACI Matrix
PERT/CPM Daily Planning
MOST
Standard work Document control A3 Thinking
The Continuous Improvement Map
Multi vari Studies

Continuous Improvement Toolkit . www.citoolkit.com
Histograms:
A histogram is a graphical representation of a frequency distribution for numeric data.
It is a type of bar chart.
Used as the first step to determine the probability distribution of a data set.
It allows to visually and quickly assess:
• The shape of the distribution.
• The central tendency.
• The amount of variation in the data.
• The presence of gaps, outliers or unusual data points.
- Histograms and Boxplots
Position
Spread
Continuous Improvement Toolkit . www.citoolkit.com
Histograms:
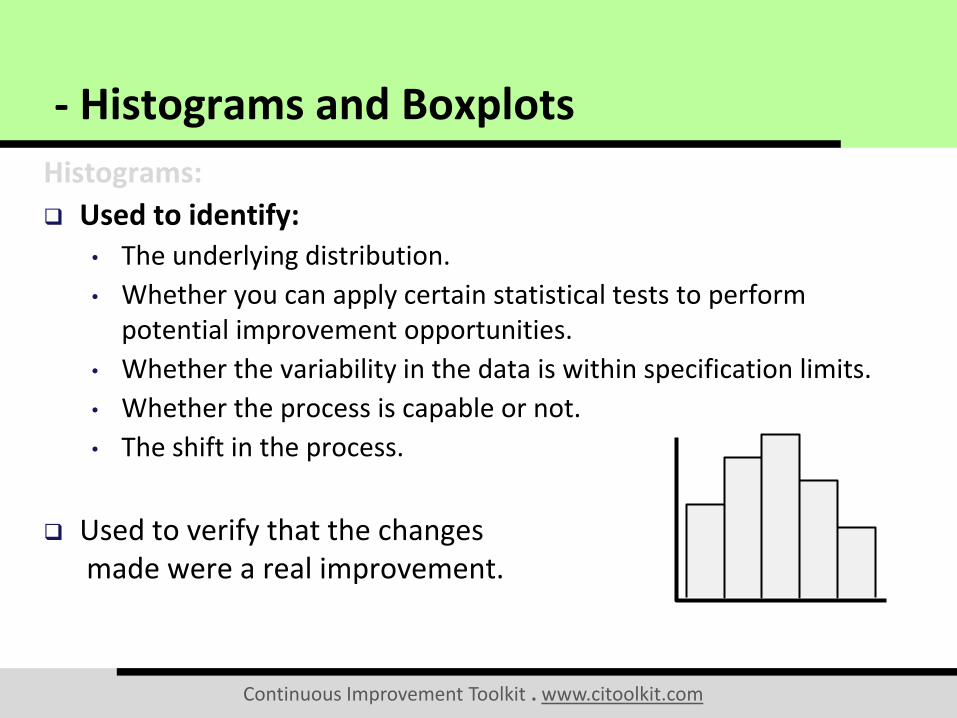
Used to identify: • The underlying distribution.
• Whether you can apply certain statistical tests to perform potential improvement opportunities.
• Whether the variability in the data is within specification limits.
• Whether the process is capable or not.
• The shift in the process.
Used to verify that the changes made were a real improvement.
- Histograms and Boxplots

Continuous Improvement Toolkit . www.citoolkit.com
Histograms:
Often represents moderate to large amount of continuous data. • Needs at least 25 data points to
determine following a particular distribution.
It may not accurately display the distribution shape if:
• The data size is too small.
• If the measurement system has a low resolution.
Dotplots are preferred over histograms when:
• Representing small amount of data.
• Comparing between multiple distributions.
- Histograms and Boxplots

Continuous Improvement Toolkit . www.citoolkit.com
Histograms:
Plot your data in a histogram after collecting the data to know: • The minimum and maximum values.
• The type of the distribution (normal, exponential, etc.).
• The shape of the distribution (Symmetric or skewed).
• Whether it is unimodal, bimodal, or multimodal.
- Histograms and Boxplots
Unimodal
Symmetric
Bimodal
Skewed

Continuous Improvement Toolkit . www.citoolkit.com
Common Probability Distributions:
- Histograms and Boxplots
Normal
Binomial
Poisson
Exponential
Chi-squared
Student’s T
F
Uniform

Continuous Improvement Toolkit . www.citoolkit.com
To Construct a Histogram:
Split the data into intervals called bins.
Draw bars above each bin to represent the frequency of the data values within each interval.
The bars should be adjacent with no gaps between them to indicate the continuity of the data.
The mean of the data and the specification limits are often indicated on the histogram.
- Histograms and Boxplots
Mean

Continuous Improvement Toolkit . www.citoolkit.com
Example – A histogram that represents the distribution of cable diameters in a manufacturing process:
- Histograms and Boxplots
0.600.580.560.540.520.50
20
15
10
5
0
Mean 0.5465
StDev 0.01934
N 100
Diameter of cable
Fre
qu
en
cy

Continuous Improvement Toolkit . www.citoolkit.com
Histograms:
The result should be summarized using day to day language such as:
“The distribution looks symmetric around the cable diameter mean (0.546 cm) and appears to fit the Normal Distribution”.
- Histograms and Boxplots
0.600.580.560.540.520.50
20
15
10
5
0
Mean 0.5465
StDev 0.01934
N 100
Diameter of cable
Fre
qu
en
cy

Continuous Improvement Toolkit . www.citoolkit.com
Example – An analysis that was conducted for diagnosing the presence of diabetes at a workplace.
- Histograms and Boxplots
The histogram here shows the distribution of the 310 test results.
It is skewed to the right and it is more like an exponential distribution which is normal for this type of data.

Continuous Improvement Toolkit . www.citoolkit.com
Boxplots:
A graphical way that summarizes the important aspects of the distribution of continuous data.
Useful when comparing between several groups of data sets.
Used for moderate to large amount of data • The size of the boxplot can vary significantly if the data size is too
small.
Less detailed than histograms.
Take up less space which allows easy comparison of multiple data sets.
- Histograms and Boxplots

Continuous Improvement Toolkit . www.citoolkit.com
Boxplots:
Primarily used when comparing several distributions.
They summarize key statistics from the data.
They display data in a box-and-whiskers format.
They provide a quick way for examining the variation present in the data.
A wider range boxplot indicates more variability.
Also used to check if there is a significant difference in the process after implementing a process improvement initiative.
- Histograms and Boxplots

Continuous Improvement Toolkit . www.citoolkit.com
Boxplots:
Tell whether the distribution is symmetrical or skewed. • The spacings between the different parts of a boxplot indicate the
spread and skewness present in the data.
Display outliers in the data.
The data is plotted such as: • The middle 50% of the data points fits inside the box.
• The bottom 25% of the data points located below the box.
• The top 25% of the data points located above the box.
Each whisker may extends up to 1.5 times the length of the box.
- Histograms and Boxplots

Continuous Improvement Toolkit . www.citoolkit.com
Boxplots:
The middle line is the median of the data points.
Sometimes they display the mean with an additional character.
Any data beyond the whiskers are considered outliers
Outliers are plotted as asterisks (*).
Outliers often reflect errors in data recording or data entry.
If the values are real you should investigate what was going on in the process at the time.
- Histograms and Boxplots
* * ●

Continuous Improvement Toolkit . www.citoolkit.com
Boxplots:
- Histograms and Boxplots
25%
Median
Interquartile Range
Outliers
Whisker
25%
25%
25%
Minimum Value
Box
X Mean
Quartile Group 4
Quartile Group 1

Continuous Improvement Toolkit . www.citoolkit.com
Boxplots and Histograms:
- Histograms and Boxplots
Mean
* ●
Median

Continuous Improvement Toolkit . www.citoolkit.com
Example – Boxplots that display the yield of a crop after applying two different fertilizers:
- Histograms and Boxplots
Fertilizer 2Fertilizer 1
55
50
45
40
35
Yie
ld
Fertilizer 2 appears to have a higher yield than Fertilizer 1

Continuous Improvement Toolkit . www.citoolkit.com
Example – An analysis that was conducted for diagnosing the presence of diabetes at a workplace.
- Histograms and Boxplots
It is evident that the females have in general higher glucose levels than the males.
ANOVA can be used here to test the significance of the factors.

Continuous Improvement Toolkit . www.citoolkit.com
Further Information:
Histograms are sometimes called Frequency Plots
Boxplots are referred to as Box-and-Whisker Plots.
They can be drawn either vertically or horizontally.
There are many graphical tools that can generate histograms and boxplots quickly and easily (such as Minitab).
A histogram is normally used for continuous data while a bar chart is a plot of count data.
Histograms can’t see changes and trends over time.
Individual Value Plots are preferred over boxplots when representing small amount of data.
- Histograms and Boxplots