Embed Size (px)
Citation preview

This content has been downloaded from IOPscience. Please scroll down to see the full text.
Download details:
IP Address: 51.175.145.26
This content was downloaded on 04/04/2016 at 18:49
Please note that terms and conditions apply.
2 °C and SDGs: united they stand, divided they fall?
View the table of contents for this issue, or go to the journal homepage for more
2016 Environ. Res. Lett. 11 034022
(http://iopscience.iop.org/1748-9326/11/3/034022)
Home Search Collections Journals About Contact us My IOPscience

Environ. Res. Lett. 11 (2016) 034022 doi:10.1088/1748-9326/11/3/034022
LETTER
2°C and SDGs: united they stand, divided they fall?
Christoph von Stechow1,2,3, JanCMinx1,2,4, KeywanRiahi5,6, Jessica Jewell5, David LMcCollum5,MaxWCallaghan4, ChristophBertram2, Gunnar Luderer2 andGiovanni Baiocchi7
1 Mercator Research Institute onGlobal Commons andClimate Change, 10 829 Berlin, Germany2 Potsdam Institute for Climate Impact Research, 14 412 Potsdam,Germany3 Department of Economics of Climate Change, Technical University Berlin, 10 623Berlin, Germany4 Hertie School of Governance, 10 117Berlin, Germany5 International Institute for Applied SystemsAnalysis, A-2361 Laxenburg, Austria6 Institute of Thermal Engineering, GrazUniversity of Technology, A-8010Graz, Austria7 Department ofGeographical Sciences, University ofMaryland, College Park,MD20 742,USA
E-mail: [email protected]
Keywords: climate change mitigation, climate policy, co-benefits, risk management, energy efficiency, sustainable development, mitigationrisks
Supplementarymaterial for this article is available online
AbstractThe adoption of the SustainableDevelopmentGoals (SDGs) and the new international climate treatycould put 2015 into the history books as a defining year for setting human development on amoresustainable pathway. The global climate policy and SDGagendas are highly interconnected: thewaythat the climate problem is addressed strongly affects the prospects ofmeeting numerous other SDGsand vice versa. Drawing on existing scenario results from a recent energy-economy-climatemodelinter-comparison project, this letter analyses these synergies and (risk) trade-offs of alternative 2 °Cpathways across indicators relevant for energy-related SDGs and sustainable energy objectives.Wefind that limiting the availability of keymitigation technologies yields some co-benefits and decreasesrisks specific to these technologies but greatly increasesmany others. Fewer synergies and substantialtrade-offs across SDGs are locked into the system forweak short-term climate policies that are broadlyin linewith current IntendedNationallyDeterminedContributions (INDCs), particularly whencombinedwith constraints on technologies. Lowering energy demand growth is key tomanagingthese trade-offs and creating synergies acrossmultiple energy-related SDdimensions.We argue thatSD considerations are central for choosing socially acceptable 2 °Cpathways: the prospects ofmeetingother SDGs need not dwindle and can even be enhanced for some goals if appropriate climate policychoices aremade. Progress on the climate policy and SDGagendas should therefore be trackedwithina unified framework.
1. Introduction
There is hope that 2015 will be remembered as adefining year for setting human development on amore sustainable pathway. Two important milestoneswere reached. On 25 September, a new developmentagenda was adopted in New York aimed at eradicatingpoverty and facilitating inclusive development withinever tighter planetary boundaries. Economic, socialand environmental progress will be tracked across a setof agreed sustainable development goals (SDGs). TheSDG framework is intended to manage trade-offs and
maximize synergies across the 17 different goals andassociated 169 targets (Griggs et al 2013).
On 12 December, countries agreed upon a newinternational climate treaty, the Paris Agreement, atthe United Nations Framework Convention on Cli-mate Change (UNFCCC) Conference of Parties(COP21) in Paris. It ‘aims to strengthen the globalresponse to the threat of climate change, in the contextof sustainable development and efforts to eradicatepoverty, including by holding the increase in the globalaverage temperature to well below 2 °C above pre-industrial levels’ (UNFCCC2015a).
OPEN ACCESS
RECEIVED
28 September 2015
REVISED
5 February 2016
ACCEPTED FOR PUBLICATION
10 February 2016
PUBLISHED
16March 2016
Original content from thisworkmay be used underthe terms of the CreativeCommonsAttribution 3.0licence.
Any further distribution ofthis workmustmaintainattribution to theauthor(s) and the title ofthework, journal citationandDOI.
© 2016 IOPPublishing Ltd

Both processes are highly interrelated: SD is anexplicit part of the Paris Agreement, while avoidingdangerous climate change features as one of the SDGs(#13). In fact, failure in one process would underminethe success of the other. Stringent and sustained miti-gation is a necessary condition for SD, because una-bated climate change will exacerbate many of today’sdevelopment issues and negate future improvements(see Fleurbaey et al 2014). However, it is an insufficientcondition for SD, because some 2 °C pathways could,if not designed properly, undermine SD in non-cli-mate dimensions. For example, pathways with a lim-ited short-term ambition like the current INDCs mayhave higher SD risks than more ambitious ones. Suchbroader SD implications could delegitimize some 2 °Cpathways or even the 2 °C target itself (Edenhofer andKowarsch 2015). SD further hinges on the successfulimplementation of non-climate policies that comple-ment or support climate policies in other dimensions.Thus, identifying socially acceptable 2 °C pathwaysrequires framing climate policy in a broader SDcontext.
Assessments of alternative mitigation pathways sofar have mainly focused on characterizing the under-lying technological and economic challenges (Clarkeet al 2014), but less is known about the wider social,economic and environmental implications. For exam-ple, many 2 °C pathways project large amounts ofbioenergy demand in the second half of this century. Itis highly debated in the literature whether these can beprovided sustainably: food security, place-specificlivelihoods, water availability and biodiversity areamongst the critical issues being discussed (Creutziget al 2012, Smith et al 2014). At the same time, many2 °C pathways project potential health gains and co-benefits for other sustainability objectives. The bal-ance of these co-effects is poorly understood, particu-larly on the supply side, because risks of alternative2 °C pathways for non-climate sustainability objec-tives have not yet been systematically analyzed (vonStechow et al 2015).
In this letter, we analyze the implications of alter-native 2 °C pathways for SD risk dimensions by draw-ing on existing, publicly available inter-modelcomparison results from integrated energy-economy-climate models—henceforth referred to as integratedmodels (see SI section 1, available at stacks.iop.org/ERL/11/034022/mmedia). We demonstrate howbroadening the analytical framework can allow bothfor a more informed public debate about alternative2 °C pathways and how achieving the climate SDGmay affect the prospects of meeting other energy-rela-ted SDGs. This is important both for critically discuss-ing the relationship between the international climatepolicy and SDG agendas as well as for identifying strin-gentmitigation pathways that are socially acceptable.
2.Methods
Choosing appropriate climate policies is an exercise inriskmanagement for which it is key to understand andevaluate relevant uncertainties (Kunreutheret al 2013). We focus on uncertainties related todifferent model structures and assumptions, i.e.‘model uncertainty’ (Drouet et al 2015) and draw onresults from a structured inter-comparison exercise ofintegrated energy-economy-climate models,AMPERE (Kriegler et al 2015, Riahi et al 2015). Tocomplement existing literature, this data is used toassess relevant SD implications of alternative clustersof mitigation pathways that are consistent with the2 °C target (see table S2) to initiate a public debate ontheir wider sustainability implications.
2.1. Choice of indicators for SD risksThe analysis builds on recent literature that explores agrowing number of mitigation challenges with impli-cations for non-climate sustainability objectives.Comprehensive discussions can be found in Clarkeet al (2014, section 6.6) and von Stechow et al (2015,section 4). Table 1 summarizes the indicators that canbe calculated from integrated model variables. Ourchoice of indicators is further constrained by themodel structures, scenario runs, and reported vari-ables as aggregated in the publicly available AMPEREdatabase (https://secure.iiasa.ac.at/web-apps/ene/AMPEREDB). For example, the coarse regional dis-aggregation of reported data in AMPERE impedes theanalysis of indicators that are most relevant forinequality and poverty outcomes, such as energysupply per capita to satiate basic human needs (seeSteckel et al 2013, Lamb and Rao 2015 and SI section 2for a discussion of further model limitations). Bysystematically linking the chosen set of indicators toglobal SD risks, we can present a first, rough approx-imation of how alternative clusters of 2 °C pathwaysperform with respect to energy-related SDGs andother multilaterally agreed sustainable energy objec-tives (see table 2 and SI section 3 for a discussion on theindicator choice).
Due to the limiteddata availability, the analysis can-not address all relevant SDGs explicitly. But it enablesus to provide an early contribution to public and scien-tific debates on the relationship between the interna-tional climate policy and SDG agendas and contributeto important early learning processes. To simplify thecomplex relationship between indicators, energy-rela-ted SDGs and other sustainable energy objectives (seefigure S2), table 2 focuses on the strongest linksbetween them. However, many indicators are also rele-vant for some cross-cutting SDGs, such as poverty andinequality, which are not addressed in the analysis (seeSI section 3.1). The resulting set of indicators is relevantfor judging both co-benefits of mitigation (air quality,oil security) and mitigation risks (upscaling of
2
Environ. Res. Lett. 11 (2016) 034022

bioenergy and low-carbon electricity technologies) andhas been shown to have substantial sustainability impli-cations in many integrated models (Jewell et al 2013,McCollum et al 2013a, von Stechow et al 2015). It alsoincludes an indicator for ocean acidification (Jooset al 2011, Zickfeld et al 2012) as well as three indicatorsthat relate to transitional socioeconomic mitigationrisks (growth in mitigation costs and energy prices aswell as early retirement of coal capacity).
Our analysis presents SD risk profiles for alter-native clusters of 2 °C pathways (see figures 2–4). Thefigures plot percentage changes over baseline projec-tions in each dimension rather than comparing differ-ent metrics to each other and/or identifying criticalthresholds because of the difficulty of incommensur-ability across different SD dimensions (von Stechowet al 2015). Care needs to be taken in the interpreta-tion, because the different risks analyzed cannot be
Table 1. Integratedmodel literature onmitigation challenges with implications for non-climate sustainability objectives, with a focus onindicators that can be calculated frommodel variables. The different categories largely follow table 4.1 in Fleurbaey et al (2014). Due tostrengths andweaknesses of themodels, somemitigation challenges were only analyzed by individualmodels while others were covered bymultiplemodels—mostly in the context ofmodel inter-comparison projects. A comprehensive review on co-benefits and risks ofmitigationis provided in von Stechow et al (2015).
Mitigation challenges Indicators used Selected literature
Economic/affordability challenges
Aggregate economic costs of
mitigation
Aggregated and discountedGDP/
consumption losses
Kriegler et al 2013, Paltsev andCapros 2013, Clarke
et al 2014, Kriegler et al 2014, Rogelj et al 2015
Transitional economic costs of
mitigation
Consumption growth reduction Kriegler et al 2013, Luderer et al 2013a, 2013b, Bertram
et al 2015b
Carbon price growth Carbon price jump over a decade Rogelj et al 2013a, 2015
Global energy price index Luderer et al 2013b, Bertram et al 2015b
Energy price growth Electricity price growth rate Kriegler et al 2013, Rogelj et al 2015
Stranded fossil investment Idle power plant capacity per year Luderer et al 2013a, Rogelj et al 2013a, Bertram et al 2015a,
Johnson et al 2015
Energy dependence Tradeflows between regions Cherp et al 2013, Jewell et al 2013, 2014, Riahi et al 2012
Resilience of energy systems Diversity of energy carriers in indivi-
dual sectors (SWDI,HHI)Cherp et al 2013, Jewell et al 2013, 2014
Depletion of oil reserves Cumulative oil extraction Sathaye et al 2011, Jewell et al 2013
Technological/innovation challenges
Integration challenges of low-
carbon technologies
Technological upscaling (rates) Wilson et al 2013, Kim et al 2014, Eom et al 2015, Riahi
et al 2015, van Sluisveld et al 2015, Bertram et al 2015a
Carbon intensity improvement Carbon intensity reduction rates Luderer et al 2013a, Edenhofer et al 2014a, Kriegler
et al 2014, Riahi et al 2015
Social/institutional challenges
Food price increase World and regionalmarket prices von Braun et al 2008, PBL 2012, Lotze-Campen et al 2014,
Wise et al 2014, vanVuuren et al 2015
Energy supply per capita/
energy access
Final energy supply per year/access to
modern fuels
van Ruijven et al 2012,Daioglou et al 2012, Krey et al 2012,
Steckel et al 2013, Riahi et al 2012, Pachauri et al 2013,
Lamb andRao 2015, vanVuuren et al 2015
Nuclear proliferation Enrichment/reprocessing facilities Lehtveer andHedenus 2015
Carbonmarket value Value of cumulative emissions Luderer et al 2013b, Bertram et al 2015b
Environmental challenges
Resource extraction/use Cumulative coal/uranium extraction Rogner et al 2012, Bauer et al 2013,McCollum et al 2014
Bioenergy expansion Biomass supply for energy Creutzig et al 2012, Smith et al 2014
Air pollutant concentration SO2, BC,OC andNOx emissions/
concentrations
Riahi et al 2012,McCollum et al 2013a, Rogelj et al 2014,
Rose et al 2014, Strefler et al 2014, vanVuuren et al 2015
Environmental risks of CO2
capture and storage
CO2 (fossil/biomass) captured andstored underground
Kriegler et al 2013, Eom et al 2015, Rogelj et al 2015, Smith
et al 2016
Land use change Global area changes for cropland,
pasture, biomass, unmanaged land
Wise et al 2009, Reilly et al 2012, Lotze-Campen et al 2014,
Popp et al 2014, Calvin et al 2014
Water shortage Water use (mainly for bioenergy
supply)De Fraiture et al 2008, Arnell et al 2011, PBL 2012,Hejazi
et al 2013, Bonsch et al 2016
Biodiversity loss Mean species abundance (MSA) PBL 2012, vanVuuren et al 2015
Peak atmospheric CO2
concentration
Cumulative CO2 emissions until
mid-century
Joos et al 2011, Zickfeld et al 2012
Exceedance likelihood/
overshoot risk
Likelihood of exceeding specific
temperature/concentration target
Kriegler et al 2013, Luderer et al 2013b, Rogelj
et al 2013a, 2013b
3
Environ. Res. Lett. 11 (2016) 034022
directly compared to each other, i.e. a larger increasein one risk is not necessarily more important than asmaller increase in another risk. Any interpretation ofthese risk profiles and any trade-off across risk dimen-sions requires evaluation and weighting—and thisdepends on the locally specific policy contexts and dif-fer depending on individual priorities and risk percep-tions (Slovic 1987, Jakob and Edenhofer 2014,Kunreuther et al 2014). The provided risk profilestherefore allow readers to make their own judgementabout the relevance of changes in risk levels across SDdimensions. In this sense our analysis provides a start-ing point for a more informed public debate about theinteraction between the mitigation and other energy-related SDGs that will put the normative aspects ofsuch evaluation centre stage (see Edenhofer et al2014b).
2.2. Choice of scenario dataUsing model inter-comparison results from AMPEREallows us to take advantage of an internally consistentset of scenario specifications and harmonized inputassumptions (Kriegler et al 2015, Riahi et al 2015).AMPERE work package 2 was chosen because (i) thedata is publicly available, (ii) it consistently definesalternative short-term climate policy pathways acrossmodels until 2030, which is particularly relevant froman SDG perspective with a focus on short/medium-term developments, and (iii) it is the only model inter-comparison project that combines different types ofconstraints with respect to the stringency of short-term climate policies and the availability of mitigationtechnologies or energy demand growth assumptions(see table 3 and SI section S4). This is a keyrequirement for comprehensively exploring the SDrisk dimensions of alternative 2 °C pathways. Yet thereported data does not shed light on all relevantdimensions. One shortcoming is the simplifying
assumption of regionally homogeneous carbon priceswithout consideration of burden sharing regimes. Thisimpedes an analysis of regional mitigation cost dis-tributions (see den Elzen et al 2008, Luderer et al 2012,Tavoni et al 2013, Aboumahboub et al 2014, Tavoniet al 2015) and related SD implications.
The analysis draws on more than 20 scenario spe-cifications from seven models: DNE21+, GCAM,IMAGE, MESSAGE, POLES, REMIND, and WITCH(for further information, see Riahi et al (2015) and SIsection 4). To avoid comparisons of scenario resultsfrom different sets of models, most figures only drawon a subset of models as (i) not all models ran or founda solution for all mitigation scenario specifications,and (ii) not all models report results for all indicatorsdue to model type, assumptions on parameters andconstraints, or respective system boundaries (see tableS1). The results are presented similarly to the scenarioranges in the Working Group III contribution to theIPCC Fifth Assessment Report (WGIII AR5) becausethis shows variability across models. However, giventhat the sample size is small and no systematic varia-tion of all relevant model input assumptions was per-formed this variability does not represent full modeluncertainty.
3. Results
The analysis is divided into two parts: we assess co-benefits of alternative 2 °C pathways before turning totheir mitigation risk profiles. In each part, we system-atically analyze different clusters of 2 °C pathways tounderstand the implications for SD outcomes ofvariations in (i) short-term climate policy stringency,(ii) availability of mitigation technologies or (iii) acombination of the two. Analyzing these clusters ishighly relevant, because the current and projectedINDC emission trajectories are not consistent with
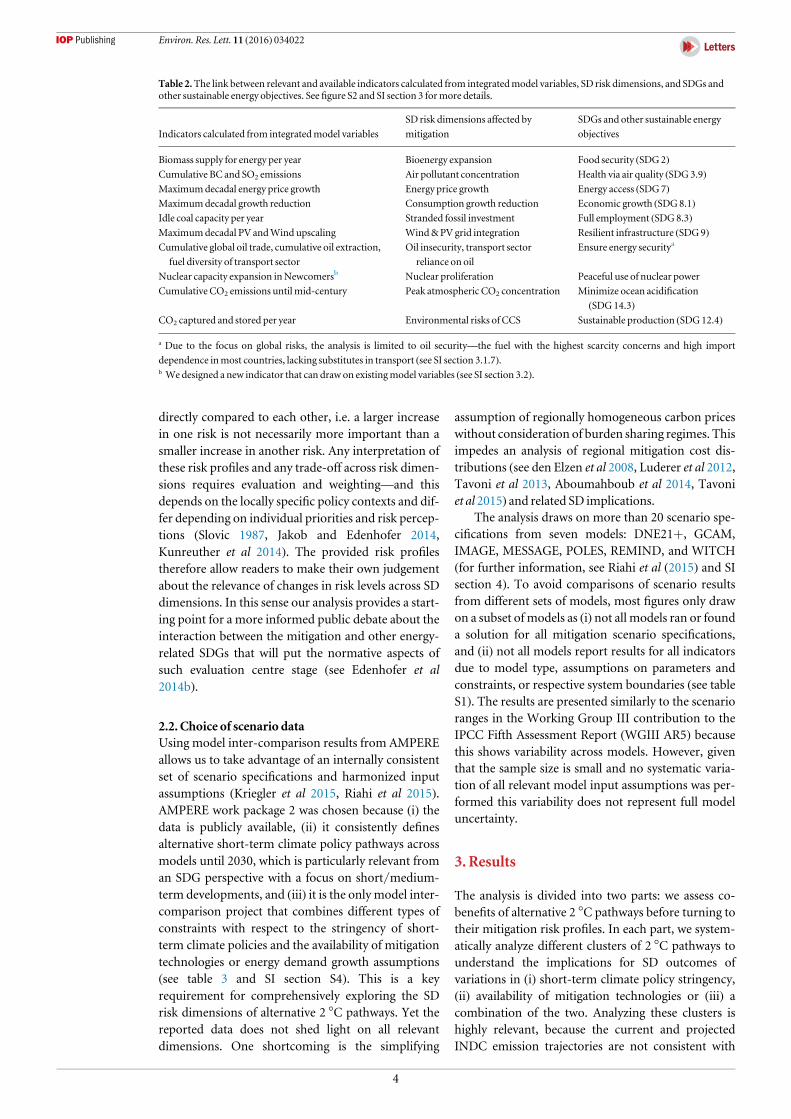
Table 2.The link between relevant and available indicators calculated from integratedmodel variables, SD risk dimensions, and SDGs andother sustainable energy objectives. See figure S2 and SI section 3 formore details.
Indicators calculated from integratedmodel variables
SD risk dimensions affected by
mitigation
SDGs and other sustainable energy
objectives
Biomass supply for energy per year Bioenergy expansion Food security (SDG2)Cumulative BC and SO2 emissions Air pollutant concentration Health via air quality (SDG3.9)Maximumdecadal energy price growth Energy price growth Energy access (SDG7)Maximumdecadal growth reduction Consumption growth reduction Economic growth (SDG8.1)Idle coal capacity per year Stranded fossil investment Full employment (SDG8.3)Maximumdecadal PV andWind upscaling Wind&PV grid integration Resilient infrastructure (SDG9)Cumulative global oil trade, cumulative oil extraction,
fuel diversity of transport sector
Oil insecurity, transport sector
reliance on oil
Ensure energy securitya
Nuclear capacity expansion inNewcomersb Nuclear proliferation Peaceful use of nuclear power
Cumulative CO2 emissions untilmid-century Peak atmospheric CO2 concentration Minimize ocean acidification
(SDG14.3)CO2 captured and stored per year Environmental risks of CCS Sustainable production (SDG12.4)
a Due to the focus on global risks, the analysis is limited to oil security—the fuel with the highest scarcity concerns and high import
dependence inmost countries, lacking substitutes in transport (see SI section 3.1.7).b We designed a new indicator that can draw on existingmodel variables (see SI section 3.2).
4
Environ. Res. Lett. 11 (2016) 034022

optimal 2 °C pathways (UNFCCC 2015b) and thestandard assumption of full technological flexibility isinhibited as significant upscaling of low-carbon tech-nologies facesmany different hurdles in practice8. Ouranalysis here focuses on the first half of the 21stcentury in which the interaction of short-term climatepolicies and the long-term climate target is strongest(Kriegler et al 2013, Luderer et al 2013a, 2013b, Riahiet al 2015, Eom et al 2015, Bertram et al 2015a).
3.1. Synergies acrossmitigation and sustainableenergy objectivesFigure 1 uses cumulative indicators for (i) CO2
emissions (Zickfeld et al 2012), (ii) the co-emitted airpollutants black carbon (BC) and sulphur dioxide(SO2) and (iii) global oil extraction and trade as well astransport sector reliance on oil to present reduced SDrisks, i.e. co-benefits ofmitigation scenarios comparedto baseline developments. Figure 1 shows that co-benefits in terms of lower ocean acidification, healthand oil security increase relative to optimal 2 °Cpathways by limiting the availability of key mitigationtechnologies, though considerable differences exist fordifferent technologies and different sustainable energyobjectives. This is for threemain reasons:
(i) The unavailability of low-carbon technologieslimits long-term mitigation potential, resultingin greater near-term emissions reduction
requirements to meet a particular long-termclimate goal. This leads to a decrease in fossil fueluse in the medium term (with lower cumulativeglobal oil trade, oil extraction as well as transportsector reliance on oil) and the associated CO2
emissions and co-emitted air pollutants. Limitingtechnologies that play a smaller role in reachingthe long-term goal results in less dramatic trans-ition requirements and fewer additional co-benefits.
(ii) When relying less on bioenergy and/or CO2
capture and storage (CCS) technologies, themodels are forced to switch more rapidly fromfossil fuels to solar, wind and nuclear energy,which have higher co-benefits for air quality andoil security (Bruckner et al 2014, Hertwichet al 2015).
(iii) Limiting the deployment of bioenergy or CCStechnologies that are associated with co-emittedair pollutants themselves (see SI section 3.1.9)additionally reduces air pollutant emission levels—which is not the case for limiting the avail-ability of non-combustible RE or new nuclearcapacity.
Admittedly, these results only cover a small subsetof potential co-benefits frommitigation. However, theliterature suggests that this finding may apply morebroadly (see von Stechow et al 2015 for a review andsynthesis): climate policy that leads to less fossil fueluse and energy demand growth in the near term drivesa broad range of co-benefits beyond air quality and oilsecurity, such as reduced water use and pollution,reduced ecosystem impacts, reduced health impacts(also due to more physical activity under changedmobility patterns and less fuel poverty in insulatedhousing) as well as more local employmentopportunities.
Table 3.Naming of AMPEREmitigation scenarios (see table S3 andRiahi et al 2015 for details).
Model constraints Description Scenario name
Short-term targets (2030)
Optimal policy Emissions follow optimal 2 °Cpathway ‘OPT’
Low short-term target High-ambition pathway (low short-term target): 53GtCO2eq ‘LST’
High short-term target Low-ambition pathway (high short-term target): 61GtCO2eq ‘HST’
Technology cases
Full portfolio of technologies Full portfolio ofmitigation technologies ‘Full-Tech’
Low energy intensitya Energy intensity improvements rate doubles ‘LowEI’
Limited biomass Limited global potential for bioenergy (<100 EJ/yr) ‘LimBio’
NoCCS available CO2 capture and storage never becomes available ‘NoCCS’
Limited solar/wind potential Limited potential (<20%of regional electricity supply) ‘LimSW’
Nonewnuclear plants No newnuclear capacity is added; older plants are retired ‘NucOff’
a LowEI scenarios assume lower final energy demand due to improvements in energy efficiency and behavioral changes so that equivalent
levels of overall energy service are supplied with lower final energy. Due to the limited representation of end-use technologies in some
models,manymodels represent this in a stylizedway.
8For example, CCS technology demonstration lags behind early
IEA technology roadmaps (IEA 2009); nuclear power plant invest-ments face high public acceptance challenges and even renewableenergy (RE) investments are often opposed (Bruckner et al 2014).Unforeseen events or accidents (e.g., Fukushima) change riskperceptions of technologies (Rogers 1997, Patt and Weber 2014)making the analysis of limited mitigation technology portfoliosinteresting and relevant. To avoid unavailability of specific technol-ogies, complementary technology policies (Somanathan et al 2014)could reduce additional costs (Kalkuhl et al 2013, Bertramet al 2015b) and ensure innovation activity, such as for CCS (vonStechow et al 2011) or PV (Peters et al 2012).
5
Environ. Res. Lett. 11 (2016) 034022

Comparing optimal 2 °C pathways with scenariosassuming weak short-term climate policies confirmsthe positive effect of stringent mitigation in the nearterm on themagnitude of co-benefits (see figure S5 forthe year 2030): weak short-term climate policies implya reduction in co-benefits relative to those that couldmaterialize in optimal 2 °C pathways. This effect is,however, not as obvious for cumulative 2050 values(see figure 1) because some of the additional mitiga-tion efforts in the period 2030–2050 partially compen-sate for weak climate policies until 2030. Since thetransport sector is characterized by faster capital turn-over rates (at least with regard to the vehicle fleet) (Ber-tram et al 2015a), it can react more quickly to carbonprice changes, compensating for higher emissionsfrom sectors that are less flexible. This may lead, forexample, to a higher fuel diversity in the transport sec-tor in the year 2050 in delayed mitigation scenarioscompared to optimal 2 °C pathways albeit at highuncertainty.
3.2. Trade-offs betweenmitigation and sustainableenergy objectivesWhile constraining a particular mitigation technologymay minimize the mitigation risks specific to thattechnology, it usually implies an increase in thedeployment of other low-carbon technologies, which
may incur other mitigation risks. Figure 2 shows thatlimiting the availability of specific technologies in 2 °Cpathways with immediate global climate policiessubstantially increases the risk of not meeting othersustainable energy objectives. While the unavailabilityof CCS and limitation of bioenergy potential lead tothe largest co-benefits (see figure 1), they also entailsignificantly higher SD risks. This can be explained bythe promise of greaterflexibility in near-term emissionpathways that are still able to meet the long-termclimate goal through the presence of carbon dioxideremoval technologies, such as bioenergy with CCS(BECCS). Constraining BECCS deployment by limit-ing the global bioenergy potential or ruling out CCSdeployment results in substantially higher deploymentof other mitigation technologies in the medium term.The increase is much less pronounced for limiting thepotential for solar and wind energy or assuming nonewnuclear capacity (see figure S6).
Due to the different nature of the mitigation risks,it is unclear how decreasing risks in one dimension(e.g. bioenergy expansion or environmental risks asso-ciated with CCS deployment), can be traded off withrisk increases in others (e.g. transitional growth reduc-tion, energy price growth, nuclear proliferation or thetechnological challenges of integrating high amountsof fluctuating RE into existing power grids in a very
Figure 1.Percentage changes in indicators for co-benefits for reduced ocean acidification, air quality, oil security, and transport sectorfuel diversity in alternative 2 °Cpathways for four integratedmodels (GCAM,MESSAGE, POLES, REMIND) relative to baselinescenarios, comparing immediatemitigation scenarios assuming full availability ofmitigation technologies (grey)with delayedmitigation scenarios (pink) and immediatemitigation scenarios assuming no newnuclear capacity (red), limited potential for solarandwind energy (yellow) limited global bioenergy potential (green) or unavailability of CCS (purple). The thick black lines show themedian of results, the coloured ranges show the interquartile ranges andwhiskers show theminimumandmaximumresults.
6
Environ. Res. Lett. 11 (2016) 034022

short time frame). For example, a 20%–30% increasein energy prices may have a much more immediate,adverse effect on the poor in many countries than a4-7-fold increase in maximum decadal upscaling ofvariable renewable energy sources, which is primarilya technological and institutional challenge for infra-structure provision. Rather than aggregating effectsacross different risk dimensions, the purpose of thisanalysis is to make the trade-offs across alternativeclusters of mitigation pathways transparent. Hence,the way the climate SDG is met can substantially alterthe risks of not meeting other SDGs and sustainableenergy objectives.
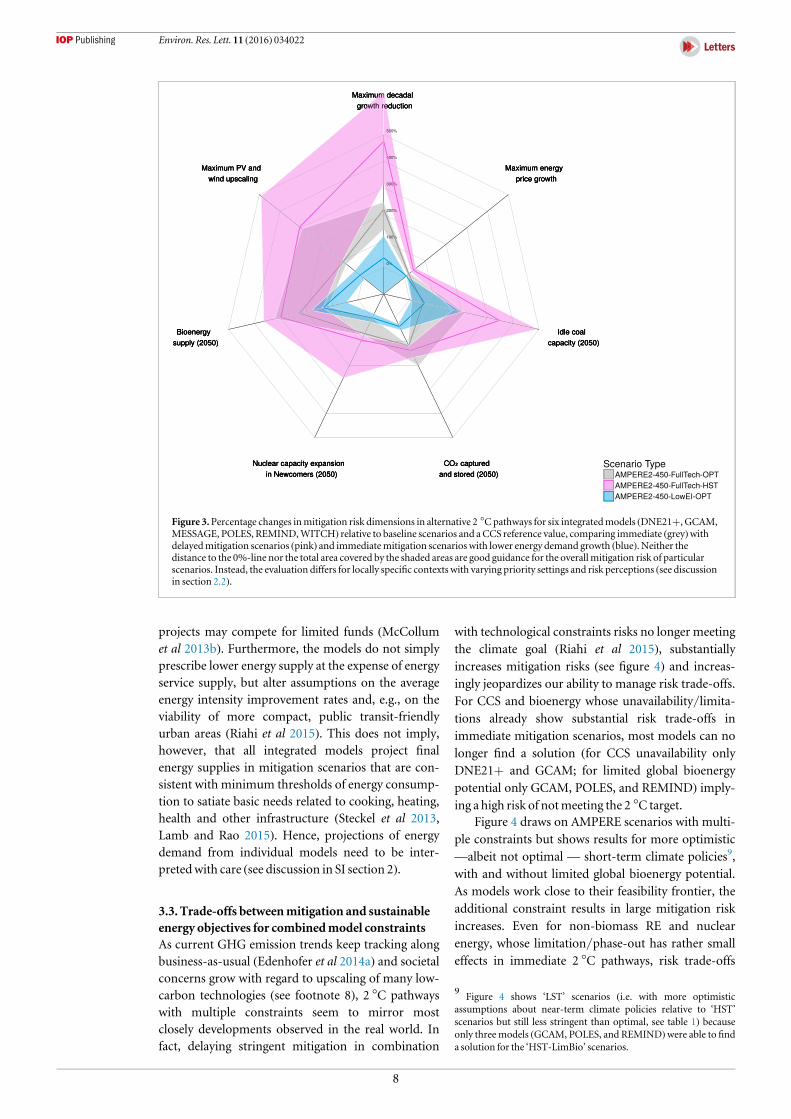
This is confirmed by figure 3: delaying stringentmitigation in the near term leads to a significantincrease in mitigation risk levels in the medium termcompared to optimal 2 °C pathways. With more GHGemissions before 2030, subsequent reductions aremore expensive (Luderer et al 2013b) and need to befaster to stay below 2 °C (Eom et al 2015)—with impli-cations for the grid integration of fluctuating RE (seeSI section 3.1.6) and for stranded investments in coalcapacity (Johnson et al 2015) and the associated joblosses (Rozenberg et al 2014). The carbon lock-ineffect hence manifests itself particularly in
technological and economic risk dimensions. To a les-ser degree, these effects can also be seen for delayedmitigation scenarios with more optimistic assump-tions about short-term climate policies (see figure S7).Hence, delaying stringent mitigation implies forgoingpotential paths with lower risks along multiple SDdimensions.
In contrast, assuming lower energy demandgrowth entails mitigation risk reductions relative tooptimal 2 °C pathways (see figure 3). As each unit ofenergy not produced is free of pervasive supply-siderisks, reducing energy demand by promoting energyefficiency in end-use sectors (e.g., consumer appli-ances), lifestyle changes (e.g., people living in higher-density areas and eating less dairy andmeat) and struc-tural changes in the economy (e.g., shifting to moreservice-oriented economies) is an important strategyboth for mitigation and other sustainable energyobjectives (von Stechow et al 2015).
Note that these reductions in energy demandgrowth are assumed to happen in the baseline scenar-ios, i.e. independent of the mitigation efforts andhence without a cost mark-up; it is unclear how futureenergy demand levels would develop under real-worldconditions where clean energy and energy efficiency
Figure 2.Percentage changes inmitigation risk dimensions in alternative 2 °Cpathways for three integratedmodels (GCAM,MESSAGE, REMIND) relative to baseline scenarios and aCCS reference value, comparing immediatemitigation scenarios assumingfull availability ofmitigation technologies (grey), with scenarios assuming limited global bioenergy potential (green) and unavailabilityof CCS (purple). Thick coloured lines showmedian results; coloured ranges show interquartile ranges. Neither the distance to the 0%-line nor the total area covered by the shaded areas are good guidance for the overallmitigation risk of particular scenarios. Instead, theevaluation differs for locally specific contexts with varying priority settings and risk perceptions (see discussion in section 2.2).
7
Environ. Res. Lett. 11 (2016) 034022
projects may compete for limited funds (McCollumet al 2013b). Furthermore, the models do not simplyprescribe lower energy supply at the expense of energyservice supply, but alter assumptions on the averageenergy intensity improvement rates and, e.g., on theviability of more compact, public transit-friendlyurban areas (Riahi et al 2015). This does not imply,however, that all integrated models project finalenergy supplies in mitigation scenarios that are con-sistent with minimum thresholds of energy consump-tion to satiate basic needs related to cooking, heating,health and other infrastructure (Steckel et al 2013,Lamb and Rao 2015). Hence, projections of energydemand from individual models need to be inter-pretedwith care (see discussion in SI section 2).
3.3. Trade-offs betweenmitigation and sustainableenergy objectives for combinedmodel constraintsAs current GHG emission trends keep tracking alongbusiness-as-usual (Edenhofer et al 2014a) and societalconcerns grow with regard to upscaling of many low-carbon technologies (see footnote 8), 2 °C pathwayswith multiple constraints seem to mirror mostclosely developments observed in the real world. Infact, delaying stringent mitigation in combination
with technological constraints risks no longer meetingthe climate goal (Riahi et al 2015), substantiallyincreases mitigation risks (see figure 4) and increas-ingly jeopardizes our ability to manage risk trade-offs.For CCS and bioenergy whose unavailability/limita-tions already show substantial risk trade-offs inimmediate mitigation scenarios, most models can nolonger find a solution (for CCS unavailability onlyDNE21+ and GCAM; for limited global bioenergypotential only GCAM, POLES, and REMIND) imply-ing a high risk of notmeeting the 2 °C target.
Figure 4 draws on AMPERE scenarios with multi-ple constraints but shows results for more optimistic—albeit not optimal — short-term climate policies9,with and without limited global bioenergy potential.As models work close to their feasibility frontier, theadditional constraint results in large mitigation riskincreases. Even for non-biomass RE and nuclearenergy, whose limitation/phase-out has rather smalleffects in immediate 2 °C pathways, risk trade-offs
Figure 3.Percentage changes inmitigation risk dimensions in alternative 2 °Cpathways for six integratedmodels (DNE21+, GCAM,MESSAGE, POLES, REMIND,WITCH) relative to baseline scenarios and aCCS reference value, comparing immediate (grey)withdelayedmitigation scenarios (pink) and immediatemitigation scenarios with lower energy demand growth (blue). Neither thedistance to the 0%-line nor the total area covered by the shaded areas are good guidance for the overallmitigation risk of particularscenarios. Instead, the evaluation differs for locally specific contexts with varying priority settings and risk perceptions (see discussionin section 2.2).
9Figure 4 shows ‘LST’ scenarios (i.e. with more optimistic
assumptions about near-term climate policies relative to ‘HST’scenarios but still less stringent than optimal, see table 1) becauseonly threemodels (GCAM, POLES, and REMIND)were able to finda solution for the ‘HST-LimBio’ scenarios.
8
Environ. Res. Lett. 11 (2016) 034022
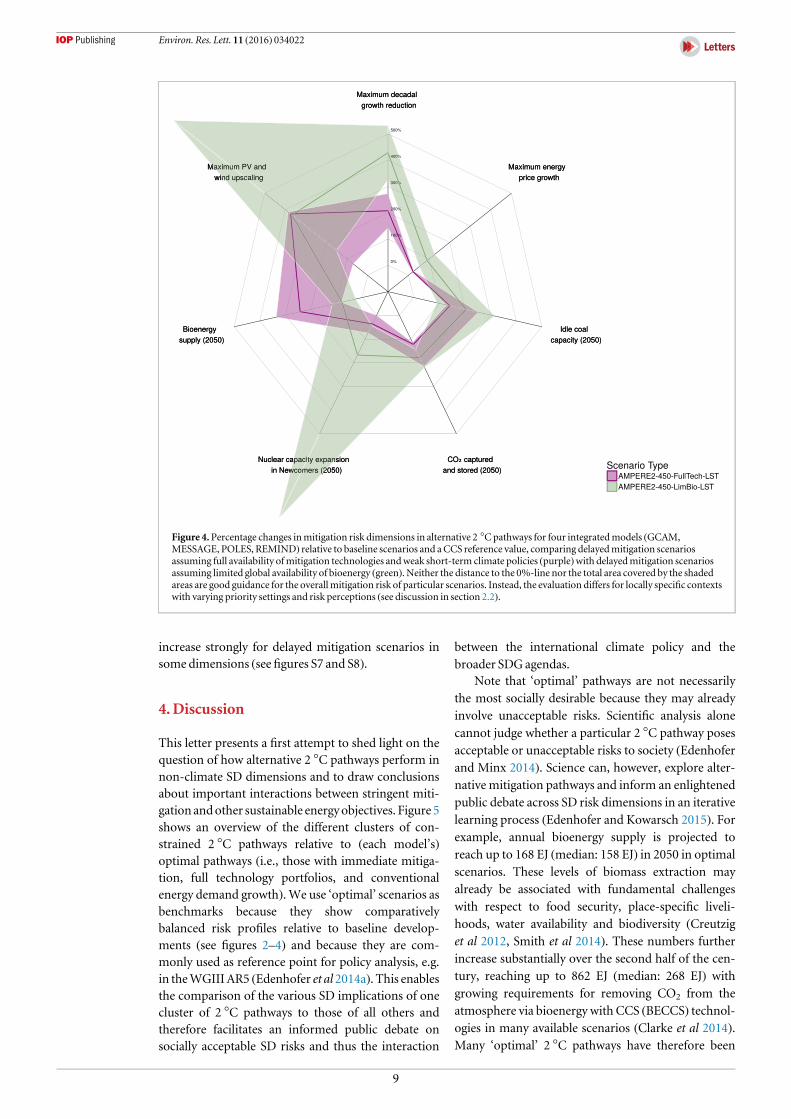
increase strongly for delayed mitigation scenarios insome dimensions (see figures S7 and S8).
4.Discussion
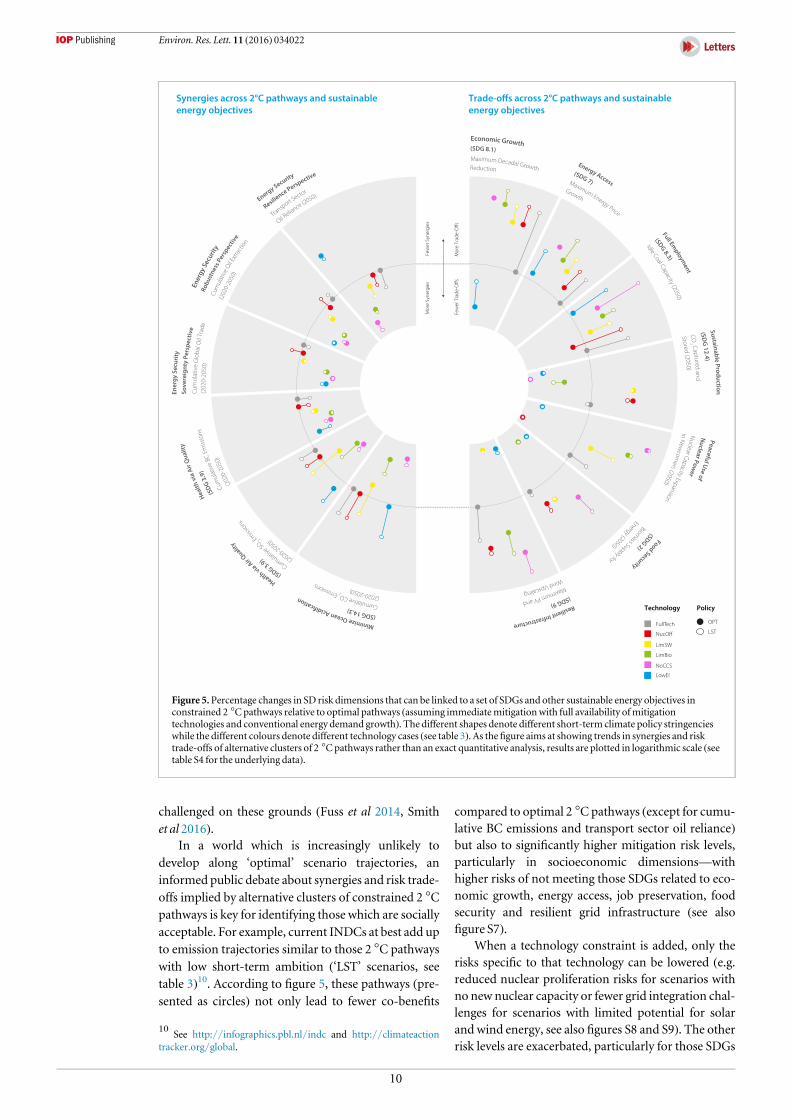
This letter presents a first attempt to shed light on thequestion of how alternative 2 °C pathways perform innon-climate SD dimensions and to draw conclusionsabout important interactions between stringent miti-gation andother sustainable energyobjectives. Figure 5shows an overview of the different clusters of con-strained 2 °C pathways relative to (each model’s)optimal pathways (i.e., those with immediate mitiga-tion, full technology portfolios, and conventionalenergy demand growth). We use ‘optimal’ scenarios asbenchmarks because they show comparativelybalanced risk profiles relative to baseline develop-ments (see figures 2–4) and because they are com-monly used as reference point for policy analysis, e.g.in theWGIIIAR5 (Edenhofer et al 2014a). This enablesthe comparison of the various SD implications of onecluster of 2 °C pathways to those of all others andtherefore facilitates an informed public debate onsocially acceptable SD risks and thus the interaction
between the international climate policy and thebroader SDG agendas.
Note that ‘optimal’ pathways are not necessarilythe most socially desirable because they may alreadyinvolve unacceptable risks. Scientific analysis alonecannot judge whether a particular 2 °C pathway posesacceptable or unacceptable risks to society (Edenhoferand Minx 2014). Science can, however, explore alter-native mitigation pathways and inform an enlightenedpublic debate across SD risk dimensions in an iterativelearning process (Edenhofer and Kowarsch 2015). Forexample, annual bioenergy supply is projected toreach up to 168 EJ (median: 158 EJ) in 2050 in optimalscenarios. These levels of biomass extraction mayalready be associated with fundamental challengeswith respect to food security, place-specific liveli-hoods, water availability and biodiversity (Creutziget al 2012, Smith et al 2014). These numbers furtherincrease substantially over the second half of the cen-tury, reaching up to 862 EJ (median: 268 EJ) withgrowing requirements for removing CO2 from theatmosphere via bioenergy with CCS (BECCS) technol-ogies in many available scenarios (Clarke et al 2014).Many ‘optimal’ 2 °C pathways have therefore been
Figure 4.Percentage changes inmitigation risk dimensions in alternative 2 °Cpathways for four integratedmodels (GCAM,MESSAGE, POLES, REMIND) relative to baseline scenarios and aCCS reference value, comparing delayedmitigation scenariosassuming full availability ofmitigation technologies andweak short-term climate policies (purple)with delayedmitigation scenariosassuming limited global availability of bioenergy (green). Neither the distance to the 0%-line nor the total area covered by the shadedareas are good guidance for the overallmitigation risk of particular scenarios. Instead, the evaluation differs for locally specific contextswith varying priority settings and risk perceptions (see discussion in section 2.2).
9
Environ. Res. Lett. 11 (2016) 034022
challenged on these grounds (Fuss et al 2014, Smithet al 2016).
In a world which is increasingly unlikely todevelop along ‘optimal’ scenario trajectories, aninformed public debate about synergies and risk trade-offs implied by alternative clusters of constrained 2 °Cpathways is key for identifying those which are sociallyacceptable. For example, current INDCs at best add upto emission trajectories similar to those 2 °C pathwayswith low short-term ambition (‘LST’ scenarios, seetable 3)10. According to figure 5, these pathways (pre-sented as circles) not only lead to fewer co-benefits
compared to optimal 2 °Cpathways (except for cumu-lative BC emissions and transport sector oil reliance)but also to significantly higher mitigation risk levels,particularly in socioeconomic dimensions—withhigher risks of not meeting those SDGs related to eco-nomic growth, energy access, job preservation, foodsecurity and resilient grid infrastructure (see alsofigure S7).
When a technology constraint is added, only therisks specific to that technology can be lowered (e.g.reduced nuclear proliferation risks for scenarios withno new nuclear capacity or fewer grid integration chal-lenges for scenarios with limited potential for solarand wind energy, see also figures S8 and S9). The otherrisk levels are exacerbated, particularly for those SDGs
Figure 5.Percentage changes in SD risk dimensions that can be linked to a set of SDGs and other sustainable energy objectives inconstrained 2 °Cpathways relative to optimal pathways (assuming immediatemitigationwith full availability ofmitigationtechnologies and conventional energy demand growth). The different shapes denote different short-term climate policy stringencieswhile the different colours denote different technology cases (see table 3). As thefigure aims at showing trends in synergies and risktrade-offs of alternative clusters of 2 °Cpathways rather than an exact quantitative analysis, results are plotted in logarithmic scale (seetable S4 for the underlying data).
10See http://infographics.pbl.nl/indc and http://climateaction
tracker.org/global.
10
Environ. Res. Lett. 11 (2016) 034022
that relate to economic growth, job preservation, resi-lient infrastructure, and ocean acidification. This isparticularly obvious for scenarios with limited globalpotential of bioenergy in which the risks related tobioenergy expansion are lower (including environ-mental effects related to BECCS deployment) but therisks of not meeting socioeconomic SDGs are sig-nificantly higher (see green circles in figure 5). Limit-ing the global use of bioenergy to 100 EJ per year by2050—widely believed to be more sustainable (Creut-zig et al 2014)—hence introduces a trade-off withsocioeconomic objectives for weak short-term climatepolicies (see green circles infigure 5).
While there are uncertainties around acceptablelevels of bioenergy deployment, the development anddeployment of CCS technology is lagging behindexpectations (IEA 2009), despite its important role inkeeping mitigation costs at relatively low levels (Eden-hofer et al 2014a). Our results highlight two things:first, thosemodels that are flexible enough to compen-sate for the unavailability of CCS can only do so withincreased upscaling requirements for other low-car-bon technologies and related SD risks (see pink circlesin figure 5). This also implies high near-term mitiga-tion requirements with associated co-benefits. Sec-ond, the absence of CCS seriously questions theachievability of the 2 °C target in a world with delayedclimate action and therefore threatens the climateSDG itself—only twomodels can report results for thecombinationwithweak short-term climate policies.
In contrast, 2 °C pathways with lower energydemand growth generally entail a substantial reduc-tion in SD risk levels (blue shapes in figure 5). Thisconfirms results from a bottom-up assessment of thewider SD implications of technology-specific studiesfrom a cross-sectoral perspective (von Stechowet al 2015). While these scenarios typically do not fea-ture many additional co-benefits due to lower supply-side transition requirements, achieving lower energydemand growth has considerable synergies with theSDG agenda related to economic growth, food secur-ity, resilient grid infrastructure as well as with thepeaceful use of nuclear energy. Delaying mitigation inscenarios with low energy demand growth only entailsmoderate risk increases—although some co-benefitsare reduced and more coal capacity is likely to beretired early. Pursuing aggressive energy efficiencyimprovements across all sectors and rethinking high-energy lifestyles therefore seems essential to increasesynergies and keep the trade-offs across SDGs man-ageable in a world that is characterized by multipleconstraints. Unfortunately, model inter-comparisonprojects have not yet analyzed the combination oftechnology constraints and low energy demandgrowth pathways, which is a promising research areato better understand synergies between SDGs. Futureresearch should also ensure that mitigation scenariosare consistent with minimum thresholds of energy
demand necessary to satiate basic human needs (seediscussion in SI section 2).
This letter has analyzed the changes in SD risksacross alternative 2 °C pathways. These effects dependto a great extent on the development context, i.e.,assumptions about baseline developments (Mosset al 2010, O’Neill et al 2014). To circumvent thispotential caveat, the analysis used AMPERE data thatstands out in its comprehensive effort to harmonizefuture socio-economic drivers of SD across models inthe baseline scenarios: e.g., regional-level grossdomestic product (GDP), population, and energydemand growth. Thismakes the results more compar-able across models but begs the question of how theresults would have changed for alternative assump-tions beyond changes in energy demand growth.Research can and should build on alternative baselinedevelopments as expressed by the ‘shared socio-economic pathways’ (O’Neill et al 2014) that will soonbe published even though important, non-trivial dis-cussions remain on how SDGs can be adequately builtinto these baselines (O’Neill et al 2015).
Indicators that were used to track the changes inSD risks are only rough and sometimes very roughapproximations of individual SDGs. There is no doubtthat individual models—particularly those coupled toa detailed agro-economic and land-use model—couldalready provide better indicators, such as for wateravailability and ecosystem impacts which are impor-tant concerns in stringent mitigation pathways (see SIsection 3.1.1). However, these have not yet been ana-lyzed in a multi-model study (von Stechow et al 2015).We believe that such inter-model comparison resultsare crucial for a meaningful public debate about SDrisks.
Another important caveat of the analysis is that wefocus on 2050 and the preceding decades when look-ing at the implications of alternative 2 °C pathways forSD risk dimensions. The risks of some 2 °C pathways,however, only unfold later in that century when someparticularly risky negative emissions technologies,such as BECCS, are being deployed at large scale tocompensate for lower mitigation efforts in the firstdecades and residual GHG emissions in other sectors(Fuss et al 2014, Smith et al 2016). For illustrative pur-poses, figures S10 and S11 show how mitigation riskschange from 2050 to 2080 for scenarios with sub-stantially different amounts of negative emissionrequirements. Since the AMPERE scenario specifica-tions do not allow for ameaningful comparison acrossscenarios with low or high amounts of negative emis-sions, we use the amount of radiative forcing over-shoot to cluster scenarios with respect to theirdependence on negative emissions (also used in theWGIII AR5 scenario database, see Krey et al 2014). Itshows that the magnitude of the mitigation risk levelscan change substantially over time for those dimen-sions that are related to negative emission technologiessuch asCCS and bioenergy deployment.
11
Environ. Res. Lett. 11 (2016) 034022
Our analysis points to important future chal-lenges: first, the chosen indicators do not represent allSDGs as some touch on socio-cultural and institu-tional aspects which are challenging—if not impos-sible—to represent in an economic model framework(see SI section 2). Second, the changes in the indicatorsacross scenarios aremerely indicative for the change inrisks to meet the related SDGs and sustainable energyobjectives because there are many more relevant dri-vers that cannot be analyzed based on the available sce-nario data. Third, many relevant issues play out atlower geographic and time scales which are difficult torepresent adequately in global-scale integrated mod-els. For example, food security is driven by manysocioeconomic drivers both on global and local scalesand bioenergy expansion represents but one of those(Tscharntke et al 2012). And according to Creutziget al (2012), the models are not (yet) suitable for oper-ationalizing important global SD dimensions of bioe-nergy supply such as the socioeconomic convergenceacross different countries. Nevertheless, we argue thatthe indicators used in this letter are relevant for evalu-ating additional pressure on the energy-economy-cli-mate system from additional constraints asrepresented in the models. As such, they supplyimportant information from internally consistentmodel frameworks taking into account inter-sectoraland inter-regional interactions (von Stechowet al 2015 and SI section 1).
We provide this early contribution to a publicdebate on the relationship between the internationalclimate policy and the SDG agendas based on existingmulti-model scenario data that was not specificallydeveloped for this particular purpose. This stimulusseems important because results from model inter-comparisons that are tailored towards the SDG-cli-mate nexus will not be published for some years. Onlybyworkingwith the available data canwe start discuss-ing relevant (risk) trade-offs and synergies. Based onour analysis, we argue that SD considerations are cen-tral for determining socially acceptable climate poli-cies and that the prospects of meeting other SDGsneed not dwindle and can even be enhanced for somegoals if appropriate climate policy choices are made.Moreover, experiences and caveats of this analysis canhelp guide future research efforts at a relevantmomentin time when new model comparison exercises arebeing designed. For example, to remain policy-rele-vant, SDG-focused multi-model comparisons willneed to address inequality, poverty, and basic humanneeds as major drivers of the policy process muchmore adequately. This requires a serious discussion,e.g., on how to deal with the coarse regional dis-aggregation in the integrated modelling frameworks.Equally, successful efforts to address SDG-relevantissues in onemodel, e.g., for the analysis of water avail-ability or ecosystem impacts (see SI section 2), willneed to be lifted into amulti-model context.
5. Conclusion
Until now, no multi-model study has been used tosystematically analyze the changes in SD risks impliedby stringent mitigation scenarios and evaluate themacross a set of SDGs. This letter addresses this researchgap by analyzing a comprehensive set of alternativeclusters of 2 °C pathways consistently formulatedacross many integrated models from the AMPEREmodel inter-comparison study, drawing on publiclyavailable scenario results to calculate indicators forglobal SD risks. We shed light on the implications ofalternative clusters of 2 °C pathways for meeting a setof energy-related SDGs and other sustainable energyobjectives and to inform the public debate about thesynergies and trade-offs across the international cli-mate policy and the SDGagendas.
Our analysis shows that the near-term choice of2 °Cpathways has implications for the extent of syner-gies and trade-offs across energy-related SDGs in themedium term. Given current trends in emissions andtechnology deployment, we argue that mitigationpathways are likely to be characterized by multipleconstraints. But adding limits on the availability ofspecific mitigation technologies on top of weak short-term climate policies decreases synergies and locks insubstantial trade-offs across environmental and socio-economic objectives. From an SDG perspective, thechallenges of meeting other sustainable energy objec-tives substantially change with the way the climateSDG will be met. In some cases, meeting the 2 °C tar-get is even threatened itself. Achieving low-energydemand growth, e.g., through aggressive energy effi-ciency improvements, helps to manage these trade-offs and attain multiple energy-related SDGs together.We find the greater the constraints on flexibility inmeeting the 2 °C target, the higher the risks of notmeeting other SDGs and the flexibility to managethese risks. Governments at all levels need to beinformed about such implications of their collectivedecision for the attainability of global SDGs. Thiscould avoid additional pressures on the sustainabilityof each region’s development pathway.
After COP21, decision makers need to rethinktheir commitment to the SDG agenda, given that theshort-term ambition for mitigation action falls shortof the mitigation efforts consistent with staying below2 °C in a cost-effective way. According to our results,this is likely to decrease co-benefits and increase therisks for attaining energy-related SDGs and other sus-tainable energy objectives. Since many of these SDrisks are best dealt with at the global level, however,theymight be good entry points into additional incen-tives for international cooperation. We suggest thatthe review of INDCs should provide for an assessmentof policies at all scales to monitor global risks for non-climate sustainability objectives that arise from spe-cific global mitigation pathways. Monitoring theserisks could avoid unintended consequences (which
12
Environ. Res. Lett. 11 (2016) 034022

might even delegitimize the 2 °C target), finding newentry points for global cooperation and providingrationales for ramping up mitigation ambition in theshort tomedium term.
Future research should extend the current systemboundaries and, based on a comprehensive review ofmodel literature on the climate-SDG nexus, establishindicators that help evaluate integrated policiesaddressing multiple SDGs in a unified framework.This would be a prerequisite for model inter-compar-ison projects with a focus on the interactions acrossmultiple SDGs that could result in meaningful androbust results for better decisionmaking. Climate pol-icy will not be successful unless it seriously considersother policy objectives and therefore wider SD impli-cations. Dividing the huge effort of achieving moresustainable development pathways into isolated policyproblems will fall short of reaping synergies and suc-cessfullymanaging trade-offs across themany SDGs.
Acknowledgments
We are grateful to Ad-Willem Dashorst, MichaelJakob, Jan C Steckel, Nils Johnson, and Felix Creutzigfor helpful comments on earlier versions of thismanuscript. We acknowledge the work by integratedmodel teams that contributed to the AMPERE sce-nario database and thank IIASA for hosting theAMPERE scenario database. The AMPERE scenariowork received funding from the European Union’sSeventh Framework Programme (FP7/2007–2014)under grant agreement No. 265 139 (AMPERE). Theresearch leading to this publication was supported bythe German Federal Environment Agency (UBA)under UFOPLAN FKZ 3714 411 670 as well as theEuropeanUnion’s Horizon 2020 research and innova-tion programme under grant agreement No. 642 147(CD-LINKS).
References
AboumahboubT, LudererG, Kriegler E, LeimbachM, BauerN,PehlM andBaumstark L 2014On the regional distribution ofclimatemitigation costs: the impact of delayed cooperativeactionClim. Change Econ. 05 1440002
Arnell NW, vanVuurenDP and IsaacM2011The implications ofclimate policy for the impacts of climate change on globalwater resourcesGlobal Environmental Change 21 592–603
BauerN,Mouratiadou I, Luderer G, Baumstark L, BrechaR J,EdenhoferO andKriegler E 2013Global fossil energymarketsand climate changemitigation—an analysis withREMINDClim. Change 1–14
BertramC, JohnsonN, Luderer G, Riahi K, IsaacMandEom J 2015aCarbon lock-in through capital stock inertia associatedwithweak near-term climate policiesTechnol. Forecast. Soc.ChangeA 90 62–72
BertramC, LudererG, Pietzcker RC, Schmid E, Kriegler E andEdenhoferO 2015bComplementing carbon prices withtechnology policies to keep climate targets within reachNat.Clim. Change 5 235–9
BonschM et al 2016Trade-offs between land andwaterrequirements for large-scale bioenergy productionGlob.Change Biol. Bioenergy 8 11–24
vonBraun J et al 2008High Food Prices: TheWhat,Who, andHow ofProposed Policy Actions (Washington, DC: International FoodPolicy Research Institute)
Bruckner T et al 2014 Energy systemsClimate Change 2014:Mitigation of Climate Change. Contribution ofWorkingGroupIII to the Fifth Assessment Report of the IntergovernmentalPanel on Climate Change edOREdenhofer et al (Cambridge:CambridgeUniversity Press) pp 511–97
CalvinK,WiseM,Kyle P, Patel P, Clarke L and Edmonds J 2014Trade-offs of different land and bioenergy policies on thepath to achieving climate targetsClim. Change 123 691–704
CherpA, Jewell J, VinichenkoV, BauerN andCian ED2013Globalenergy security under different climate policies, GDP growthrates and fossil resource availabilitiesClim. Change 1–12
Clarke L et al 2014Assessing transformation pathwaysClimateChange 2014:Mitigation of Climate Change. Contribution ofWorkingGroup III to the Fifth Assessment Report of theIntergovernmental Panel on Climate Change edOREdenhoferet al (Cambridge: CambridgeUniversity Press) pp 413–506
Creutzig F et al 2014 Bioenergy and climate changemitigation: anassessmentGCBBioenergy 7 916–44
Creutzig F, von StechowC, KleinD,Hunsberger C, BauerN,PoppA and EdenhoferO 2012Can bioenergy assessmentsdeliver?Economics of Energy&Environmental Policy 1 65–82
DaioglouV, vanRuijven B J and vanVuurenDP 2012Modelprojections for household energy use in developing countriesEnergy 37 601–15
De Fraiture C,GiordanoMand Liao Y 2008 Biofuels andimplications for agricultural water use: blue impacts of greenenergyWater Policy 10 67–81
den ElzenMG J, Lucas P L and vanVuurenDP 2008Regionalabatement action and costs under allocation schemes foremission allowances for achieving lowCO2-equivalentconcentrationsClim. Change 90 243–68
Drouet L, Bosetti V andTavoniM2015 Selection of climate policiesunder the uncertainties in thefifth assessment report of theIPCCNat. Clim. Change 5 937–40
EdenhoferO andKowarschM2015Cartography of pathways: a newmodel for environmental policy assessments Environ. Sci.Policy 51 56–64
EdenhoferO andMinx J 2014Mapmakers and navigators, facts andvalues Science 345 37–8
EdenhoferO et al 2014a Technical summaryClimate Change 2014:Mitigation of Climate Change. Contribution ofWorkingGroupIII to the Fifth Assessment Report of the IntergovernmentalPanel on Climate Change edOREdenhofer et al (Cambridge:CambridgeUniversity Press) pp 31–107
EdenhoferO, Kadner S, von StechowC, Schwerhoff G andLudererG 2014b Linking climate changemitigation researchto sustainable developmentHandbook of SustainableDevelopment 2nd edn edGAtkinson, SDietz,ENeumayer andMAgarwala (Cheltenham,UK: EdwardElgar) pp 476–99
Eom J, Edmonds J, KreyV, JohnsonN, LongdenT, Luderer G,Riahi K andVanVuurenDP 2015The impact of near-termclimate policy choices on technology and emission transitionpathwaysTechnological Forecasting and Social Change 9073–88
FleurbaeyM et al 2014 Sustainable development and equityClimateChange 2014:Mitigation of Climate Change. Contribution ofWorkingGroup III to the Fifth Assessment Report of theIntergovernmental Panel on Climate Change edOREdenhoferet al (Cambridge: CambridgeUniversity Press) pp 283–350
Fuss S et al 2014 Betting on negative emissionsNature Clim. Change4 850–3
GriggsD, Stafford-SmithM,GaffneyO, Rockström J,ÖhmanMC,Shyamsundar P, SteffenW,Glaser G, KanieN andNoble I
13
Environ. Res. Lett. 11 (2016) 034022
2013 Policy: sustainable development goals for people andplanetNature 495 305–7
HejaziM I, Edmonds J, Clarke L, Kyle P, Davies E, Chaturvedi V,Eom J,WiseM, Patel P andCalvin K 2013 Integratedassessment of global water scarcity over the 21st century: 2.Climate changemitigation policiesHydrology and EarthSystem Sciences Discussions 10 3383–425
Hertwich EG,GibonT, BoumanEA,ArvesenA, Suh S,HeathGA,Bergesen JD, Ramirez A, VegaM I and Shi L 2015 Integratedlife-cycle assessment of electricity-supply scenarios confirmsglobal environmental benefit of low-carbon technologiesProc. Natl Acad. Sci. USA 112 6260–4
IEA 2009Technology Roadmap: CarbonCapture and Storage (Paris,France:Organisation for EconomicCo-operation andDevelopment/International Energy Agency (IEA)) (https://iea.org/publications/freepublications/publication/technology-roadmap-carbon-capture-and-storage-2009.html)
JakobMandEdenhoferO 2014Green growth, degrowth, and thecommonsOxford Review of Economic Policy 30 447–68
Jewell J, CherpA andRiahi K 2014 Energy security under de-carbonization scenarios: an assessment framework andevaluation under different technology and policy choicesEnergy Policy 65 743–60
Jewell J, CherpA, VinichenkoV, BauerN, Kober T,McCollumDL,vanVuurenDP and van der ZwaanB 2013 Energy security ofChina, India, the EU and theUS under long-term scenarios:results from six IAMsClim. Change Econ. 4 1340011
JohnsonN,KreyV,McCollumDL, Rao S, Riahi K andRogelj J 2015Stranded on a low-carbon planet: implications of climatepolicy for the phase-out of coal-based power plantsTechnol.Forecast. Soc. ChangeA 90 89–102
Joos F, Fröhlicher T L, SteinacherMand PlattnerG-K 2011 Impactof climate changemitigation on ocean acidificationprojectionsOceanAcidification ed J-PGattuso and LHansson(Oxford:OxfordUniversity Press) pp 272–90
KalkuhlM, EdenhoferO and LessmannK 2013Renewable energysubsidies: Second-best policy or fatal aberration formitigation?Resour. Energy Econ. 35 217–34
KimSH,WadaK,KurosawaA andRobertsM2014Nuclear energyresponse in the EMF27 studyClim. Change 123 443–60
KreyV et al 2014Annex II:metrics &methodologyClimate Change2014:Mitigation of Climate Change. Contribution ofWorkingGroup III to the Fifth Assessment Report of theIntergovernmental Panel on Climate Change edOREdenhoferet al (Cambridge: CambridgeUniversity Press) pp1281–328
KreyV,O’Neill BC, vanRuijven B, Chaturvedi V,DaioglouV,Eom J, Jiang L,Nagai Y, Pachauri S andRenX 2012Urbanand rural energy use and carbon dioxide emissions inAsiaEnergy Economics 34 S272–83
Kriegler E et al 2015Making or breaking climate targets: theAMPERE study on staged accession scenarios for climatepolicyTechnol. Forecast. Soc. ChangeA 90 24–44
Kriegler E et al 2013What does the 2 °C target imply for a globalclimate agreement in 2020? The limits study onDurbanPlatform scenariosClim. Change Econ. 04 1340008
Kriegler E et al 2014The role of technology for achieving climatepolicy objectives: overview of the EMF 27 study on globaltechnology and climate policy strategiesClim. Change 123353–67
KunreutherH et al 2014 Integrated risk and uncertainty assessmentof climate change response policiesClimate Change 2014:Mitigation of Climate Change. Contribution ofWorkingGroupIII to the Fifth Assessment Report of the IntergovernmentalPanel on Climate Change edOREdenhofer et al (Cambridge:CambridgeUniversity Press) pp 151–205
KunreutherH,Heal G, AllenM, EdenhoferO, Field CB andYoheG2013Riskmanagement and climate changeNature Clim.Change 3 447–50
LambWFandRaoND2015Human development in a climate-constrainedworld: what the past says about the futureGlob.Environ. Change 33 14–22
LehtveerM andHedenus F 2015Nuclear power as a climatemitigation strategy—technology and proliferation risk J. RiskRes. 18 273–90
Lotze-CampenH et al 2014 Impacts of increased bioenergy demandon global foodmarkets: anAgMIP economicmodelintercomparisonAgricultural Economics 45 103–16
LudererG, BertramC, CalvinK, Cian ED andKriegler E 2013aImplications of weak near-term climate policies on long-termmitigation pathwaysClim. Change 1–14
LudererG,DeCianE,Hourcade J-C, LeimbachM,WaismanHandEdenhoferO2012On the regional distributionofmitigationcosts in a global cap-and-trade regimeClim.Change 114 59–78
LudererG, Pietzcker RC, BertramC,Kriegler E,MeinshausenMandEdenhoferO 2013b Economicmitigation challenges:How further delay closes the door forachieving climate targets Environ. Res. Lett. 8 034033
McCollumD, BauerN, Calvin K, Kitous A andRiahi K 2014 Fossilresource and energy security dynamics in conventional andcarbon-constrainedworldsClim. Change 123 413–26
McCollumDL, KreyV, Riahi K, Kolp P, Grubler A,MakowskiM andNakicenovicN 2013aClimate policies canhelp resolve energy security and air pollution challengesClim.Change 119 479–94
McCollumD,Nagai Y, Riahi K,Marangoni G, Calvin K, Pietzcker R,vanVliet J and van der Zwaan B 2013b Energy investmentsunder climate policy: a comparison of globalmodelsClim.Change Econ. 04 1340010
Moss RH et al 2010The next generation of scenarios for climatechange research and assessmentNature 463 747–56
O’Neill BC, Kriegler E, Riahi K, Ebi K L,Hallegatte S, Carter TR,Mathur R and vanVuurenDP 2014Anew scenarioframework for climate change research: the concept of sharedsocioeconomic pathwaysClim. Change 122 387–400
O’Neill BC et al 2015The roads ahead: narratives for sharedsocioeconomic pathways describingworld futures in the 21stcenturyGlob. Environ. Change (doi:10.1016/j.gloenvcha.2015.01.004)
Pachauri S, Ruijven B J van, Nagai Y, Riahi K, VuurenDP van,Brew-HammondA andNakicenovicN 2013 Pathways toachieve universal household access tomodern energy by 2030Environ. Res. Lett. 8 024015
Paltsev S andCapros P 2013Cost concepts for climate changemitigationClim. Change Econ. 04 1340003
Patt AG andWeber EU2014 Perceptions and communicationstrategies for themany uncertainties relevant for climatepolicyWIREsClimChange 5 219–32
PBL 2012Roads fromRio+20 Pathways to achieve globalsustainability goals by 2050 (TheHague, TheNetherlands:Netherlands 3 Environmental Assessment Agency (PBL))(http://pbl.nl/en/publications/2012/roads-from-rio20)
PetersM, SchneiderM,Griesshaber T andHoffmannVH2012Theimpact of technology-push and demand-pull policies ontechnical change—does the locus of policiesmatter?ResearchPolicy 41 1296–308
PoppA et al 2014 Land-use transition for bioenergy and climatestabilization:model comparison of drivers, impacts andinteractions with other land use basedmitigation optionsClim. Change 123 495–509
Reilly J,Melillo J, Cai Y, Kicklighter D,Gurgel A, Paltsev S,CroninT, SokolovA and Schlosser A 2012Using land tomitigate climate change: hitting the target, recognizing thetrade-offs Environ. Sci. Technol. 46 5672–9
Riahi K et al 2015 Locked into Copenhagen pledges—implicationsof short-term emission targets for the cost and feasibility oflong-term climate goalsTechnol. Forecast. Soc. ChangeA 908–23
Riahi K et al 2012 Energy pathways for sustainable developmentGlobal Energy Assessment—Toward a Sustainable Future(Cambridge: CambridgeUniversity Press, and Laxenburg,Austria: International Institute for Applied SystemsAnalysis)ch 17, pp 1203–306 (www.globalenergyassessment.org)
Rogelj J, LudererG, Pietzcker RC, Kriegler E, SchaefferM,KreyV andRiahi K 2015Energy system transformations for
14
Environ. Res. Lett. 11 (2016) 034022

limiting end-of-century warming to below 1.5 °CNatureClim. Change 5 519–27
Rogelj J,McCollumDL,O’Neill BC andRiahi K 2013a 2020emissions levels required to limit warming to below 2 °CNature Clim. Change 3 405–12
Rogelj J,McCollumDL, Reisinger A,MeinshausenMandRiahi K2013bProbabilistic cost estimates for climate changemitigationNature 493 79–83
Rogelj J, SchaefferM,MeinshausenM, Shindell DT,HareW,Klimont Z, Velders G JM, AmannMand SchellnhuberH J2014Disentangling the effects of CO2 and short-lived climateforcermitigation Proc. Natl Acad. Sci. USA 111 16325–30
RogersGO1997The dynamics of risk perception: howdoesperceived risk respond to risk events?Risk Anal. 17 745–57
RognerH-H et al 2012Energy Resources and Potentials Global EnergyAssessment—Toward a Sustainable Future (Cambridge:CambridgeUniversity Press, and Laxenburg, Austria:International Institute for Applied Systems) ch 7, pp 423–512(www.globalenergyassessment.org)
Rose SK, Richels R, Smith S, Riahi K, Strefler J and vanVuurenDP2014Non-Kyoto radiative forcing in long-run greenhousegas emissions and climate change scenariosClim. Change 123511–25
Rozenberg J, Vogt-Schilb A andHallegatte S 2014Transition toclean capital, irreversible investment and stranded assetsWorld Bank Policy ResearchWorking Paper 6859 (http://papers.ssrn.com/abstract=2 433 812)
vanRuijven B J, Schers J and vanVuurenDP 2012Model-basedscenarios for rural electrification in developing countriesEnergy 38 386–97
Sathaye J et al 2011Renewable energy in the context of sustainabledevelopment IPCCSpecial Report onRenewable EnergySources andClimate ChangeMitigation edOREdenhofer et al(Cambridge: CambridgeUniversity Press) pp 707–89
Slovic P 1987 Perception of risk Science 236 280–5van SluisveldMAE,Harmsen JHM,BauerN,McCollumDL,
Riahi K, TavoniM,VuurenDP, van,WilsonC andZwaanB van der 2015Comparing future patterns of energysystem change in 2 °C scenarios with historically observedrates of changeGlobal Environmental Change 35 436–49
Smith P et al 2014Agriculture, forestry and other land use (AFOLU)Climate Change 2014:Mitigation of Climate Change.Contribution ofWorkingGroup III to the Fifth AssessmentReport of the Intergovernmental Panel onClimate Change edOREdenhofer et al (Cambridge: CambridgeUniversityPress) pp 811–922
Smith P et al 2016 Biophysical and economic limits to negative CO2
emissionsNature Clim. Change 6 42–50Somanathan E et al 2014National and sub-national policies and
institutionsClimate Change 2014:Mitigation of ClimateChange. Contribution ofWorking Group III to the FifthAssessment Report of the Intergovernmental Panel on ClimateChange edOREdenhofer et al (Cambridge: CambridgeUniversity Press) pp 1141–205
von StechowC et al 2015 Integrating global climate changemitigation goals with other sustainability objectives: asynthesisAnn. Rev. Environ. Res. 40 363–94
von StechowC,Watson J andPraetorius B 2011 Policy incentivesfor carbon capture and storage technologies in Europe: aqualitativemulti-criteria analysisGlob. Environ. Change 21346–57
Steckel J C, BrechaR J, JakobM, Strefler J and LudererG 2013Developmentwithout energy? Assessing future scenarios ofenergy consumption in developing countriesEcologicalEconomics 90 53–67
Strefler J, LudererG, Kriegler E andMeinshausenM2014Can airpollutant controls change global warming? Environ. Sci.Policy 41 33–43
TavoniM et al 2013The distribution of themajor economies’ effortin theDurban Platform scenariosClim. Change Econ. 041340009
TavoniM et al 2015 Post-2020 climate agreements in themajoreconomies assessed in the light of globalmodelsNature Clim.Change 5 119–26
Tscharntke T, CloughY,Wanger TC, Jackson L,Motzke I,Perfecto I, Vandermeer J andWhitbreadA 2012Global foodsecurity, biodiversity conservation and the future ofagricultural intensificationBiological Conservation 151 53–9
UNFCCC2015aAdoption of the Paris Agreement Proposal by thePresident (Paris: UnitedNations FrameworkConvention onClimate Change (UNFCCC)) (http://unfccc.int/documentation/documents/advanced_search/items/6911.php?priref=600008831)
UNFCCC2015b Synthesis report on the aggregate effect of theintended nationally determined contributions. Note by thesecretariat. Report of the AdHocWorkingGroup on theDurban Platform for Enhanced Action (Paris: UnitedNationsFrameworkConvention onClimate Change (UNFCCC))(http://unfccc.int/resource/docs/2015/cop21/eng/07.pdf)
vanVuurenDP et al 2015 Pathways to achieve a set of ambitiousglobal sustainability objectives by 2050: explorations usingthe IMAGE integrated assessmentmodelTechnol. Forecast.Soc. Change 98 303–23
WilsonC,Grubler A, BauerN, KreyV andRiahi K 2013Future capacity growth of energy technologies: arescenarios consistent with historical evidence?Clim. Change118 381–95
WiseM,CalvinK, ThomsonA,Clarke L, Bond-Lamberty B,Sands R, Smith S J, Janetos A and Edmonds J 2009Implications of limiting CO2 concentrations for land use andenergy Science 324 1183–6
WiseM,Dooley J, LuckowP, Calvin K andKyle P 2014Agriculture, land use, energy and carbon emission impacts ofglobal biofuelmandates tomid-centuryAppl. Energy 114763–73
Zickfeld K, AroraVK andGillett N P 2012 Is the climate response toCO2 emissions path dependent?Geophys. Res. Lett. 39 L05703
15
Environ. Res. Lett. 11 (2016) 034022