Embed Size (px)
Citation preview

Building the Professional of 2020: An A h t B i ChApproach to Business Change Process Integration
Change Risk Assessment Model: Results Discussion & AnalysisChange Risk Assessment Model: Results Discussion & Analysis
Harris Apostolopoulos BEng(Hons), MSc, MBA, PhDcCity University London 31 May 2013
CRAM (Change Risk Assessment Model) is a novel model
About
CRAM (Change Risk Assessment Model) is a novel modelapproach which can significantly contribute to the missing formalityof business models especially in the change(s) risk assessmentarea.
Project Management has long established the need for riskmanagement techniques to be utilised in the succinct definition ofassociated risks in projects and agreement on countervailingassociated risks in projects and agreement on countervailingactions as an aim to reduce scope creep, increase the probabilityof on-time and in-budget delivery.
U t ll d h dl f i d l itUncontrolled changes, regardless of size and complexity, cancertainly pose as risks, of any magnitude, to projects and affectproject success or even an organisation’s coherence.

CCRAM’s Processes
• CRAM is composed of three interrelated processes (steps) which are continuallyrecorded and monitored. CRAM’s processes accomplish specific risk objectives(identification, assessment, monitor & control) which are applied to projects or at agreater extend to business environments with a view to facilitate and control change.
Risk IdentificationRisk Identification
Risk Monitoring & ControlRisk Assessment
Figure 1: CRAM’s Triple Processes

CCRAM’s Hierarchy
• CRAM hierarchical tree consists of one(1) core (root) node, eight (8) parentnodes, five (5) child nodes and itsrespective sixty one (61) attributes Forrespective sixty-one (61) attributes. Forexample, ‘Communication’ parent nodeconsists of seven (7) risk attributes(sub-factors).
• Depending on the scope anddeliverables of a project, CRAM’snodes and related risk attributeshierarchy per level can change so as toaccommodate more of fewer criteria.
Figure 2: CRAM’s Hierarchy Tree

CCRAM’s web page
http://www.changemodel.net

A dAgenda
Significance11
22 CRAM Overview22
33 Analysis of ResultsAnalysis of Results
44 Open Discussion
55 Summary

Analytical Hierarchy Process (AHP) • Analytic Hierarchy Process (AHP) is an established and structured hierarchical pairwise• Analytic Hierarchy Process (AHP) is an established and structured hierarchical pairwiseprocess for making complex decisions that helps users sort out the "best" decision fortheir challenge.
• Sets priorities being a systematic method for comparing a list of objectives leading to a• Sets priorities being a systematic method for comparing a list of objectives leading to adecision; utilising pairwise comparisons; eigenvalues and eigenvector.

Weighting Scale • In order to able to quantify the respondents replies a relative weights mapping scale is• In order to able to quantify the respondents replies, a relative weights mapping scale is used, for example:

Weighting Scale (cont.) • A typical pair wise comparison matrix is seen below (diagonal is always completed by• A typical pair wise comparison matrix is seen below (diagonal is always completed by 1’s):
• When comparing the elements together the smaller one to be compared is consideredWhen comparing the elements together, the smaller one to be compared is consideredto be the unit and the larger one is assessed to be so many times more than that it,using the intensity of feeling and translating it to the numerical value.

Weighting Scale (cont.)
A t i l i i i t i i b l (di l i l l t d b• A typical pair wise comparison matrix is seen below (diagonal is always completed by 1’s):
• When comparing the elements together, the smaller one to be compared is consideredto be the unit and the larger one is assessed to be so many times more than that it,using the intensity of feeling and translating it to the numerical value.

AHP Calculations 1 Let Aij equals the intensity of relative importance between criterion i and criterion j1. Let Aij equals the intensity of relative importance between criterion i and criterion j ,
as defined in previous with:
2. Compute , the sum of each column of A
3 Normalize A by dividing each element Aij in the comparison matrix A by Aj3. Normalize A by dividing each element Aij in the comparison matrix A by Aj
4. Compute the weight of criterion i
Step 3 :(normalisation), actually permits meaningful comparison among elements.
Step4:yields the percentage of overall relative priorities, or preferences. or preferences).

AHP Calculations Example The numbers in the table represent the relative importance between the criteria ForThe numbers in the table represent the relative importance between the criteria. For instance, the relative importance of criterion.
For example: the relative importance of criterion 1 versus criterion 3 is 5 and betweencriterion 3 and criterion 1 it is 1/5. This indicates that criterion 1 is strongly importantcompared with criterion3 The numbers in the weights column show the relative weightscompared with criterion3. The numbers in the weights column show the relative weightsof the corresponding criteria.
To evaluate the credibility of the estimated weights, Saaty (1980, 1983) proposed aneigenvector which is considered a theoretically and practically proven methodeigenvector which is considered a theoretically and practically proven methodfor evaluating the credibility of the weights.

Credibility of Weights – Eigenvectors 1 Calculate the maximum eigenvalue λ of the pair-wise comparison matrix A;1. Calculate the maximum eigenvalue λmax of the pair-wise comparison matrix A;
After computing the nth root of the products of the values in each row, λmax can be found as follows. The priority vector is the nth root divided by the sum of the nth root values.
λmax = Sum of Priority Row
Priority Row = (sum of the row value) x Priority vector
2. Compute the consistency index (C.I.) defined by Saaty as:
If a matrix [A] which represents the pairwise comparisons elements is absolutelyconsistent then it should be equal to the the matrix which denotes the ratios of theconsistent, then it should be equal to the the matrix which denotes the ratios of theweights matrix [W].
In effect if A = W , then λmax = n
The weights (w1...n) which can be obtained by using the eigenvectors, shouldbe positive and normalized, in effect satisfy the reciprocity property.

Credibility of Weights – Eigenvectors (cont.)
N id d th t th i b l t i t th λ i ff t thi l l fNow, provided that there is no absolute consistency then, λmax > n, in effect this level of inconsistency has to be measured. For this reason Saaty, defined the consistency ratio (CR).
3 C l l t th i t ti (C R )3. Calculate the consistency ratio (C.R.)
C R = C. I/R.I
h th d i d (R I ) f diff t b bt i d fwhere the random index (R.I.) for different n can be obtained from:

Random Index (RI) Random Index (RI) is the average of (CI) for random matrices using the Saaty scaleRandom Index (RI) is the average of (CI) for random matrices using the Saaty scale.
500 random reciprocal n x n matrices were generated for n = 3 to n = 15 using the 1 to 9 scale. CR in a sense is normalised as a value as it is divided by the arithmetic mean of random consistency indexes (RI)random consistency indexes (RI).

Consistency Ratio (CR) After a lot of experiments Alonso & Lamata (2006) concluded to the following calculationAfter a lot of experiments Alonso & Lamata (2006) concluded to the following calculation of consistency ratio (CR) as better results can be obtained:
The maximum eigenvalue, based on Saaty, can be determined by raising each random matrix to increasing powers and normalizing the result until the process converged. The consistency index was then computed on each matrix for n = 1 through n = 15consistency index was then computed on each matrix for n = 1 through n = 15.
As a rule of thumb, a value of C.R. ≤ 0.1 is typically considered acceptable.
In other word inconsistency is permitted in AHP as long as it does not exceed the ratio ofIn other word inconsistency is permitted in AHP as long as it does not exceed the ratio of0.1. Nevertheless, AHP is flexible enough that can trace the inconsistent elements andreform the matrix where required; taking into account that changes in the hierarchy orjudgements may lead to changes in the outcome.
If CR equals 0 then that means that the judgments are perfectly consistent..

Further Examples (Consolidated) k = 3 (number of participants)k = 3 (number of participants)
n = 3 (number of criteria), with respective pairwise values as seen below:

Further Examples (cont.) For the consolidated matrix taking as an example the pairwise comparison of nFor the consolidated matrix, taking as an example the pairwise comparison of n1,2(shaded light gray) then:
All remaining elements of the consolidated matrix as calculated with the use of geometric mean formula.
So:So:

Respondent’s Background
Figure 3: PM Methodology Use
Figure 4: PM Experience

( )Respondent’s Background (cont.)
Figure 5: PM Team Members
Figure 6: Current Industry

• Leadership: Project success is accounted in many ways to strong leadership and commitment to
Leadership
• Leadership: Project success is accounted in many ways to strong leadership and commitment toproject scope and objectives. Active leadership remains important throughout the entire projectlifecycle, with the application of skills and determinacy to succeed. Therefore, efficient resourcemanagement is necessary to complete each task in its predefined priority. Senior management’saccountability is key to effective decision making in the context of ‘firm but fair’ handling, to inspireand lead the project team in achieving high performance levels and overall high adaptation rate toproposed and authorised changes.
Figure 7: Leadership's Risk Attributes Process

C
• Communication: Refers to the exchange of ideas or information among stakeholders e g project
Communication
• Communication: Refers to the exchange of ideas or information among stakeholders e.g. projectmanager, team members, board of directors, which are related to change and associated risks.The more complex the organisational structure or the proposed changes, the more communicationchannels have to be engaged. Effective communication is a bi-directional activity which has to becontrolled and monitored. Communication is an important business environment factorincorporating cultural values) as project’s success is highly dependent on communication.
Figure 8: Communication's Risk Attributes

C
• Culture: Collection (but not limited to) of beliefs attitudes core values ways of acting and
Culture
• Culture: Collection (but not limited to) of beliefs, attitudes, core values, ways of acting andthinking shared among members or organisations. Culture can impact the way of businessconduction, decision making process, communication attitude and in effect influence projectsuccess. A supportive, knowledge sharing organisational culture can be enough ‘risk taking’ so asto match complicated project’s scope and objectives with success. A risk averse business culturemight be problematic against accepting proposed changes which in turn, might cause problems toover decision making, communication and leadership of the project.
Figure 9: Culture's Risk Attributes

• Resistance: Change is a time consuming (transitional) and risky process often resisted by
Resistance
• Resistance: Change is a time consuming (transitional) and risky process, often resisted byemployees. If changes are not communicated in the right way, then team members might feelthreatened and undervalued. Because change actually ‘changes’ the way things used to operatein projects, resistance is frequently observed as a phenomenon which might jeopardise project’ssuccess. Feeling anxious which is associated to anticipated changes is more or less normal,nevertheless the project processes have to run as planned.
Figure 10: Resistance's Risk Attributes

• Requirements: Conditions often dictated by the project’s user which the deliverables
Requirements
• Requirements: Conditions often dictated by the project s user which the deliverablesof the project should meet. Any non conformance to customer’s requirements maylead to partially or full unacceptance of the project’s deliverables. Changerequirements have to be documented and closely monitored from start till end of theprojectproject.
Figure 11: Requirement's Risk Attributes

(
Monitoring
• Monitoring: The change process monitoring should be continuous (but have an endat some point), involving benchmarking, milestones establishment, Key PerformanceIndicators (KPIs) and proper feedback. The end at some point, may becomeunnecessary for a reason e.g. if the change becomes obsolete and does not serveany purpose anymore.
Figure 12: Monitoring's Risk Attributes

/
• Flexibility (Adaptation): Refers to the ability to affect changes and to the level which are
Flexibility / Adaptation
• Flexibility (Adaptation): Refers to the ability to affect changes, and to the level which are adaptable to the project scope. Flexibility is also related to the level of quick response to change. For example, there are cases where time is limited and quick decision making is required. Since not all organisations are adaptable to changes the responsiveness to change is an overall added value. Changes process flexibility results from ability to embed changes in project management policies and procedures; sometimes proactively in response to anticipated changes in the project life cycle.
Figure 13: Flexibility's Risk Attributes

• Project Management Team (PMT): Project team members who are directly involved
Project Management Team
• Project Management Team (PMT): Project team members who are directly involved in project management activities, processes and in effect ‘execute’ the project within defined scope and objectives.
Figure 14: PMT’s Risk Attributes

f
Performance: Based on the achievement of preset metrics such as KPI’s (Key
Performance
• Performance: Based on the achievement of preset metrics such as KPI’s (KeyPerformance Indicators), Balanced Score Cards, KSFs, (Key Success Factors), 360,SLAs (Service Level Agreements); assessing measurement and trends to effectprocesses improvement and goals.
Figure 15: Performance’s Risk Attributes

• Motivation: Motivation can inspire and encourage individuals (create value) or
Motivation
• Motivation: Motivation can inspire and encourage individuals (create value) orgroups of people who constitute the project management team to cope with thechanges strategy and increase their overall performance. If motivation is weak thenthis might have serious effects on the project constraints which consequently mightlead to project failure Effectively motivation can be seen also as a driver forlead to project failure. Effectively, motivation can be seen also as a driver forsuccessful project management.
Figure 16: Motivation’s Risk Attributes

• Appraisal: Assessing the performance of employees against agreed change targets
Appraisal
• Appraisal: Assessing the performance of employees against agreed change targetsand consequently to project’s deliverables. Appraisals are better conducted on asystematic, periodic basis. In such a way individual’s job performance andproductivity will be assessed in relation to certain pre-established criteria andorganisational project change objectivesorganisational project change objectives.
Figure 17: Appraisal’s Risk Attributes
• Rewards: Tangible and/or intangible benefits given or received in recompense for worthy
Rewards
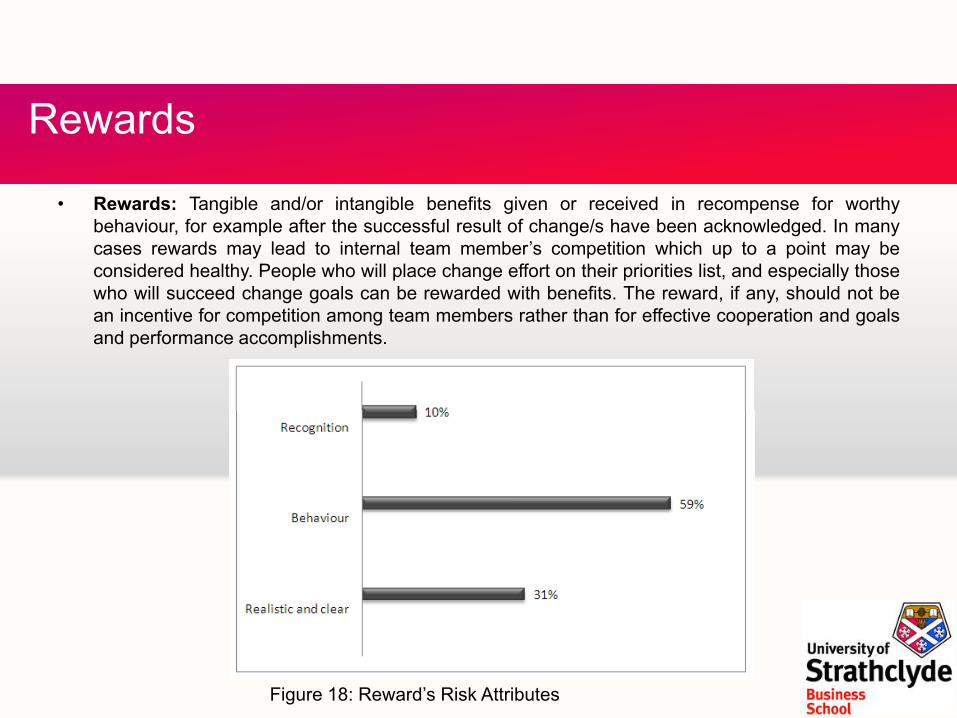
• Rewards: Tangible and/or intangible benefits given or received in recompense for worthybehaviour, for example after the successful result of change/s have been acknowledged. In manycases rewards may lead to internal team member’s competition which up to a point may beconsidered healthy. People who will place change effort on their priorities list, and especially thosewho will succeed change goals can be rewarded with benefits. The reward, if any, should not bean incentive for competition among team members rather than for effective cooperation and goalsand performance accomplishments.
Figure 18: Reward’s Risk Attributes

• Training: Training can be regarded as the acquisition of knowledge skills and competencies as a
Training
• Training: Training can be regarded as the acquisition of knowledge, skills, and competencies as aresult of teaching and course taking. Irrespective of contemporary project managementframework followed, change management training, can be seen as an overall advantage (value)since the knowledge gained is not only specific but necessary to identify, plan and validatechanges, tackle risks in a structured and documented manner.
Figure 19: Training’s Risk Attributes

C O
• Successful Change Management: Change management mostly observed and
Change Risk Overall Assessment
• Successful Change Management: Change management mostly observed andutilised as an integrated process within project management, is a rational process forexploring decision and behaviour alternatives in an attempt to realign the course of“derailed” deliverables due to change and ensure project success.
Figure 20: Change Risk Attributes

S
Depending on the scope and deliverables of a project, CRAM’s nodes and related risk attributes hierarchy per level can be changed so as to accomm
CRAM as a novel model approach has the capacity to define the internal dynamics of change management withinproject management eliciting also risk cause-and-effect relationships.
Summary
11
Depending on the scope and deliverables of a project, CRAM’s nodes and related risk attributes hierarchyper level can be changed so as to accommodate more of fewer criteria.Depending on the scope and deliverables of a project, CRAM’s nodes and related risk attributes hierarchyper level can be changed so as to accommodate more of fewer criteria.
project management eliciting also risk cause and effect relationships.11
22
A functional hierarchy is constructed so as to decompose the complex system in smaller criteria or attributes in alogical and simpler way.
CRAM allows users to describe a problem as they see it, refine the complexity and structure a hierarchy of attributes.CRAM allows users to describe a problem as they see it, refine the complexity and structure a hierarchy of attributes.33
44
The only restriction on the hierarchic arrangement of elements is that any element in one level must be capable ofThe only restriction on the hierarchic arrangement of elements is that any element in one level must be capable of
g p y
A hierarchical ‘tree like’ graphical model representation can be easily interpreted being capable of representingprobabilistic relationships among a set of variables and associated attributes,55
Can be applied to variety of industries / projects irrespective of size and complexity.Can be applied to variety of industries / projects irrespective of size and complexity.
y g ybeing related to some elements in the next higher level, which serves as a criterion for assessing the relative impactof elements in the level below..
y g ybeing related to some elements in the next higher level, which serves as a criterion for assessing the relative impactof elements in the level below..
66
77

“I do not believe you can do today’s job with yesterday’s methods and be in business tomorrow”
Nelson Jackson
Building the Professional of 2020: An Approach toBuilding the Professional of 2020: An Approach to Business Change Process Integration
Thank You!Questions?
[email protected]@gmail.com
Research conducted at City University London