Embed Size (px)
Citation preview

Nord Anglia Education
First Quarter Fiscal 2017
Results PresentationFor the period ended November 30, 2016
January 24, 2017
1

Neither Nord Anglia Education, Inc. (NYSE: NORD) nor any of its subsidiaries or affiliates
is making any representation or warranty, expressed or implied, as to the accuracy or
completeness of the attached materials.
Please note that the attached materials and our oral explanations of the attached materials
may constitute forward-looking statements within the meaning of applicable U.S. securities
laws and such forward-looking statements are made based on our current
expectations. Forward-looking statements relate to events involving certain risks and
uncertainties, and actual results may differ materially from the views expressed.
A number of potential risks and uncertainties are outlined in our public filings with the
Securities and Exchange Commission. Nord Anglia Education, Inc. does not undertake
any obligation to update any forward-looking statement, except as required under
applicable law. You are cautioned not to place undue reliance on any forward-looking
statements.
Disclaimer
2

First quarter vs prior year
Financial
Revenue up 6.9% (CC1 8.5%) from $244.2 million to $261.0 million
Adjusted EBITDA decreased1.4% (CC1 up 0.4%) from $64.2 million to $63.3
million
Adjusted Net Income increased from $25.9 million to $26.0 million
Adjusted EPS unchanged at $0.25
Operational
Average full time equivalent students (FTEs) up 7.8% from to 36,934
Capacity up 11.9% from 48,998 seats to 54,813 seats
Revenue/FTE decreased 0.7% (CC1 increased 0.7%) from $7.1k to $7.0k
1 CC denotes Constant Currency throughout
3

4
Creating an education for the

in FY2017
Significant progress and
now in advanced
discussions with a
number of opportunities
Deep pipeline
On target to deploy
available capital of
~$200m+
Opened our first China
Bilingual school in
Shanghai
Exceptional demand
China Bilingual division
start-up on track
Targeting license for a
new school for
September 2017
New Bangkok campus
~1500 seats opening
September 2017
New Hong Kong campus
~520 seats opening
September 2017
New school Abu Dhabi
~400 seats expected
opening September 2017
~$11m same school expansion, ~$28m in maintenance capex
and ~$4m one-off systems project capex in FY2017
Expected capex
in FY2017 ~$20m Expected capex
in FY2017 ~$22m
5

Financial
6

Group summary – Q1 fiscal 2017 vs Q1 fiscal 2016
$ millions Q1FY17(1) Q1FY16 Variance
Premium Schools 260.1 243.1 CC: 8.6%
Actual: 7.0%
Other 0.9 1.1
Total Revenue 261.0 244.2 CC: 8.5%
Actual: 6.9%
Gross Profit 97.1 96.1 CC: 2.8%
Actual: 1.0%
Gross Profit Margin 37.2% 39.4% (2.2%)
Adjusted EBITDA 63.3 64.2 CC: 0.4%
Actual: (1.4%)
Adjusted EBITDA Margin 24.3% 26.3% (2.0%)
Adjusted Net Income 26.0 25.9 Actual: 0.4%
Adjusted EPS (in $) 0.25 0.25 Actual: 0.5%
1 Q1FY17 ends November 30, 2016
7

Q1 fiscal 2017 revenue bridge
Premium schools revenue
($ millions)
243.1 239.5
260.1
(3.6)
20.6
0.0
50.0
100.0
150.0
200.0
250.0
300.0
Q1 FY16 actual Q1 FY16 FX impact Q1 FY16 CC Q1 FY17 OrganicGrowth CC
Q1 FY17 actual
8
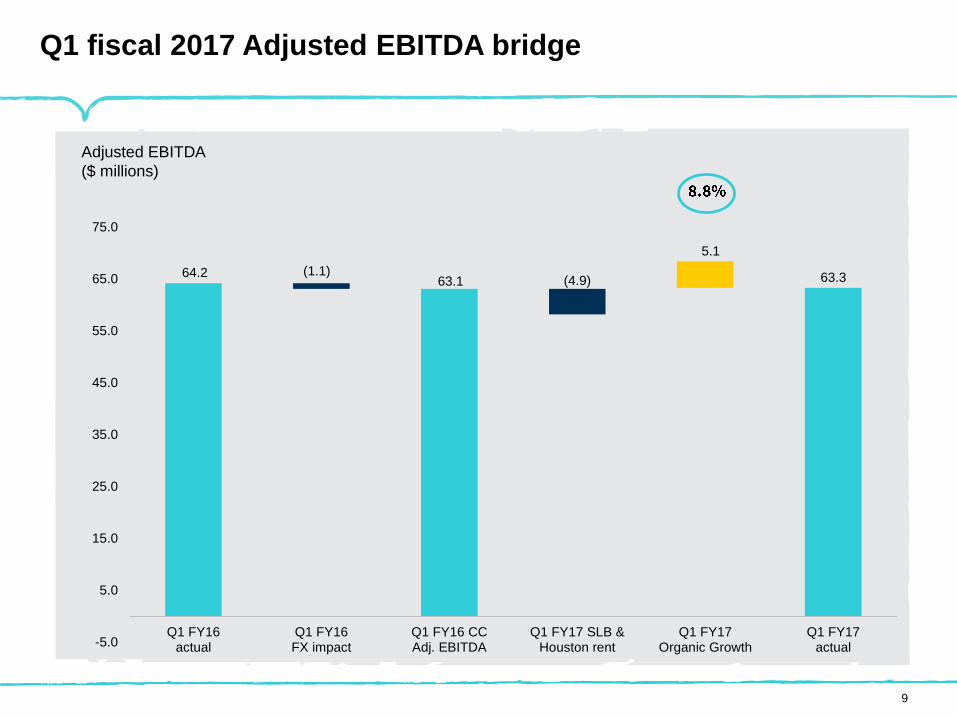
Q1 fiscal 2017 Adjusted EBITDA bridge
Adjusted EBITDA
($ millions)
64.263.1 63.3
(1.1)(4.9)
5.1
-5.0
5.0
15.0
25.0
35.0
45.0
55.0
65.0
75.0
Q1 FY16actual
Q1 FY16FX impact
Q1 FY16 CCAdj. EBITDA
Q1 FY17 SLB &Houston rent
Q1 FY17Organic Growth
Q1 FY17actual
9

China Expat Q1 FY2017
Commentary
Revenue/FTE $9.2k down from $9.6k due to:
FX impact of stronger USD; and
mix impact of stronger growth in lower price
point schools
Adjusted EBITDA Margin 42.3% up from 42.1%
Revenue $54.2m from $55.3m (2.0%)
+3.5% CC
Adj. EBITDA $22.9m from $23.3m (1.7%)
+4.2% CC
5,744 5,888
8,9269,242
Q1 FY16 Q1 FY17
FTEs Capacity
10

China Bilingual Q1 FY2017
Commentary
Revenue/FTE $7.4k for Q1 FY2017
Expected Revenue/FTE for FY2017 ~$26.0k
Expected to be around Adjusted EBITDA
breakeven and cash flow positive in FY2017
Establishment of new team on track
Revenue
$3.3m
Adj. EBITDA $0.2m
446
2,250
Q1 FY16 Q1 FY17
FTEs Capacity
11

Europe Q1 FY2017
Commentary
Revenue/FTE $9.2k down from $9.5k due to:
FX impact from strengthening USD; and
Mix impact of strong growth in Europe ex
Switzerland
Adjusted EBITDA Margin 23.7% up from 23.5%
Revenue $63.0m from $61.8m +1.9%
+2.3% CC
Adj. EBITDA $14.9m from $14.5m +2.8%
+3.2% CC
6,4726,859
8,617
9,691
Q1 FY16 Q1 FY17
FTE Capacity
12

Middle East Q1 FY2017
Commentary
Revenue/FTE $4.9k up from $4.8k due to:
limited tuition increases; and
positive mix impact
Adjusted EBITDA Margin 24.5% up from 21.9%
due to increased utilization
Revenue $27.5m from $25.2m +9.1%
+9.3% CC
Adj. EBITDA $6.7m from $5.5m +21.8%
+22.4% CC
5,2825,620
5,8516,187
Q1 FY16 Q1 FY17
FTE Capacity
13

South East Asia Q1 FY2017
Commentary
Revenue/FTE $4.9k up from $4.7k due to tuition
fee increases
Adjusted EBITDA Margin 32.5% up from 29.9%
due to utilization increase
Revenue $40.6m from $34.7m +17.0%
+15.5% CC
Adj. EBITDA $13.2m from $10.4m +26.9%
+25.7% CC
7,3218,219
12,09712,561
Q1 FY16 Q1 FY17
FTE Capacity
14
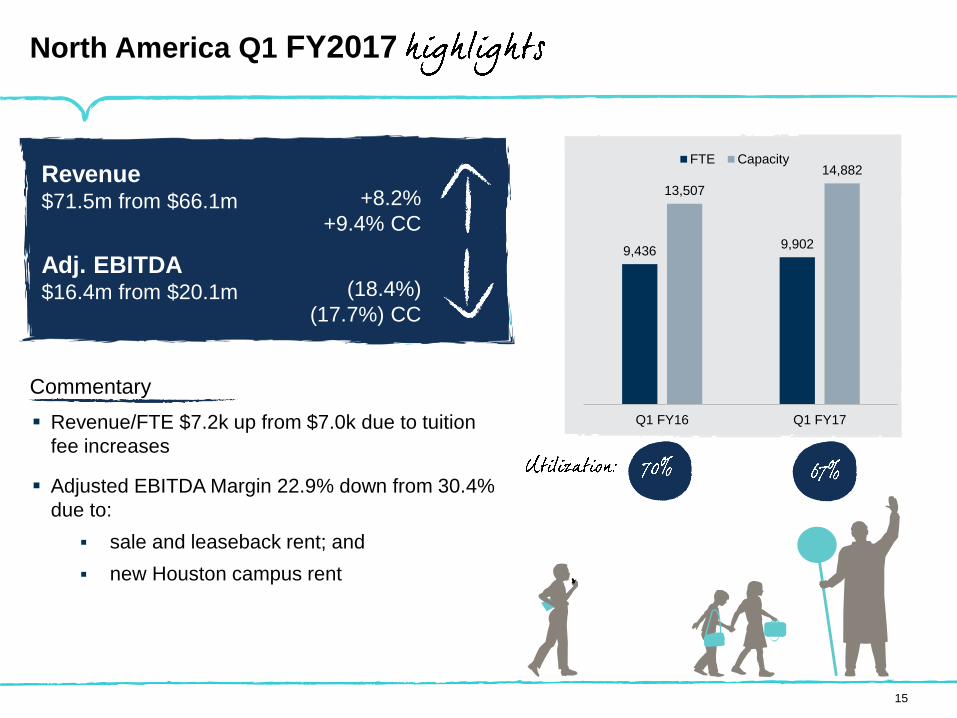
North America Q1 FY2017
Commentary
Revenue/FTE $7.2k up from $7.0k due to tuition
fee increases
Adjusted EBITDA Margin 22.9% down from 30.4%
due to:
sale and leaseback rent; and
new Houston campus rent
Revenue $71.5m from $66.1m +8.2%
+9.4% CC
Adj. EBITDA $16.4m from $20.1m (18.4%)
(17.7%) CC
9,4369,902
13,507
14,882
Q1 FY16 Q1 FY17
FTE Capacity
15
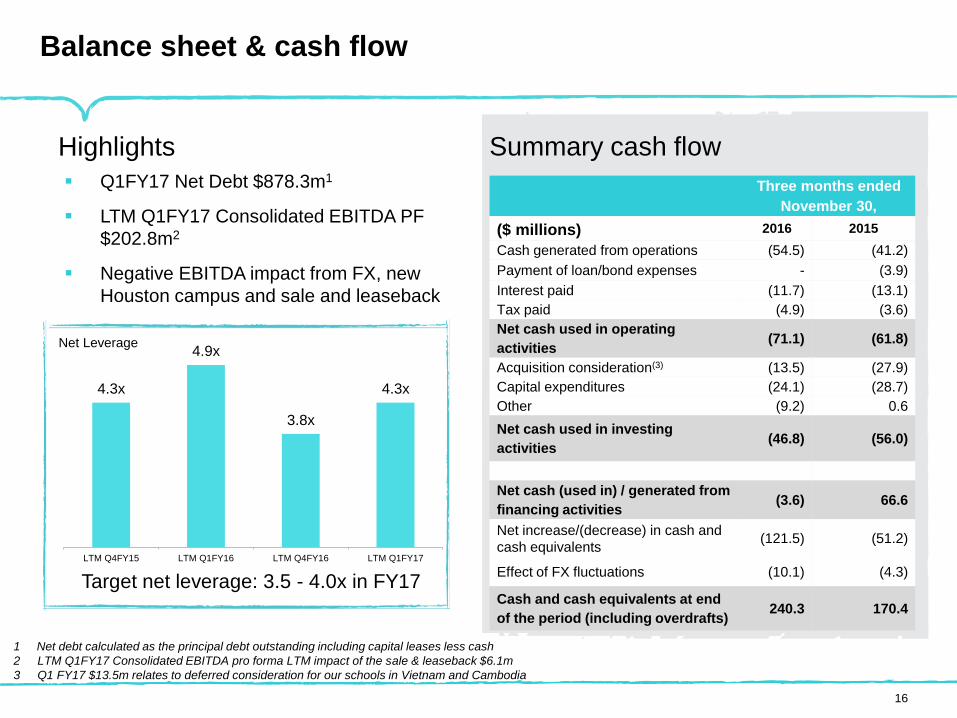
Balance sheet & cash flow
4.3x
4.9x
3.8x
4.3x
LTM Q4FY15 LTM Q1FY16 LTM Q4FY16 LTM Q1FY17
Net Leverage
Three months ended
November 30,
($ millions) 2016 2015
Cash generated from operations (54.5) (41.2)
Payment of loan/bond expenses - (3.9)
Interest paid (11.7) (13.1)
Tax paid (4.9) (3.6)
Net cash used in operating
activities (71.1) (61.8)
Acquisition consideration(3) (13.5) (27.9)
Capital expenditures (24.1) (28.7)
Other (9.2) 0.6
Net cash used in investing
activities (46.8) (56.0)
Net cash (used in) / generated from
financing activities (3.6) 66.6
Net increase/(decrease) in cash and
cash equivalents (121.5) (51.2)
Effect of FX fluctuations (10.1) (4.3)
Cash and cash equivalents at end
of the period (including overdrafts)240.3 170.4
Q1FY17 Net Debt $878.3m1
LTM Q1FY17 Consolidated EBITDA PF
$202.8m2
Negative EBITDA impact from FX, new
Houston campus and sale and leaseback
Highlights Summary cash flow
Target net leverage: 3.5 - 4.0x in FY17
1 Net debt calculated as the principal debt outstanding including capital leases less cash
2 LTM Q1FY17 Consolidated EBITDA pro forma LTM impact of the sale & leaseback $6.1m
3 Q1 FY17 $13.5m relates to deferred consideration for our schools in Vietnam and Cambodia
16

17

Nord Anglia Education is updating its earnings
outlook for FY2017 to reflect the impact of our term
loan repricing:
for FY2017
1 Diluted weighted average shares of approximately 104.5 million
Previous FY2017
outlook
as of Nov 29, 2016
Updated FY2017
outlook
as of Jan 24, 2017
Revenue $910 – $930 million $910 – $930 million
Adjusted EBITDA $207 – $217 million $207 – $217 million
Adjusted Net Income $67 – $72 million $69 – $74 million
Adjusted EPS1$0.64 – $0.69 $0.66 – $0.71
18

19
49,400
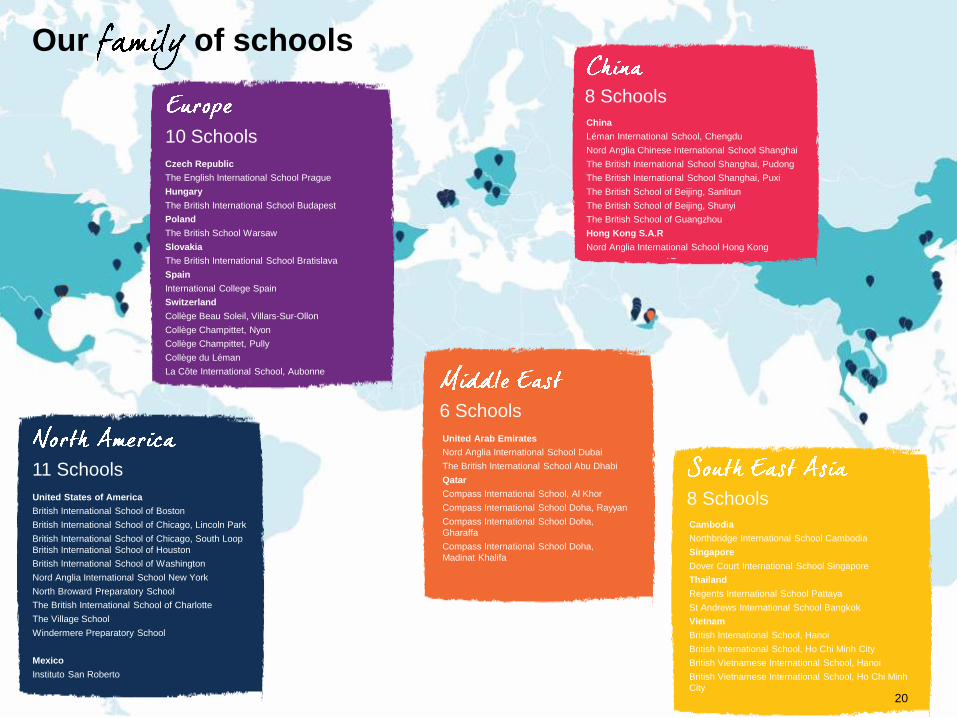
11 Schools
10 Schools
6 Schools
8 Schools
Our of schools
8 Schools
United States of America
British International School of Boston
British International School of Chicago, Lincoln Park
British International School of Chicago, South Loop
British International School of Houston
British International School of Washington
Nord Anglia International School New York
North Broward Preparatory School
The British International School of Charlotte
The Village School
Windermere Preparatory School
Mexico
Instituto San Roberto
Czech Republic
The English International School Prague
Hungary
The British International School Budapest
Poland
The British School Warsaw
Slovakia
The British International School Bratislava
Spain
International College Spain
Switzerland
Collège Beau Soleil, Villars-Sur-Ollon
Collège Champittet, Nyon
Collège Champittet, Pully
Collège du Léman
La Côte International School, Aubonne
United Arab Emirates
Nord Anglia International School Dubai
The British International School Abu Dhabi
Qatar
Compass International School, Al Khor
Compass International School Doha, Rayyan
Compass International School Doha,
Gharaffa
Compass International School Doha,
Madinat Khalifa
Cambodia
Northbridge International School Cambodia
Singapore
Dover Court International School Singapore
Thailand
Regents International School Pattaya
St Andrews International School Bangkok
Vietnam
British International School, Hanoi
British International School, Ho Chi Minh City
British Vietnamese International School, Hanoi
British Vietnamese International School, Ho Chi Minh
City
China
Léman International School, Chengdu
Nord Anglia Chinese International School Shanghai
The British International School Shanghai, Pudong
The British International School Shanghai, Puxi
The British School of Beijing, Sanlitun
The British School of Beijing, Shunyi
The British School of Guangzhou
Hong Kong S.A.R
Nord Anglia International School Hong Kong
20
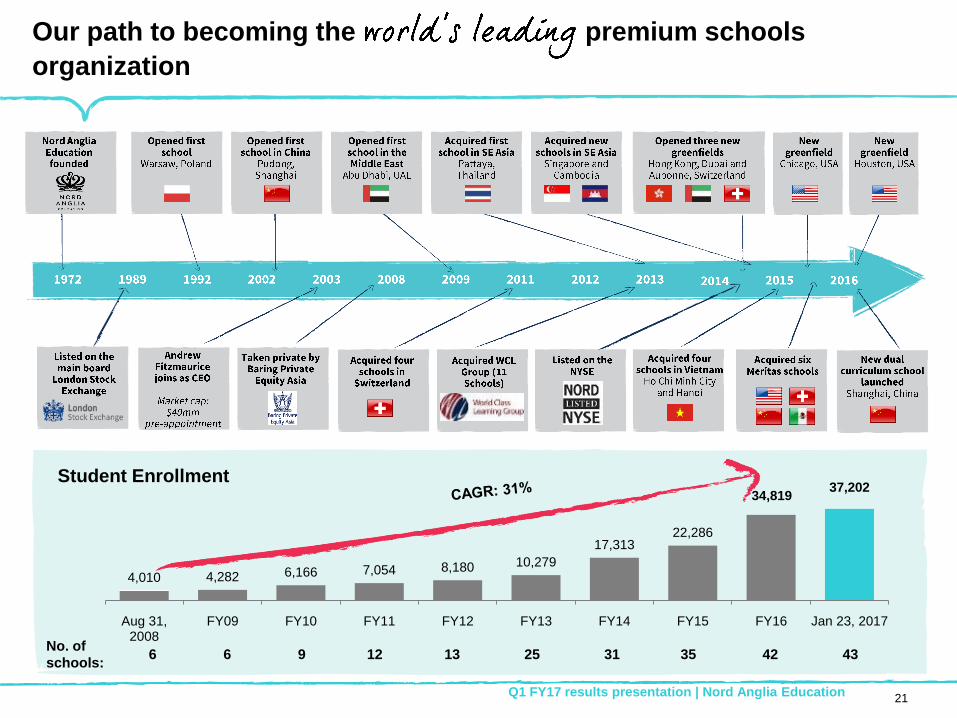
Our path to becoming the premium schools
34,81937,202
4,010 4,282 6,166 7,054 8,180 10,279
17,31322,286
Aug 31,2008
FY09 FY10 FY11 FY12 FY13 FY14 FY15 FY16 Jan 23, 2017
No. of
schools:6 6 9 12 13 25 31 35 42 43
Student Enrollment
organization
Q1 FY17 results presentation | Nord Anglia Education21

Greenfield opportunities generate the returns
Key factors:
Market growth - supply/
demand dynamics
EBITDA margin at maturity
average breakeven
utilization – c.30-35%
average margin of
NORD schools at
maturity – c.33%
Lower Higher
Hig
he
rL
ow
er
3-4 years to breakeven1
6-8 years to maturity2
e.g. Chicago (opened
Sept 2015)
1-2 years to breakeven1
3-4 years to maturity2
e.g. Shanghai (opened
Sept 2003)
Not a strategic fit
2-3 years to breakeven1
3-5 years to maturity2
e.g. Dubai (opened
Sept 2014)
Growth
Margin
22
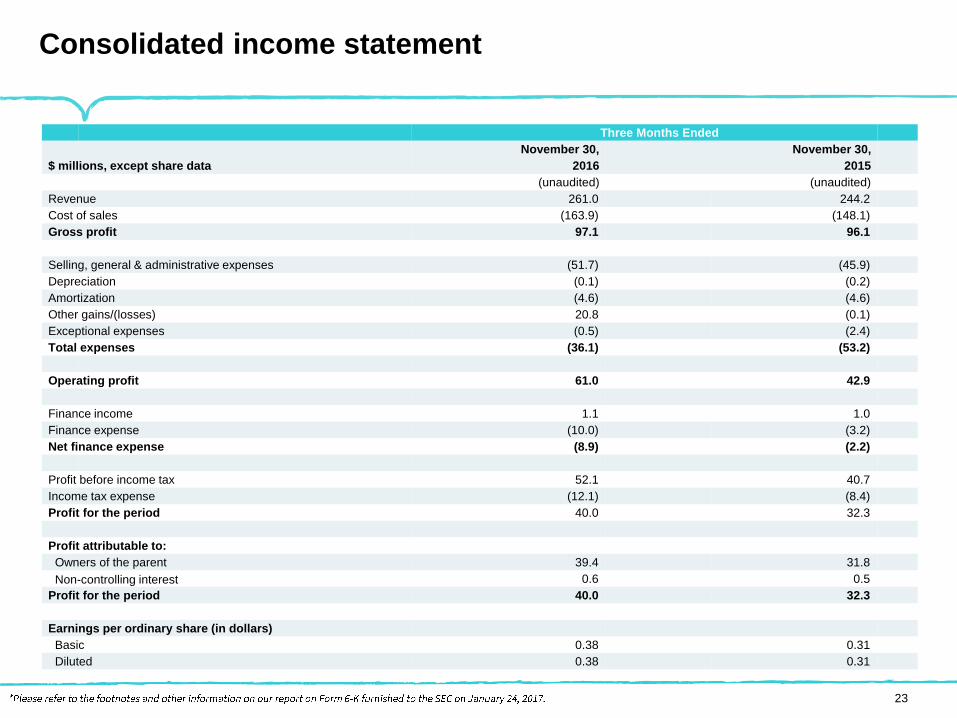
Consolidated income statement
Three Months Ended
$ millions, except share data
November 30,
2016
November 30,
2015
(unaudited) (unaudited)
Revenue 261.0 244.2
Cost of sales (163.9) (148.1)
Gross profit 97.1 96.1
Selling, general & administrative expenses (51.7) (45.9)
Depreciation (0.1) (0.2)
Amortization (4.6) (4.6)
Other gains/(losses) 20.8 (0.1)
Exceptional expenses (0.5) (2.4)
Total expenses (36.1) (53.2)
Operating profit 61.0 42.9
Finance income 1.1 1.0
Finance expense (10.0) (3.2)
Net finance expense (8.9) (2.2)
Profit before income tax 52.1 40.7
Income tax expense (12.1) (8.4)
Profit for the period 40.0 32.3
Profit attributable to:
Owners of the parent 39.4 31.8
Non-controlling interest 0.6 0.5
Profit for the period 40.0 32.3
Earnings per ordinary share (in dollars)
Basic 0.38 0.31
Diluted 0.38 0.31
23

operating data
Three Months Ended
November 30,
2016
November 30,
2015
Full-time equivalent students (average for the period)
China 5,888 5,744
China Bilingual 446 -
China total 6,334 5,744
Europe 6,859 6,472
Middle East 5,620 5,282
South East Asia 8,219 7,321
North America 9,902 9,436
Total 36,934 34,255
Capacity (average for the period)
China 9,242 8,926
China Bilingual 2,250 -
China total 11,492 8,926
Europe 9,691 8,617
Middle East 6,187 5,851
South East Asia 12,561 12,097
North America 14,882 13,507
Total 54,813 48,998
24

operating data continued
Three Months Ended
November 30,
2016
November 30,
2015
Utilization (average for the period)
China 64% 64%
China Bilingual 20% -
China total 55% 64%
Europe 71% 75%
Middle East 91% 90%
South East Asia 65% 61%
North America 67% 70%
Total 67% 70%
Revenue per FTE (in $ thousands)
China 9.2 9.6
China Bilingual 7.4 -
China total 9.1 9.6
Europe 9.2 9.5
Middle East 4.9 4.8
South East Asia 4.9 4.7
North America 7.2 7.0
Total 7.0 7.1
25

Supplemental financial data
Three Months Ended % Variance
$ millions
November 30,
2016
November 30,
2015Reported
Constant
Currency
(unaudited) (unaudited)
Revenue (segment)
Premium Schools
China 54.2 55.3 (2.0%) 3.5%
China Bilingual 3.3 - - -
China total 57.5 55.3 4.0% 9.8%
Europe 63.0 61.8 1.9% 2.3%
Middle East 27.5 25.2 9.1% 9.3%
South East Asia 40.6 34.7 17.0% 15.5%
North America 71.5 66.1 8.2% 9.4%
Total Premium Schools 260.1 243.1 7.0% 8.6%
Other 0.9 1.1 (18.2%) (8.0%)
Total Revenue 261.0 244.2 6.9% 8.5%
Adjusted EBITDA (segment)
Premium Schools
China 22.9 23.3 (1.7%) 4.2%
China Bilingual 0.2 - - -
China total 23.1 23.3 (0.9%) 5.2%
Europe 14.9 14.5 2.8% 3.2%
Middle East 6.7 5.5 21.8% 22.4%
South East Asia 13.2 10.4 26.9% 25.7%
North America 16.4 20.1 (18.4%) (17.7%)
Total Premium Schools 74.3 73.8 0.7% 2.8%
Other - (0.2) (100.0%) (100.0%)
Central and regional expenses (11.0) (9.4) 17.0% 21.3%
Adjusted EBITDA 63.3 64.2 (1.4%) 0.4%
Adjusted Net Income 26.0 25.9 0.4%
26

Reconciliation of non-GAAP financial data
Three Months Ended
$ millionsNovember 30, November 30,
2016 2015
Profit for the period 40.0 32.3
Income tax expense 12.1 8.4
Net financing expense 8.9 2.2
Exceptional items 0.5 2.4
Other (gains)/losses (20.8) 0.1
Amortization 4.6 4.6
Depreciation 0.1 0.2
Depreciation in cost of sales 11.8 11.8
EBITDA 57.2 62.0
Gain on disposal of property, plant and equipment (0.0) (0.0)
Share based payments 2.2 1.6
Greenfield pre-opening costs 1.5 0.3
China Bilingual team establishment 0.3 -
Rollout of Juilliard Program 0.6 0.3
Rollout of MIT collaboration 0.4 -
Global campus expedition facility 0.4 -
SOX implementation 0.5 -
Other 0.2 -
Adjusted EBITDA 63.3 64.2
27

Reconciliation of non-GAAP financial data continued
Three Months Ended
$ millionsNovember 30, November 30,
2016 2015
Depreciation (11.9) (12.0)
Net Financing Expense (8.9) (2.2)
Financing Expense Adjustments (7.0) (14.0)
Income Tax Expense (12.1) (8.4)
Tax Adjustments 3.2 (1.2)
Non-Controlling Interest (0.6) (0.5)
Adjusted Net Income 26.0 25.9
Adjusted earnings per ordinary share (in $)
Basic 0.25 0.25
Diluted 0.25 0.25
28

29