Embed Size (px)
Citation preview

Date
1
BGC PARTNERS, INC.NASDAQ: BGCPGeneral Investor Presentation November 2016

Date
2
DISCLAIMER
Discussion of Forward-Looking Statements by BGC Partners
Statements in this document regarding BGC's businesses that are not historical facts are "forward-looking statements" that involve risks and
uncertainties. Except as required by law, BGC undertakes no obligation to release any revisions to any forward-looking statements. For a discussion of
additional risks and uncertainties, which could cause actual results to differ from those contained in the forward-looking statements, see BGC's
Securities and Exchange Commission filings, including, but not limited to, the risk factors set forth in its public filings, including the most recent Form 10-
K and any updates to such risk factors contained in subsequent Forms 10-Q or Forms 8-K
Note Regarding Financial Tables and Metrics
Excel files with the Company’s quarterly financial results and metrics from the current period dating back to the full year 2008 are accessible in the
various financial results press releases at the “Investor Relations” section of http://www.bgcpartners.com. They are also available directly at
ir.bgcpartners.com/news-releases/news-releases.
Other Items
“Newmark Grubb Knight Frank” is synonymous in this document with “NGKF” or “Real Estate Services.”
Our discussion of financial results for “Newmark Grubb Knight Frank,” “NGKF,” or “Real Estate Services” reflects only those businesses owned by us
and does not include the results for Knight Frank or for the independently-owned offices that use some variation of the NGKF name in their branding or
marketing.
For the purposes of this document, all of the Company’s fully electronic businesses in the Financial Services segment may be referred to
interchangeably as “FENICS.” This includes fees from fully electronic brokerage, as well as data, software, and post-trade services (formerly known as
“market data and software solutions”) across both BGC and GFI. FENICS results do not include those of Trayport, which are reported separately due to
its sale to Intercontinental Exchange, Inc. (“ICE”) for approximately 2.5 million ICE common shares in December of 2015. Trayport generated gross
revenues of approximately $80 million for the trailing twelve months ended September 30, 2015 and had a pre-tax earnings margin of nearly 45 percent.
On June 28, 2013, BGC sold its fully electronic trading platform for benchmark U.S. Treasury Notes and Bonds to Nasdaq Inc. For the purposes of this
document, the assets sold may be referred to as “eSpeed,” and the businesses remaining with BGC that were not part of the eSpeed sale may be
referred to as "retained" or "FENICS".
Beginning on February 27, 2015, BGC began consolidating the results of GFI, which continues to operate as a controlled company and as a separately
branded division of BGC. BGC owned approximately 67% of GFI’s outstanding common shares as of December 31, 2015. On January 12, 2016, BGC
completed the merger of GFI by acquiring 100% of GFI's outstanding shares.
BGC, BGC Trader, GFI, FENICS, FENICS.COM, Capitalab, Swaptioniser, Newmark, Grubb & Ellis, ARA, Computerized Facility Integration, Landauer,
Landauer Valuation & Advisory, Excess Space, Excess Space Retail Services, Inc., and Grubb are trademarks/service marks and/or registered
trademarks/service marks of BGC Partners, Inc. and/or its affiliates. Knight Frank is a service mark of Knight Frank (Nominees) Limited.© 2016 BGC Partners, Inc. All rights reserved.
2

Date
DISCLAIMER (CONTINUED)
3
Distributable Earnings
This presentation should be read in conjunction with BGC’s most recent financial results press release. Unless otherwise stated, throughout this document BGC refers
to its income statement results only on a distributable earnings basis. For a complete and revised description of this non-GAAP term and how, when, and why
management uses it, see the "Distributable Earnings Defined" pages of this presentation. For both this description and a reconciliation to GAAP, as well as for more
information regarding GAAP results, see BGC’s most recent financial results press release, including the sections called “Distributable Earnings Defined”, “Differences
Between Consolidated Results for Distributable Earnings and GAAP”, and “Reconciliation of GAAP Income (Loss) to Distributable Earnings”. These reconciliations can
also be found in the “Appendix” section of this presentation. Below is a summary of certain GAAP and non-GAAP results for BGC. Segment results on a GAAP and non-
GAAP basis are included towards the end of this presentation.
Adjusted EBITDA
See the sections of BGC’s most recent financial results press release titled “Adjusted EBITDA Defined” and “Reconciliation of GAAP Income (Loss) to Adjusted
EBITDA.”
Liquidity Defined
BGC also uses a non-GAAP measure called “liquidity.” The Company considers liquidity to be comprised of the sum of cash and cash equivalents plus marketable
securities that have not been financed, and securities owned, all found on the GAAP balance sheet. BGC considers this an important metric for determining the amount
of cash that is available or that could be readily available to the Company on short notice. Net long-term liquidity is defined as the current market value of Nasdaq shares
expected to be received over time with respect to the Nasdaq earn-out, plus liquidity, less long-term debt.
A discussion of distributable earnings and adjusted EBITDA and reconciliations of these items, as well as liquidity, to GAAP results are found later in this document,
incorporated by reference, and also in our most recent financial results press release and/or are available at http://ir.bgcpartners.com/Investors/default.aspx.

Date
4
GENERAL OVERVIEW
BGC PARTNERS

Date
SOLID BUSINESS WITH SIGNIFICANT OPPORTUNITIES
Two business lines: Financial Services & Real Estate Services
Growing our highly profitable FENICS (fully electronic) business
Diversified revenues by geography & product class
Liquidity of approximately $840 million, not including expected future receipt of over $710
million in Nasdaq shares
Strong track record of accretive acquisitions and profitable hiring
Low interest rate environment benefits commercial real estate; potential rising interest rates
provide tailwinds to Financial Services
Intermediary-oriented, low-risk business model
We expect to pay out at least 75% of distributable earnings per share over time
Dividend of $0.16 per share, up 14% yr/yr, for a 6.6% qualified dividend yield
Considering steps to unlock the significant value of BGC's assets and businesses
Note: BGCP dividend yield and Nasdaq share value are calculated based on closing stock price at November 23, 2016
5

Date
1 FIRM, 2 SEGMENTS, MANY BUSINESSES
Note: In addition to the results shown above, BGC’s consolidated trailing twelve month (“TTM”) results also include Corporate revenues of $32.6 million. BGC’s 3Q16 results also include Corporate
pre-tax distributable loss of $16.4 million, not shown above. FENICS revenues and margins exclude Trayport. In 3Q2016, Voice/Hybrid/Other earnings include $17.5 million related to the Nasdaq
share earn-out. The Voice/Hybrid/Other margin would be approximately 13% without the share earn-out for the quarter.
6
Financial Services
Voice/Hybrid/OtherFENICS
(Fully Electronic)
Key products include:
• Rates
• Foreign Exchange (“FX”)
• Credit
• Energy & Commodities
• Equities
2,353 brokers & salespeople
300+ Financial desks
In 30+ cities
Key products include:
• Interest Rate Derivatives
• Credit
• FX
• Global Gov’t Bonds
• Market Data
• Software Solutions
• Post-trade Services
Proprietary network connected to the global financial community
TTM 3Q16 Rev = $1,281MM
TTM 3Q16 Pre-Tax Margin ≈ 18%
TTM 3Q16 Rev = $255 MM
TTM 3Q16 Pre-Tax Margin ≈ 47%
Real Estate Services
Commercial Real Estate
Brokerage Services:
• Leasing
• Investment Sales
• Capital Raising
Other Services:
• Property & Facilities Management
• Global Corporate Services (consulting)
• Valuation
1,447 brokers & salespeople
Over 90 offices
TTM 3Q16 Revenue = $1,040 million
TTM 3Q16 Pre-Tax Margin ≈ 12%

Date
BGC'S STRONG YEAR-OVER-YEAR DISTRIBUTABLE EARNINGS
GROWTH IN 3Q16
7
Highlights of Consolidated Distributable Earnings Results (USD millions, except
per share data)3Q 2016 3Q 2015 Change (%)
Revenues $643.5 $685.3 (6.1)%
Pre-tax distributable earnings before non-controlling interest in subsidiaries and
taxes106.8 99.0 7.9%
Pre-tax distributable earnings per share 0.25 0.26 (3.8)%
Post-tax distributable earnings 89.8 79.3 13.3%
Post-tax distributable earnings per share 0.21 0.21 0.0%
Adjusted EBITDA 196.2 168.0 16.8%
Pre-tax distributable earnings margin 16.6% 14.4%
Post-tax distributable earnings margin 14.0% 11.6%

Date
8
BGC'S BUSINESS REVENUE DIVERSITY
8Note: Percentages are approximate for rounding purposes.
1. Includes: data, software, post-trade, interest, and other revenue for distributable earnings (including Nasdaq earn-out)
Wholesale Financial Brokerage revenues and
earnings typically seasonally strongest in 1st
quarter, weakest in 4th quarter
Commercial Real Estate Brokerage
revenues and profitability typically seasonally
strongest in 4th quarter, weakest in 1st
quarter
FY 2015 Revenues by Asset Class
Rates18%
F/X13%
Credit11%
Energy & Commodities
8%Equitiesand Other
7%Data, Software, Post-trade & Other
6%
Leasing and Other Services
21%
Real Estate Capital Markets
10%
Real Estate Management and
Other7%
Corporate1%
Financial
Services
61%
Real Estate
Services
38%
Corporate
1%
EMEA, 30%
Americas, 61%
APAC, 8%
FY 2015 Revenues by Geography
1

Date
9
2,498 2,454 2,441 2,391 2,353
1,347 1,401 1,417 1,421 1,447
3Q 2015 4Q 2015 1Q 2016 2Q 2016 3Q 2016
Financial Brokerage Real Estate
Financial Services average revenue per front office employee was $148,000, down 3%, largely driven by decreased volumes across
many of the financial services products brokered
Real Estate Services average revenue per front office employee was $163,000, down 4% primarily driven by new headcount added
over the past twelve months
Historically, BGC’s revenue per front office employee has generally fallen after large acquisitions and significant broker hires. As the
integration of recent acquisitions continues, recently hired brokers ramp up production, and as more voice and hybrid revenue is
converted to more profitable fully electronic trading, the Company expects broker productivity to grow.
BGC’S FRONT OFFICE HEADCOUNT & PRODUCTIVITY
FRONT OFFICE HEADCOUNT
Note: The Real Estate figures are based on brokerage revenues, leasing and capital markets brokers, and exclude staff in management services and other. The Financial Services figures in the above table include
segment revenues from total brokerage revenues, data, software and post-trade, and exclude revenues and salespeople related to Trayport and other income. The average revenues for all producers are approximate
and based on the total revenues divided by the weighted-average number of salespeople and brokers for the period.
FRONT OFFICE PRODUCTIVITY
Yr/Yr change: -1%
158 154
628 614
Q3 2015 Q3 2016 FY 2014 FY 2015
-3%
-2%
(USD Thousands)
3,845 3,855 3,858 3,812 3,800

Date
STRONG RECORD OF SUCCESSFUL, ACCRETIVE ACQUISITIONS
Across U.S.
Leasing & Capital Markets
Brokerage
Newmark Knight
Frank Across U.S.
Property &
Facilities
Management
Leasing & Capital
Markets Brokerage
Grubb & Ellis (a)
Across U.S.
Municipal Bonds
Wolfe & Hurst
Paris
Credit, Swaps
Ginalfi
U.K.
Rates
Sterling
Real EstateFinancial Services
Key
Cornish & Carey
Commercial
Apartment Realty
Advisors (ARA)
2 Real Estate
Acquisitions
Environmental
brokerage
CO2e
Frederick Ross
Smith Mack
2 Real Estate
Acquisitions
Global
Commodities
Rates
FX
Credit
Equities
GFI Group
(a) BGC acquired the rights of these businesses
(b) Agreement to acquire Sunrise was announced on July 19th, 2016
10
Excess Space
Computerized
Facility Integration
Cincinnati
Commercial Real
Estate
Steffner Commercial
Real Estate d/b/a
Newmark Grubb
Memphis
4 Real Estate
Acquisitions
New York / New
Jersey / Florida
Regional Power
Markets / Nat Gas
Mexico
Rates
Bonds
Remate Lince
London
Rates, FX
R.P. Martin (a)
HEAT Energy (a)
London
Mainly Equities
Mint Partners/
Mint Equities (a)
20132010 2011 2012 2014 2015 2016
CRE Group
Rudesill-Pera
Multifamily
Continental Realty
Newmark Grubb
Mexico City
4 Real Estate
Acquisitions
Electronic Fixed
Income / Futures
trading
Perimeter
Technology
Infrastructure for
OTC Financial
Markets
Lucera
Primarily Equity
Derivatives
Sunrise(b)

Date
11
Overview
FINANCIAL SERVICES

Date
12
3Q 2016 FINANCIAL SERVICES SUMMARY
BGC Financial Services Segment Highlights
General:
Pre-tax distributable earnings up over 2%
Pre-tax distributable earnings margin
expanded 350 basis points, despite the sale of
Trayport, which had pre-tax margins of
approximately 45%1
FENICS2:
FENICS revenues and pre-tax distributable
earnings comprise over 13% and over 28% of
Financial Services totals, respectively, net of
inter-company eliminations
FENICS pre-tax distributable earnings margins
expanded approximately 390 basis points
Fully electronic credit revenues up over 17%
as compared to a year ago
Data, software and post-trade up 16%
Voice/Hybrid:
Rates revenues up 1%
Quarterly Drivers
Lower global volumes across foreign
exchange, cash equities, equity derivatives,
shipping, and certain commodities markets
Implementation of initial uncleared derivative
margin requirements in the U.S., which
caused a $14 million year-on-year decline in
revenues during the last eight business days
of August
BGC reduced the number of less productive
brokers and salespeople in the segment by
over 140 year-on-year, reducing revenues but
increasing profitability
Distributable earnings and margins have
improved as integration synergies have
progressed, as well as from reduced overall
expenses across financial services
Trayport generated revenues of $18.9 million,
net of inter-company eliminations, in 3Q 2015,
compared to none in 3Q 2016 due to its sale
in 4Q 20151. For the trailing-twelve months ended September 30, 2015.
2. ”FENICS” includes “total brokerage revenues” related to fully electronic trading and data, software, and post-trade, all of which are reported within the Financial Services segment and excludes Trayport results. Results shown
by segment or business exclude revenues, earnings and/or losses associated with Corporate items.

Date
13
FENICS Net Revenue Growth1 3Q 2016 FENICS Breakdown2
BUSINESS OVERVIEW: FENICS
3Q16 FENICS revenues comprised over 13% of total Financial Services revenues versus
approximately 3% in 2010 (net of inter-company eliminations), when this was a new business
FENICS pre-tax distributable earnings comprised over 28% of total Financial Services pre-tax
distributable earnings during the third quarter (net of inter-company eliminations)
Fully Electronic revenues have grown as a percentage of Financial Services for five
consecutive years
Rates19%
Credit29%
F/X11%
Data, software and
post trade (inter-
company)21%
Data, software and
post trade20%
1. Excludes inter-company revenues, revenues related to eSpeed (sold in June 2013), and revenues related to Trayport (sold in December 2015). Results shown by segment or business exclude revenues, earnings and/or
losses associated with Corporate items.
2. Excludes a de minimis amount of revenue related to equities and other products
Note: Percentages may not sum to 100% due to rounding
(USD $000s)
0%
4%
8%
12%
16%
-
60,000
120,000
180,000
240,000
FY10 FY11 FY12 FY13 FY14 FY15 TTM3Q16
Fenics Revenue FENICS as % of Financial Services

Date
0
50
100
2008 2011 2015 2020
Global AUM$US Trillions
Pro
jecte
d
14
SELL-SIDE BALANCE SHEETS CONTINUE TO SHRINK EVEN AS
ASSETS UNDER MANAGEMENT AT BUY-SIDE SWELL
Buy-side AuM has grown by over 55% since
2008 fueling greater demand for market
liquidity, while large bank Balance Sheets and
RWAs are down ~30% and ~50%, respectively
since 2010, on a Basel 3 like-for-like basis
Expectations are that large banks will continue
to shrink their balance sheets further by up to
an additional 5% to 10%
Source: Morgan Stanley, Oliver Wyman and Boston Consulting Group
-65%
-50%
-35%
-20%
-5%
Changes in Sell-side Balance Sheet By Asset Class, 2010-2015
Further potential reductions

Date
BGC FS$2
BGC RE$1
All Other Wholesale & Execution Peers
$8
BGC, other wholesale financial brokerages, and their
execution peers currently comprise only a small
percentage of the total global sales & trading market
Reductions in Bank balance sheets may provide
opportunities for BGC’s Financial Services business
IB FICC + Equities
$164
Wholesale & Execution
$10
Other$51
2015 Global Sales & Trading Revenues ≈ $225B(in USD billions)
15
SMALL SLICE OF GLOBAL EXECUTION REVENUES = HUGE
POTENTIAL FOR IDBs
Source: Morgan Stanley and Oliver Wyman, company filings. “Other” = exchanges, CCPs, all other execution venues, market data, technology providers, and other 3rd parties. $225B figure does not
include primary issuance, CSDs, or custodians. Major Wholesale & Execution companies include: BGC, GFI, ICAP (for which 2015 = fiscal year-ended 3/31/2016) Tullett Prebon, Tradition, ICE’s
Creditex business, Marex Spectron, ITG, MarketAxess, Thomson Reuters’ Financial Risk Transactions revenue, and other non-public IDB estimated revenues. Results for BGC include $1B of Real
Estate Services revenues, which are excluded from both the $10B industry-wide Wholesale & Execution and the $225B Sales & Trading figures.
FY 2015 Wholesale & Execution Revenues(in USD billions)

Date
16
Overview
REAL ESTATE

Date
143,680 139,109
81,088 94,555
49,212 50,318
Q3 2015 Q3 2016
17
3Q 2016 Real Estate Segment BreakdownDrivers
NGKF Highlights 3Q 2016 Real Estate Segment Breakdown
BUSINESS OVERVIEW: REAL ESTATE SERVICES
3Q 2016 Real Estate Services revenue increased by 4% compared to 3Q 2015
Real estate capital markets revenue increased by 17% from the prior year, primarily due to organic growth
Management services & other revenue up 2%
Organic growth
Growing U.S. economy, low interest rates and accommodative monetary policy aids real estate growth
Improving U.S. jobs market
Overall activity industry-wide was generally down for leasing (-5%) and real estate capital markets (-2%) in 3Q 2016; NGKF capital markets significantly outpaced relevant industry-wide metrics
Leasing and other
services
49%
Real estate
capital markets
33%
Management
services &
other revenues
18%
Management services
and other revenues
Real estate capital
markets
Leasing and
other services
Note: Percentages may not sum to 100% due to rounding. Results shown by segment or business exclude revenues, earnings and/or losses associated with Corporate items
273,980283,982
(US
D $
000s)
Sources: Moody’s/Real Capital Analytics, and/or NGKF Research

Date -
200,000
400,000
600,000
800,000
1,000,000
TTM3Q14
FY2014
TTM3Q15
FY2015
TTM3Q16
Revenue
18
NGKF Revenue
(USD 000’s)
NGKF'S CONTINUED STRONG REVENUE GROWTH
NGKF revenues have grown from $648 million for the trailing twelve months ended September 2014 to
$1,040 million for the trailing twelve months ended September 30, 2016 representing a 27% compounded
annual growth rate (CAGR.)
Re
ve
nu
es
TTM = trailing twelve months

Date
NGKF REVENUES ARE DIVERSIFIED & A SIGNIFICANT PORTION ARE
RECURRING
Note: Largely contractual and/or recurring revenue includes certain parts of leasing, global corporate services, property management, and facilities management. 19
A significant percentage of NGKF’s revenues are from relatively predictable contractual sources (e.g.management services, global corporate services) and/or largely recurring sources (e.g. leasing)
Contractual management services revenues were up 15% YOY in 2015 & 4% YTD through 3Q16
Real estate capital markets brokerage revenues were up 115% YOY in 2015 & 22% YTD through3Q2016; over time, capital markets is expected to be a higher margin business
19
High Moderate Variable
Property & Facilities Mgmt.
Leasing (tenant rep)
Investment Sales
MA
RG
IN
Global Corporate Services
Leasing (agency)
Capital Raising
Lo
we
r A
ve
rag
e H
igh
er
RECURRENCE

Date
20
SIGNIFICANT OPPORTUNITIES FOR CONSOLIDATION & GROWTH
IN COMMERCIAL REAL ESTATE SERVICES
Other CRE Services
Companies $131B Top 5 Global +
NGKF$27B
Top 5 + NGKF
Global Full
Service CRE
Brokerages
$27B
Top 5 Global Full Service Brokerages + NGKF Market Share ≈ 17%
Sources: IBIS World, Bloomberg, CoStar and NGKF research. Top 5 CRE firms as measured by FY15 global gross revenue: 1) CBRE, 2) JLL, 3) Colliers, 4) Savills, 5) C&W (+ DTZ, as per a
November 2015 CoStar article).
FY 2015 Global Commercial Real Estate Services Revenues ≈ $158 Billion
NGKF = $1Bn
(U.S. Only)

Date
21
BGC PARTNERS
Conclusion

Date
CONCLUSION
Two business lines: Financial Services & Real Estate Services
Growing our highly profitable FENICS (fully electronic) business
Diversified revenues by geography & product class
Liquidity of approximately $840 million, not including expected future receipt of over $710
million in Nasdaq shares
Strong track record of accretive acquisitions and profitable hiring
Low interest rate environment benefits commercial real estate; potential rising interest rates
provide tailwinds to Financial Services
Intermediary-oriented, low-risk business model
We expect to pay out at least 75% of distributable earnings per share over time
Dividend of $0.16 per share, up 14% yr/yr, for a 6.6% qualified dividend yield
Considering steps to unlock the significant value of BGC's assets and businesses
Note: BGCP dividend yield and Nasdaq share value are calculated based on closing stock price at November 23, 2016
22

Date
SUM OF THE PARTS
Notes: NDAQ share price and Peer P/E & P/S multiples are as of 11/23/16 closing prices and Bloomberg consensus estimates. Peer estimates may or may not be based on GAAP results. Future NDAQ shares
are not recorded on BGC’s balance sheet. FENICS peers are ticker symbols BVMF3, CBOE, IAP (NEX) (excluded as outlier), CME, DB1, 388 HK (excluded as outlier), ICE, ITG (excluded as outlier), LSE, NDAQ,
and MKTX (excluded as outlier). NGKF Peers are CBG, JLL, CIGI, HF, MMI, and SVS. Voice/Hybrid/Other Peers are KCG, CFT (excluded for P/E) , TLPR and ICAP’s Global Broking Business (IGBB). IGBB
(excluded for P/E) estimate is based on the value of 310.3 million TLPR shares as at 11/23/2016 (TLPR’s agreed purchase price of IGBB), divided by the trailing twelve month (“TTM”) 9/30/2016 revenues IGBB.
In addition to the results shown above, BGC’s consolidated TTM results also include Corporate revenues of $32.6 million and a Corporate pre-tax distributable earnings loss of $64.6 million. FENICS revenues &
margins exclude Trayport. Voice/Hybrid/Other TTM results include $80 million of pre-tax distributable earnings related to the Nasdaq share earn-out.
Balance Sheet
Liquidity:(as of 9/30/2016)
≈$840 million
Nasdaq Earn-
out:
>$710 million
Balance Sheet
Long-term
Debt:(as of 9/30/2016)
≈ $969 million
Net Long-term
Liquidity:
>$581 million
+
-
=
FENICS(TTM 3Q 2016)
Real Estate(TTM 3Q 2016)
Voice/Hybrid/Other (TTM 3Q 2016)
Revenue:
Pre-Tax
Distributable
Earnings:
$255 million $1,040 million $1,281 million
$119 million $128 million
10.1x – 14.7x14.4x – 26.4x 11.7 – 12.7x
23
$224 million
Select Peers
P/E Range
(FY 17):
0.7x – 2.1x3.0x – 13.0x 0.6x – 1.7xPeer P/S
Range (TTM
3Q2016):

Q&A

Date
GAAP FinancialsGAAP FINANCIAL RESULTS

Date
26
SELECT CONSOLIDATED GAAP FINANCIAL RESULTS
Highlights of Consolidated GAAP Results (USD millions, except per share data) 3Q 2016 3Q 2015 Change (%)
Revenues under both U.S. Generally Accepted Accounting Principles (“GAAP”)
and Distributable Earnings$643.5 $685.3 (6.1)%
Income from operations before income taxes 104.5 83.3 25.5%
Net income for fully diluted shares 92.1 58.5 57.4%
Net income per fully diluted share 0.21 0.15 40.0%
Pre-tax earnings margin 16.2% 12.2%
Post-tax earnings margin 14.3% 8.5%

Date
27
BGC PARTNERS, INC. CONDENSED CONSOLIDATED STATEMENTS OF
OPERATIONS (IN THOUSANDS, EXCEPT PER SHARE DATA) (UNAUDITED)
(UNDER GAAP)
Revenues: 2016 2015 2016 2015
Commissions 496,265$ 521,264$ 1,469,940$ 1,424,357$
Principal transactions 76,332 73,841 255,219 238,958
Total brokerage revenues 572,597 595,105 1,725,159 1,663,315
Real estate management services 49,373 48,867 140,960 135,997
Fees from related parties 6,126 6,609 18,061 19,310
Data, software and post-trade 11,834 29,124 36,599 68,344
Interest income 2,792 1,387 8,952 6,253 Other revenues 783 4,203 4,770 8,774
Total revenues 643,505 685,295 1,934,501 1,901,993
Expenses:
Compensation and employee benefits 415,697 435,932 1,243,501 1,213,803 Allocations of net income and grant of exchangeability to limited partnership units and FPUs 58,771 50,667 132,670 113,921
Total compensation and employee benefits 474,468 486,599 1,376,171 1,327,724
Occupancy and equipment 46,513 51,300 146,026 157,373
Fees to related parties 5,060 4,876 14,803 13,564
Professional and consulting fees 15,549 15,201 45,160 53,702
Communications 30,568 31,503 92,076 88,550
Selling and promotion 22,613 23,370 73,725 70,609
Commissions and floor brokerage 8,493 8,865 27,633 25,616
Interest expense 15,383 16,944 43,465 51,285
Other expenses 19,709 26,802 66,204 75,022
Total non-compensation expenses 163,888 178,861 509,092 535,721
Total expenses 638,356 665,460 1,885,263 1,863,445
Other income (losses), net:
Gain (loss) on divestiture and sale of investments 7,044 2,717 7,044 3,396
Gains (losses) on equity method investments 683 1,042 1,741 2,678
Other income (loss) 91,653 59,728 98,748 92,259
Total other income (losses), net 99,380 63,487 107,533 98,333
Income (loss) from operations before income taxes 104,529 83,322 156,771 136,881
Provision (benefit) for income taxes 30,263 28,737 45,651 41,055
Consolidated net income (loss) 74,266$ 54,585$ 111,120$ 95,826$
Less: Net income (loss) attributable to noncontrolling interest in subsidiaries 13,384 16,214 20,854 34,053
Net income (loss) available to common stockholders 60,882$ 38,371$ 90,266$ 61,773$
Per share data:
Basic earnings per share
Net income (loss) available to common stockholders 60,882$ 38,371$ 90,266$ 61,773$
Basic earnings per share 0.22$ 0.15$ 0.33$ 0.26$
Basic weighted-average shares of common stock outstanding 278,601 252,354 276,144 239,856
Fully diluted earnings per share
Net income (loss) for fully diluted shares 92,121$ 58,538$ 139,683$ 93,119$
Fully diluted earnings per share 0.21$ 0.15$ 0.32$ 0.25$
Fully diluted weighted-average shares of common stock outstanding 429,761 394,026 434,713 370,147
Dividends declared per share of common stock 0.16$ 0.14$ 0.46$ 0.40$
Dividends declared and paid per share of common stock 0.16$ 0.14$ 0.46$ 0.40$
Three Months Ended September 30, Nine Months Ended September 30,
Date
28
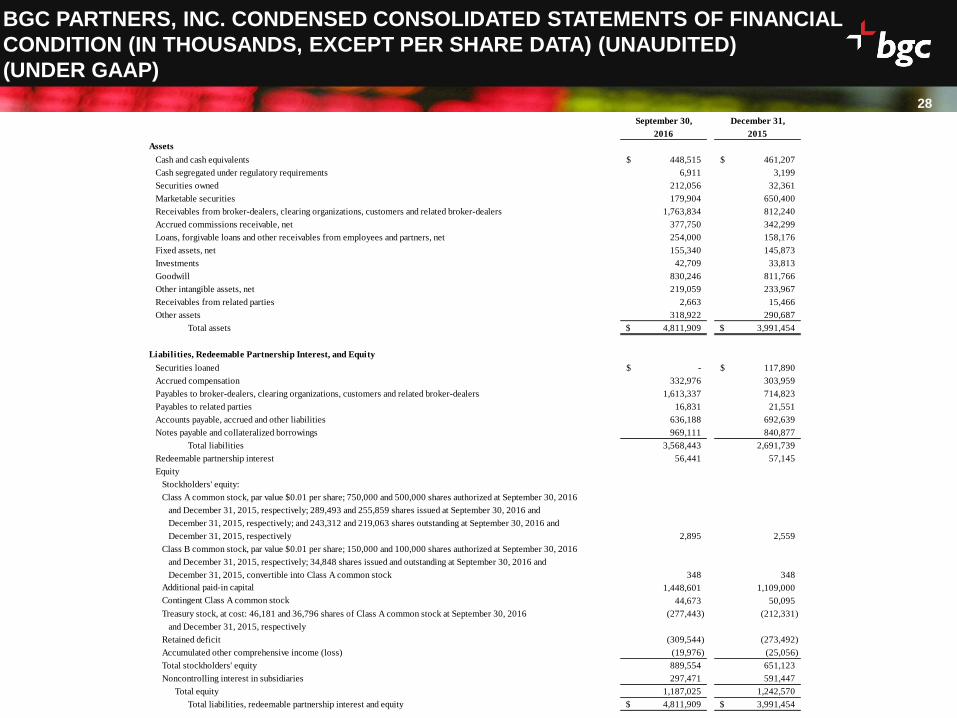
BGC PARTNERS, INC. CONDENSED CONSOLIDATED STATEMENTS OF FINANCIAL
CONDITION (IN THOUSANDS, EXCEPT PER SHARE DATA) (UNAUDITED)
(UNDER GAAP)
September 30, December 31,
2016 2015
Assets
Cash and cash equivalents 448,515$ 461,207$
Cash segregated under regulatory requirements 6,911 3,199
Securities owned 212,056 32,361
Marketable securities 179,904 650,400
Receivables from broker-dealers, clearing organizations, customers and related broker-dealers 1,763,834 812,240
Accrued commissions receivable, net 377,750 342,299
Loans, forgivable loans and other receivables from employees and partners, net 254,000 158,176
Fixed assets, net 155,340 145,873
Investments 42,709 33,813
Goodwill 830,246 811,766
Other intangible assets, net 219,059 233,967
Receivables from related parties 2,663 15,466
Other assets 318,922 290,687
Total assets 4,811,909$ 3,991,454$
Liabilities, Redeemable Partnership Interest, and Equity
Securities loaned -$ 117,890$
Accrued compensation 332,976 303,959
Payables to broker-dealers, clearing organizations, customers and related broker-dealers 1,613,337 714,823
Payables to related parties 16,831 21,551
Accounts payable, accrued and other liabilities 636,188 692,639
Notes payable and collateralized borrowings 969,111 840,877
Total liabilities 3,568,443 2,691,739
Redeemable partnership interest 56,441 57,145
Equity
Stockholders' equity:
Class A common stock, par value $0.01 per share; 750,000 and 500,000 shares authorized at September 30, 2016
and December 31, 2015, respectively; 289,493 and 255,859 shares issued at September 30, 2016 and
December 31, 2015, respectively; and 243,312 and 219,063 shares outstanding at September 30, 2016 and
December 31, 2015, respectively 2,895 2,559
Class B common stock, par value $0.01 per share; 150,000 and 100,000 shares authorized at September 30, 2016
and December 31, 2015, respectively; 34,848 shares issued and outstanding at September 30, 2016 and
December 31, 2015, convertible into Class A common stock 348 348
Additional paid-in capital 1,448,601 1,109,000
Contingent Class A common stock 44,673 50,095
Treasury stock, at cost: 46,181 and 36,796 shares of Class A common stock at September 30, 2016 (277,443) (212,331)
and December 31, 2015, respectively
Retained deficit (309,544) (273,492)
Accumulated other comprehensive income (loss) (19,976) (25,056)
Total stockholders' equity 889,554 651,123
Noncontrolling interest in subsidiaries 297,471 591,447
Total equity 1,187,025 1,242,570
Total liabilities, redeemable partnership interest and equity 4,811,909$ 3,991,454$

Date
APPENDIX

Date
30
STRONGLY CAPITALIZED; INVESTMENT GRADE CREDIT PROFILE
($ in '000s)
BGC Partners, Inc. 9/30/2016
Cash and Cash Equivalents $448,515
Securities Owned 212,056
Marketable Securities (net) 179,904
Total Liquidity $840,475
BGC Partners, Inc. and Subsidiaries Issuer Maturity 9/30/2016
8.375% Senior Notes GFI 7/19/2018 $249,078
Collateralized Borrowings BGC 3/13/2019 17,930
5.375% Senior Notes BGC 12/9/2019 296,837
5.125% Senior Notes BGC 5/27/2021 296,026
8.125% Senior Notes BGC 6/15/2042 109,240
Total Debt $969,111
BGC Partners, Inc. (Adj. EBITDA and Ratios are TTM 3Q 2016) 9/30/2016
Adjusted EBITDA $877,848
Leverage Ratio: Total Debt / Adjusted EBITDA 1.1x
Net Leverage Ratio: Net Debt / Adjusted EBITDA 0.1x
Adjusted EBITDA / Interest Expense 14.3x
Total Capital $1,243,466
2
1. Includes the approximately $407 million gain primarily related to the sale of Trayport in 4Q 2015
2. Does not include the over $735 million (at Sept 30, 2016 closing price) or the over $710 million (as of Nov 23, 2016 closing price) in Nasdaq shares expected to be received over time
3. Defined as “redeemable partnership interest,” “noncontrolling interest in subsidiaries,” and “total stockholders’ equity”
3
1

Date
31
FINANCIAL SERVICES REVENUE COMPOSITION
FINANCIAL SERVICES REVENUE BREAKOUT BY ASSET CLASS
113,630 112,384
87,999 73,191
67,515 67,221
54,879
47,061
46,314
39,076
10,213
11,834
3,895
1,374
18,911
Q3 2015 Q3 2016
$403,356
$352,141
Data, software, post-trade
Energy & commodities
Equity & other
Credit
Foreign Exchange
Rates
(16)%
(14)%
(0)%
(17)%
(1)%
1. BGC sold Trayport to Intercontinental Exchange in 4Q 2015
(13)%
% Change
16%
NMFTrayport1
Total Financial Services
(USD $000s)
Interest, fees from related parties,
and other revenue(65)%

Date
32
DISTRIBUTABLE EARNINGS EXPENSE & PRE-TAX MARGIN TRENDS
BGC Partners’ Compensation Ratio was 61.9% in 3Q 2016 vs. 62.9% in 3Q 2015; The compensation ratio improvement was
primarily driven by reductions in Financial Services compensation ratios, partially offset by investment in Real Estate Services
hiring, which generally has a higher compensation ratio
Non-compensation Ratio was 24.4% in 3Q 2016 down from 24.8% a year ago
Pre-tax margins expanded by 220 basis points from 3Q 2015 to 16.6%, as the integration of GFI has progressed
1,119
1,620
431 398
62.6% 62.9% 62.9% 61.9%
40%
50%
60%
70%
80%
90%
100%
$0
$500
$1,000
$1,500
$2,000
FY 2014 FY 2015 3Q 2015 3Q 2016
(US
D m
illi
on
s)
Compensation and Employee Benefits Compensation and Employee Benefits as % of Total Revenue
13.5%
14.3%14.4%
16.6%
25.9% 25.3% 24.8%24.4%
0%
5%
10%
15%
20%
25%
30%
10%
11%
12%
13%
14%
15%
16%
17%
FY 2014 FY 2015 3Q 2015 3Q 2016
Pre-tax Margin Non-compensation Expense as a % of Total Revenue

Date
33
BGC’S ECONOMIC OWNERSHIP AS OF SEPTEMBER 30, 2016
Public48%
Cantor20%
Employees, Executives, &
Directors32%
Note: Employees, Executives, and Directors ownership figure attributes all units (PSUs, FPUs, RSUs, etc.) and distribution rights to founding partners
& employees and also includes all A shares owned by BGC executives and directors. Cantor ownership includes all A and B shares owned by Cantor
as well as all Cantor exchangeable units and certain distribution rights. Public ownership includes all A shares not owned by executives or directors of
BGC. The above chart excludes shares related to convertible debt. The above chart excludes all formerly contingent shares that had not yet been
issued.

Date
34
DIFFERENCES BETWEEN CONSOLIDATED RESULTS FOR
DISTRIBUTABLE EARNINGS AND GAAP
34
Differences between Consolidated Results for Distributable Earnings and GAAP
The following sections describe the main differences between results as calculated for distributable earnings and GAAP for the periods discussed herein.
Differences between Other income (losses), net, for Distributable Earnings and GAAP
Under GAAP, gains of $69.9 million and $57.4 million due to the receipt of Nasdaq shares and related mark-to-market movements and/or hedging were
recognized as part of “Other income (losses), net”, in the third quarters of 2016 and 2015, respectively. In the third quarter of 2016 and 2015, BGC recorded
other income for distributable earnings related to the Nasdaq earn-out and associated mark-to-market movements and/or hedging of $17.5 million and $14.3
million, respectively. Items related to the Nasdaq earn-out are pro-rated over four quarters as “other income” for distributable earnings, but recognized as
incurred under GAAP.
In the third quarter of 2016, a gain of $3.9 million related the net realized and unrealized gain on the ICE shares received as part of the Trayport transaction was
included in GAAP “Other income (losses), net”. Approximately $1.0 million of this gain was recorded in the quarter as “other income” for distributable earnings.
There was no corresponding item a year earlier, as the Trayport sale occurred in December of 2015.
In the third quarters of 2016 and 2015, gains of $0.7 million and $1.0 million, respectively, related to BGC’s investments accounted for under the equity method,
were included as part of “Other income (losses), net” under GAAP but were excluded for distributable earnings.
For the third quarter of 2016, a gain of $18.3 million related to an adjustment of future earn-out payments that will no longer be required and a $7.1 million gain
related to the sale of a non-core Financial Services asset were included as part of “Other income (losses), net” under GAAP but were excluded for distributable
earnings. There were no similar items in the year-earlier period.
For the third quarter of 2016, an additional loss of $0.6 million was included in GAAP “Other income (losses), net”, but was excluded from distributable earnings
as part of “(Gains) and charges with respect to acquisitions, dispositions and/or resolutions of litigation, and other non-cash, non-dilutive items, net”. A year
earlier, gains of $5.1 million, primarily related to a gain on sale of certain marketable securities, were included in GAAP “Other income (losses), net”, but were
excluded for distributable earnings.
Differences between Compensation Expenses for Distributable Earnings and GAAP
In the third quarter of 2016, the difference between compensation expenses as calculated for GAAP and distributable earnings included non-cash, non-dilutive
net charges related to the $34.3 million in grants of exchangeability and $24.4 million in allocation of net income to limited partnership units and FPUs, as well as
charges related to additional reserves on employee loans of $15.1 million. In the prior year period, the difference between compensation expenses as calculated
for GAAP and distributable earnings included non-cash, and/or non-dilutive charges related to the $34.4 million in grants of exchangeability and $16.3 million
allocation of net income to limited partnership units and FPUs. There were no charges related to additional reserves on employee loans in the prior year period.
In addition, for the third quarter of 2016, $2.6 million in GAAP non-cash charges related to the amortization of GFI employee forgivable loans granted prior to the
closing of the January 11, 2016 back-end merger with GFI were also excluded from the calculation of pre-tax distributable earnings as part of “(Gains) and
charges with respect to acquisitions, dispositions and/or resolutions of litigation, and other non-cash, non-dilutive items, net”. A year earlier, the corresponding
charges excluded from distributable earnings were $5.1 million.
Date
DIFFERENCES BETWEEN CONSOLIDATED RESULTS FOR
DISTRIBUTABLE EARNINGS AND GAAP (CONTINUED)
Differences between Certain Non-compensation Expenses for Distributable Earnings and GAAP
The difference between non-compensation expenses in the third quarter of 2016 as calculated for GAAP and distributable earnings included
additional charges and gains with respect to acquisitions, dispositions and/or resolutions of litigation, and other non-cash, non-dilutive items,
net. These included $4.8 million of non-cash GAAP charges related to amortization of intangibles; $1.6 million of acquisition related costs,
and various other GAAP items that together came to a net charge of $0.4 million.
The difference between non-compensation expenses in the third quarter of 2015 as calculated for GAAP and distributable earnings included
additional charges and gains with respect to acquisitions, dispositions and/or resolutions of litigation, and other non-cash, non-dilutive items,
net. These included $7.6 million of non-cash GAAP charges related to amortization of intangibles; $1.1 million of non-cash GAAP fixed asset
impairment charges and various other GAAP items that together came to a net charge of $0.4 million.
Differences between Taxes for Distributable Earnings and GAAP
BGC’s GAAP provision for income taxes from 2016 forward is calculated based on an annualized methodology. The Company’s GAAP
provision for income taxes was $30.3 million and $28.7 million for the third quarter of 2016 and 2015, respectively. The Company includes
additional tax-deductible items when calculating the provision for taxes with respect to distributable earnings using an annualized
methodology. These include tax-deductions related to equity-based compensation with respect to limited partnership unit exchange,
employee loan amortization, charitable contributions, and certain net-operating loss carryforwards. The provision for income taxes with
respect to distributable earnings was adjusted by $14.0 million and $13.9 million for the third quarter of 2016 and 2015, respectively.
As a result, the provision for income taxes with respect to distributable earnings was $16.2 million and $14.9 million for the third quarter of
2016 and 2015, respectively.
35
Date
36
DISTRIBUTABLE EARNINGS DEFINED
36
Distributable Earnings Defined
BGC Partners uses non-GAAP financial measures including, but not limited to, "pre-tax distributable earnings” and "post-tax distributable earnings", which are supplemental
measures of operating results that are used by management to evaluate the financial performance of the Company and its consolidated subsidiaries. BGC believes that
distributable earnings best reflect the operating earnings generated by the Company on a consolidated basis and are the earnings which management considers available for,
among other things, distribution to BGC Partners, Inc. and its common stockholders, as well as to holders of BGC Holdings partnership units during any period.
As compared with "income (loss) from operations before income taxes”, and "net income (loss) per fully diluted share”, all prepared in accordance with GAAP, distributable
earnings calculations primarily exclude certain non-cash compensation and other expenses that generally do not involve the receipt or outlay of cash by the Company and/or
which do not dilute existing stockholders, as described below. In addition, distributable earnings calculations exclude certain gains and charges that management believes do
not best reflect the ordinary operating results of BGC.
Adjustments Made to Calculate Pre-Tax Distributable Earnings
Pre-tax distributable earnings are defined as GAAP income (loss) from operations before income taxes and noncontrolling interest in subsidiaries excluding items, such as:
• Non-cash equity-based compensation charges related to limited partnership unit exchange or conversion.
• Non-cash asset impairment charges, if any.
• Non-cash compensation charges for items granted or issued pre-merger with respect to certain mergers or acquisitions by BGC Partners, Inc. To date, these mergers
have only included those with and into eSpeed, Inc. and the back-end merger with GFI Group Inc.
Distributable earnings calculations also exclude certain unusual, one-time or non-recurring items, if any. These charges are excluded from distributable earnings because the
Company views excluding such charges as a better reflection of the ongoing, ordinary operations of BGC.
In addition to the above items, allocations of net income to founding/working partner and other limited partnership units are excluded from calculations of pre-tax distributable
earnings. Such allocations represent the pro-rata portion of pre-tax earnings available to such unit holders. These units are in the fully diluted share count, and are
exchangeable on a one-to-one basis into common stock. As these units are exchanged to common shares, unit holders become entitled to cash dividends rather than cash
distributions. The Company views such allocations as intellectually similar to dividends on common shares. Because dividends paid to common shares are not an expense
under GAAP, management believes similar allocations of income to unit holders should also be excluded when calculating distributable earnings performance measures.
BGC’s definition of distributable earnings also excludes certain gains and charges with respect to acquisitions, dispositions, or resolutions of litigation. This includes the one-
time gains related to the Nasdaq and Trayport transactions. Management believes that excluding such gains and charges also best reflects the ongoing operating
performance of BGC.
However, the payments associated with BGC’s expected annual receipt of Nasdaq stock and related mark-to-market gains or losses are anticipated to be included in the
Company’s calculation of distributable earnings for the following reasons:
• Nasdaq is expected to pay BGC in an equal amount of stock on a regular basis for a 15 year period beginning in 2013 as part of that transaction;
• The Nasdaq earn-out largely replaced the generally recurring quarterly earnings BGC generated from eSpeed; and
• The Company intends to pay dividends and distributions to common stockholders and/or unit holders based on all other income related to the receipt of the earn-out.
Date
DISTRIBUTABLE EARNINGS DEFINED (CONTINUED)
To make period-to-period comparisons more meaningful, one-quarter of each annual Nasdaq contingent earn-out amount, as well as gains or losses with respect to associated
mark-to-market movements and/or hedging, will be included in the Company’s calculation of distributable earnings each quarter as “other income”.
The Company also treats gains or losses related to mark-to-market movements and/or hedging with respect to any remaining ICE shares in a consistent manner with the
treatment of Nasdaq shares when calculating distributable earnings.
Investors and analysts should note that, due to the large gain recorded with respect to the Trayport sale in December, 2015, and the closing of the back-end merger with GFI in
January, 2016, non-cash charges related to the amortization of intangibles with respect to acquisitions are also excluded from the calculation of pre-tax distributable earnings.
Adjustments Made to Calculate Post-Tax Distributable Earnings
Since distributable earnings are calculated on a pre-tax basis, management intends to also report post-tax distributable earnings to fully diluted shareholders. Post-tax
distributable earnings to fully diluted shareholders are defined as pre-tax distributable earnings, less noncontrolling interest in subsidiaries, and reduced by the provision for
taxes as described below.
The Company’s calculation of the provision for taxes on an annualized basis starts with GAAP income tax provision, adjusted to reflect tax-deductible items. Management uses
this non-GAAP provision for taxes in part to help it to evaluate, among other things, the overall performance of the business, make decisions with respect to the Company’s
operations, and to determine the amount of dividends paid to common shareholders.
The provision for taxes with respect to distributable earnings includes additional tax-deductible items including limited partnership unit exchange or conversion, employee loan
amortization, charitable contributions, and certain net-operating loss carryforwards.
BGC incurs income tax expenses based on the location, legal structure and jurisdictional taxing authorities of each of its subsidiaries. Certain of the Company’s entities are
taxed as U.S. partnerships and are subject to the Unincorporated Business Tax (“UBT”) in New York City. Any U.S. federal and state income tax liability or benefit related to
the partnership income or loss, with the exception of UBT, rests with the unit holders rather than with the partnership entity. The Company’s consolidated financial statements
include U.S. federal, state and local income taxes on the Company’s allocable share of the U.S. results of operations. Outside of the U.S., BGC operates principally through
subsidiary corporations subject to local income taxes. For these reasons, taxes for distributable earnings are presented to show the tax provision the consolidated Company
would expect to pay if 100 percent of earnings were taxed at global corporate rates.
Calculations of Pre-tax and Post-Tax Distributable Earnings per Share
BGC’s distributable earnings per share calculations assume either that:
The fully diluted share count includes the shares related to any dilutive instruments, such as the Convertible Senior Notes, but excludes the associated interest expense, net of
tax, when the impact would be dilutive; or
The fully diluted share count excludes the shares related to these instruments, but includes the associated interest expense, net of tax.
The share count for distributable earnings excludes shares expected to be issued in future periods but not yet eligible to receive dividends and/or distributions.
37

Date
38
Each quarter, the dividend to BGC’s common stockholders is expected to be determined by the Company’s Board of Directors with reference to a number of factors,
including post-tax distributable earnings per fully diluted share. In addition to the Company’s quarterly dividend to common stockholders, BGC Partners expects to
pay a pro-rata distribution of net income to BGC Holdings founding/working partner and other limited partnership units, as well as to Cantor for its non-controlling
interest. The amount of this net income, and therefore of these payments, is expected to be determined using the above definition of pre-tax distributable earnings
per share.
Other Matters with Respect to Distributable Earnings
The term “distributable earnings” should not be considered in isolation or as an alternative to GAAP net income (loss). The Company views distributable earnings as
a metric that is not indicative of liquidity or the cash available to fund its operations, but rather as a performance measure.
Pre- and post-tax distributable earnings are not intended to replace the Company’s presentation of GAAP financial results. However, management believes that they
help provide investors with a clearer understanding of BGC Partners’ financial performance and offer useful information to bo th management and investors regarding
certain financial and business trends related to the Company’s financial condition and results of operations. Management bel ieves that distributable earnings and the
GAAP measures of financial performance should be considered together.
BGC anticipates providing forward-looking quarterly guidance for GAAP revenues and for certain distributable earnings measures from time to time. However, the
Company does not anticipate providing a quarterly outlook for other GAAP results. This is because certain GAAP items, which are excluded from distributable
earnings, are difficult to forecast with precision before the end of each quarter. The Company therefore believes that it is not possible to forecast quarterly GAAP
results or to quantitatively reconcile GAAP results to non-GAAP results with sufficient precision unless BGC makes unreasonable efforts.
The items that are difficult to predict on a quarterly basis with precision and which can have a material impact on the Company’s GAAP results include, but are not
limited, to the following:
Allocations of net income and grants of exchangeability to limited partnership units and FPUs, which are determined at the discretion of management throughout and
up to the period-end.
The impact of certain marketable securities, as well as any gains or losses related to associated mark-to-market movements and/or hedging. These items are
calculated using period-end closing prices.
Non-cash asset impairment charges, which are calculated and analyzed based on the period-end values of the underlying assets. These amounts may not be known
until after period-end.
Acquisitions, dispositions and/or resolutions of litigation which are fluid and unpredictable in nature.
For more information on this topic, please see certain tables in the most recent BGC financial results press release including “Reconciliation of GAAP Income (Loss)
to Distributable Earnings”. These tables provide summary reconciliations between pre- and post-tax distributable earnings and the corresponding GAAP measures
for the Company.
DISTRIBUTABLE EARNINGS DEFINED (CONTINUED)

Date
39
ADJUSTED EBITDA DEFINED
Adjusted EBITDA Defined
BGC also provides an additional non-GAAP financial performance measure, “adjusted EBITDA”, which it defines as GAAP “Net income
(loss) available to common stockholders”, adjusted to add back the following items:
• Interest expense;
• Fixed asset depreciation and intangible asset amortization;
• Impairment charges;
• Employee loan amortization and reserves on employee loans;
• Provision (benefit) for income taxes;
• Net income (loss) attributable to noncontrolling interest in subsidiaries;
• Non-cash charges relating to grants of exchangeability to limited partnership interests;
• Non-cash charges related to issuance of restricted shares; and
• Non-cash earnings or losses related to BGC’s equity investments.
The Company’s management believes that adjusted EBITDA is useful in evaluating BGC’s operating performance, because the calculation
of this measure generally eliminates the effects of financing and income taxes and the accounting effects of capital spending and
acquisitions, which would include impairment charges of goodwill and intangibles created from acquisitions. Such items may vary for
different companies for reasons unrelated to overall operating performance. As a result, the Company’s management uses these
measures to evaluate operating performance and for other discretionary purposes. BGC believes that adjusted EBITDA is useful to
investors to assist them in getting a more complete picture of the Company’s financial results and operations.
Since adjusted EBITDA is not a recognized measurement under GAAP, investors should use adjusted EBITDA in addition to GAAP
measures of net income when analyzing BGC’s operating performance. Because not all companies use identical EBITDA calculations, the
Company’s presentation of adjusted EBITDA may not be comparable to similarly titled measures of other companies. Furthermore,
adjusted EBITDA is not intended to be a measure of free cash flow or GAAP cash flow from operations, because adjusted EBITDA does
not consider certain cash requirements, such as tax and debt service payments.
For a reconciliation of adjusted EBITDA to GAAP “Net income (loss) available to common stockholders”, the most comparable financial
measure calculated and presented in accordance with GAAP, see the section of this document titled "Reconciliation of GAAP Income
(Loss) to Adjusted EBITDA”.
39
Date
40
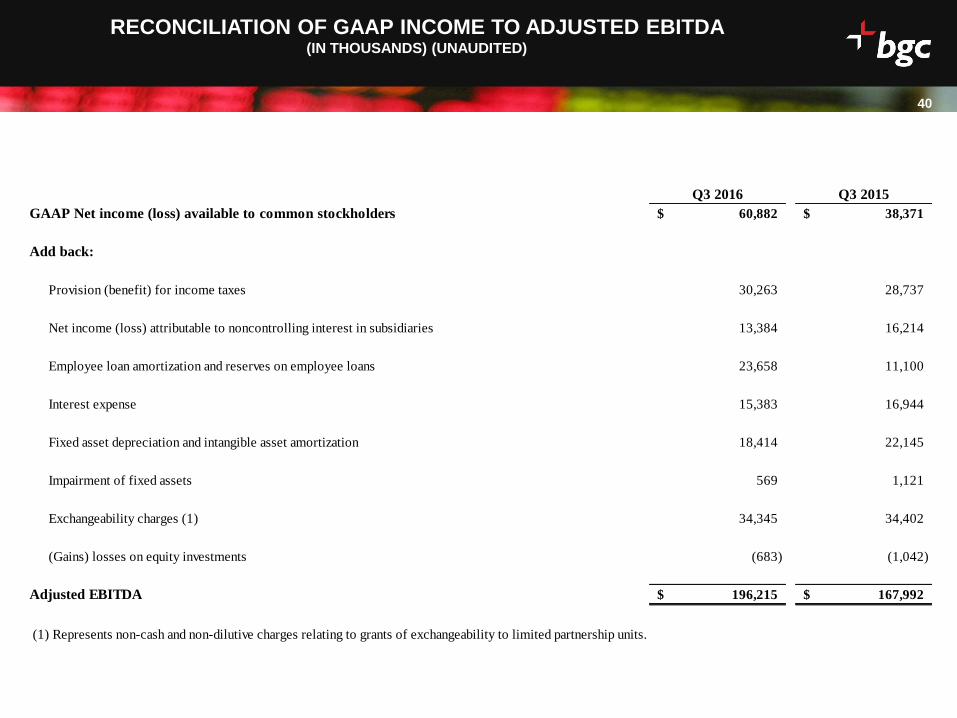
RECONCILIATION OF GAAP INCOME TO ADJUSTED EBITDA (IN THOUSANDS) (UNAUDITED)
Q3 2016 Q3 2015
GAAP Net income (loss) available to common stockholders 60,882$ 38,371$
Add back:
Provision (benefit) for income taxes 30,263 28,737
Net income (loss) attributable to noncontrolling interest in subsidiaries 13,384 16,214
Employee loan amortization and reserves on employee loans 23,658 11,100
Interest expense 15,383 16,944
Fixed asset depreciation and intangible asset amortization 18,414 22,145
Impairment of fixed assets 569 1,121
Exchangeability charges (1) 34,345 34,402
(Gains) losses on equity investments (683) (1,042)
Adjusted EBITDA 196,215$ 167,992$
(1) Represents non-cash and non-dilutive charges relating to grants of exchangeability to limited partnership units.

Date
41
RECONCILIATION OF GAAP INCOME (LOSS) TO DISTRIBUTABLE EARNINGS AND
GAAP FULLY DILUTED EPS TO POST-TAX DISTRIBUTABLE EPS (IN THOUSANDS, EXCEPT PER SHARE DATA) (UNAUDITED)
Q3 2016 Q3 2015
GAAP income (loss) before income taxes 104,529$ 83,322$
Pre-tax adjustments:
Non-cash (gains) losses related to equity investments, net (683) (1,042)
Allocations of net income and grant of exchangeability to limited partnership units and FPUs 58,771 50,667
Nasdaq earn-out income (a) (52,420) (43,025)
(Gains) and charges with respect to acquisitions, dispositions and / or resolutions of litigation, and other
non-cash, non-dilutive items, net (3,360) 9,090
Total pre-tax adjustments 2,308 15,690
Pre-tax distributable earnings 106,837$ 99,012$
GAAP net income (loss) available to common stockholders 60,882$ 38,371$
Allocation of net income (loss) to noncontrolling interest in subsidiaries 12,620 11,362
Total pre-tax adjustments (from above) 2,308 15,690
Income tax adjustment to reflect distributable earnings taxes 14,024 13,885
Post-tax distributable earnings 89,834$ 79,308$
Per Share Data
GAAP fully diluted earnings per share 0.21$ 0.15$
Less: Allocations of net income to limited partnership units and FPUs, net of tax (0.04) (0.01)
Total pre-tax adjustments (from above) 0.01 0.04
Income tax adjustment to reflect distributable earnings taxes 0.03 0.04
Post-tax distributable earnings per share (b) 0.21$ 0.21$
Pre-tax distributable earnings per share (b) 0.25$ 0.26$
Fully diluted weighted-average shares of common stock outstanding 429,761 394,026
Notes and Assumptions
(a) Distributable earnings for Q3 2016 and Q3 2015 includes $(52.4) million and $(43.0) million, respectively, of adjustments associated with the Nasdaq
transaction. For Q3 2016 and Q3 2015 income (loss) related to the Nasdaq earn-out shares was $69.9 million and $57.4 million for GAAP
and $17.5 million and $14.3 million for distributable earnings, respectively.
(b) On July 29, 2011, BGC Partners issued $160 million in 4.50 percent Convertible Senior Notes due 2016, which matured and were settled for cash
and 6.9 thousand Class A common shares in Q3 2016. The distributable earnings per share calculations for Q3 2016 and Q3 2015 include 2.1 million
and 16.3 million shares, respectively, underlying these Notes. The distributable earnings per share calculations exclude the interest expense, net of tax,
associated with these Notes.
Note: Certain numbers may not add due to rounding.
Date
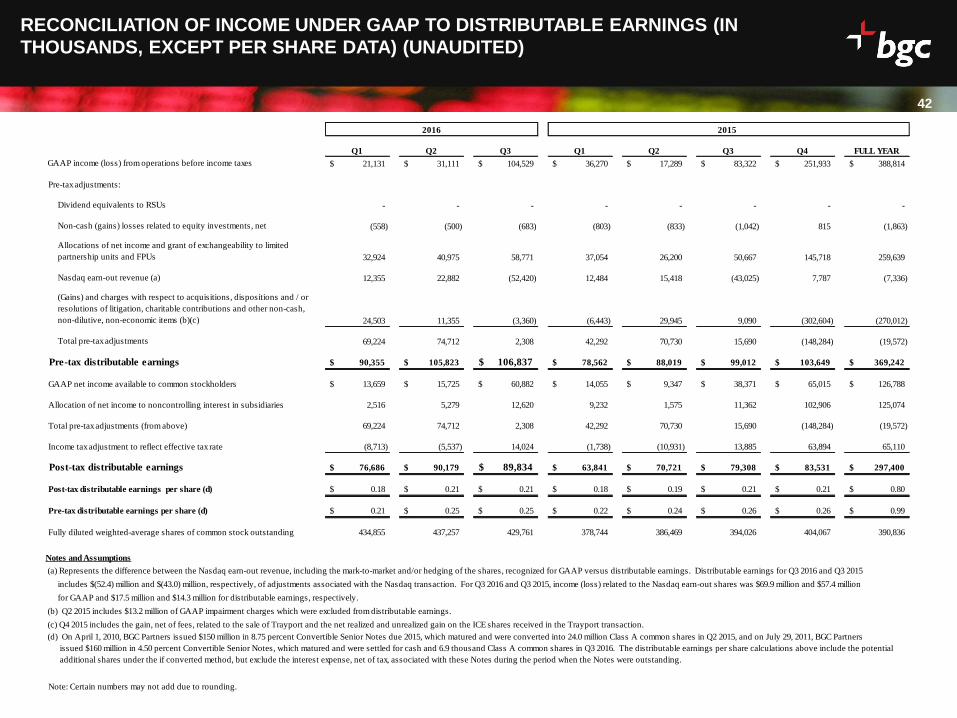
42
RECONCILIATION OF INCOME UNDER GAAP TO DISTRIBUTABLE EARNINGS (IN
THOUSANDS, EXCEPT PER SHARE DATA) (UNAUDITED)
Q1 Q2 Q3 Q1 Q2 Q3 Q4 FULL YEAR
GAAP income (loss) from operations before income taxes 21,131$ 31,111$ 104,529$ 36,270$ 17,289$ 83,322$ 251,933$ 388,814$
Pre-tax adjustments:
Dividend equivalents to RSUs - - - - - - - -
Non-cash (gains) losses related to equity investments, net (558) (500) (683) (803) (833) (1,042) 815 (1,863)
Allocations of net income and grant of exchangeability to limited
partnership units and FPUs 32,924 40,975 58,771 37,054 26,200 50,667 145,718 259,639
Nasdaq earn-out revenue (a) 12,355 22,882 (52,420) 12,484 15,418 (43,025) 7,787 (7,336)
(Gains) and charges with respect to acquisitions, dispositions and / or
resolutions of litigation, charitable contributions and other non-cash,
non-dilutive, non-economic items (b)(c) 24,503 11,355 (3,360) (6,443) 29,945 9,090 (302,604) (270,012)
Total pre-tax adjustments 69,224 74,712 2,308 42,292 70,730 15,690 (148,284) (19,572)
Pre-tax distributable earnings 90,355$ 105,823$ 106,837$ 78,562$ 88,019$ 99,012$ 103,649$ 369,242$
GAAP net income available to common stockholders 13,659$ 15,725$ 60,882$ 14,055$ 9,347$ 38,371$ 65,015$ 126,788$
Allocation of net income to noncontrolling interest in subsidiaries 2,516 5,279 12,620 9,232 1,575 11,362 102,906 125,074
Total pre-tax adjustments (from above) 69,224 74,712 2,308 42,292 70,730 15,690 (148,284) (19,572)
Income tax adjustment to reflect effective tax rate (8,713) (5,537) 14,024 (1,738) (10,931) 13,885 63,894 65,110
Post-tax distributable earnings 76,686$ 90,179$ 89,834$ 63,841$ 70,721$ 79,308$ 83,531$ 297,400$
Post-tax distributable earnings per share (d) 0.18$ 0.21$ 0.21$ 0.18$ 0.19$ 0.21$ 0.21$ 0.80$
Pre-tax distributable earnings per share (d) 0.21$ 0.25$ 0.25$ 0.22$ 0.24$ 0.26$ 0.26$ 0.99$
Fully diluted weighted-average shares of common stock outstanding 434,855 437,257 429,761 378,744 386,469 394,026 404,067 390,836
Notes and Assumptions
(a) Represents the difference between the Nasdaq earn-out revenue, including the mark-to-market and/or hedging of the shares, recognized for GAAP versus distributable earnings. Distributable earnings for Q3 2016 and Q3 2015
includes $(52.4) million and $(43.0) million, respectively, of adjustments associated with the Nasdaq transaction. For Q3 2016 and Q3 2015, income (loss) related to the Nasdaq earn-out shares was $69.9 million and $57.4 million
for GAAP and $17.5 million and $14.3 million for distributable earnings, respectively.
(b) Q2 2015 includes $13.2 million of GAAP impairment charges which were excluded from distributable earnings.
(c) Q4 2015 includes the gain, net of fees, related to the sale of Trayport and the net realized and unrealized gain on the ICE shares received in the Trayport transaction.
(d) On April 1, 2010, BGC Partners issued $150 million in 8.75 percent Convertible Senior Notes due 2015, which matured and were converted into 24.0 million Class A common shares in Q2 2015, and on July 29, 2011, BGC Partners
issued $160 million in 4.50 percent Convertible Senior Notes, which matured and were settled for cash and 6.9 thousand Class A common shares in Q3 2016. The distributable earnings per share calculations above include the potential
additional shares under the if converted method, but exclude the interest expense, net of tax, associated with these Notes during the period when the Notes were outstanding.
Note: Certain numbers may not add due to rounding.
2016 2015

Date
43
RECONCILIATION OF INCOME UNDER GAAP TO DISTRIBUTABLE EARNINGS (IN
THOUSANDS, EXCEPT PER SHARE DATA) (UNAUDITED) (CONTINUED)
Q1 Q2 Q3 Q4 FULL YEAR
GAAP income (loss) from operations before income taxes 11,246$ 14,915$ 29,937$ (59,286)$ (3,188)$
Pre-tax adjustments: `
Dividend equivalents to RSUs 3 - - - 3
Non-cash (gains) losses related to equity investments, net 2,275 1,288 2,640 2,418 8,621
Allocations of net income and grant of exchangeability to limited
partnership units and FPUs 31,323 22,402 52,516 30,392 136,633
Nasdaq earn-out revenue (a) 11,612 9,389 (34,419) 6,517 (6,901)
(Gains) and charges with respect to acquisitions, dispositions and / or
resolutions of litigation, charitable contributions and other non-cash,
non-dilutive, non-economic items (b)(c) (367) 3,384 14,621 88,379 106,017
Total pre-tax adjustments 44,846 36,463 35,358 127,706 244,373
Pre-tax distributable earnings 56,092$ 51,378$ 65,295$ 68,420$ 241,185$
GAAP net income available to common stockholders 8,008$ 7,601$ 7,211$ (18,685)$ 4,135$
Allocation of net income to noncontrolling interest in subsidiaries 1,933 2,174 3,991 (19,128) (11,030) `
Total pre-tax adjustments (from above) 44,846 36,463 35,358 127,706 244,373
Income tax adjustment to reflect effective tax rate (7,670) (4,107) 9,014 (32,764) (35,527)
Post-tax distributable earnings 47,117$ 42,131$ 55,574$ 57,129$ 201,951$
Post-tax distributable earnings per share (d) 0.14$ 0.13$ 0.16$ 0.17$ 0.61$
Pre-tax distributable earnings per share (d) 0.17$ 0.16$ 0.19$ 0.20$ 0.72$
Fully diluted weighted-average shares of common stock outstanding 362,087 366,674 371,360 374,256 368,571
2014
Date
44
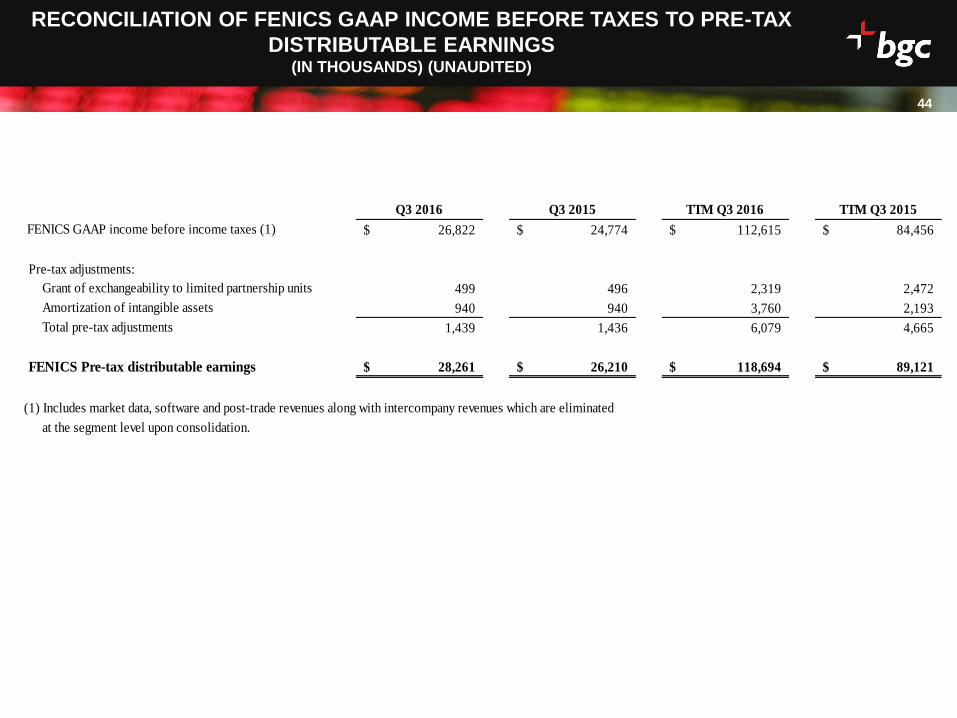
RECONCILIATION OF FENICS GAAP INCOME BEFORE TAXES TO PRE-TAX
DISTRIBUTABLE EARNINGS (IN THOUSANDS) (UNAUDITED)
Q3 2016 Q3 2015 TTM Q3 2016 TTM Q3 2015
FENICS GAAP income before income taxes (1) 26,822$ 24,774$ 112,615$ 84,456$
Pre-tax adjustments:
Grant of exchangeability to limited partnership units 499 496 2,319 2,472
Amortization of intangible assets 940 940 3,760 2,193
Total pre-tax adjustments 1,439 1,436 6,079 4,665
FENICS Pre-tax distributable earnings 28,261$ 26,210$ 118,694$ 89,121$
(1) Includes market data, software and post-trade revenues along with intercompany revenues which are eliminated
at the segment level upon consolidation.

Date
45
45
FULLY DILUTED WEIGHTED-AVERAGE SHARE COUNT FOR GAAP AND DISTRIBUTABLE EARNINGS (IN THOUSANDS) (UNAUDITED)
Q3 2016 Q3 2015
Common stock outstanding 278,601 252,354
Limited partnership units 80,804 57,726
Cantor units 50,558 48,783
Founding partner units 14,519 16,712
4.50% Convertible debt shares 2,121 16,260
RSUs 423 666
Other 2,735 1,525
Fully diluted weighted-average share count GAAP and DE 429,761 394,026

Date
46
SEGMENT DISCLOSURE – Q3 2016 VS Q3 2015(IN THOUSANDS) (UNAUDITED)
Financial
Services
Real
Estate Services
Corporate
Items
GAAP Pre-tax
Earnings
Financial
Services
Real
Estate Services
Corporate
Items
GAAP Pre-tax
Earnings
Total revenues $ 352,141 $ 283,982 $ 7,382 $ 643,505 $ 403,356 $ 273,980 $ 7,959 $ 685,295
Total expenses 290,989 246,366 101,001 638,356 344,869 233,202 87,389 665,460
Total other income (losses), net 69,893 - 29,487 99,380 57,366 - 6,121 63,487
Income (loss) from operations before income
taxes $ 131,045 $ 37,616 $ (64,132) $ 104,529 $ 115,853 $ 40,778 $ (73,309) $ 83,322
Pre-tax adjustments:
Non-cash (gains) losses related to equity
investments, net - - (683) (683) - - (1,042) (1,042)
Allocations of net income and grant of
exchangeability to limited partnership units and
FPUs - - 58,771 58,771 - - 50,667 50,667
Nasdaq earn-out income (52,420) - - (52,420) (43,025) - - (43,025)
(Gains) and charges with respect to acquisitions,
dispositions and / or resolutions of litigation, and
other non-cash, non-dilutive items, net 6,279 703 (10,342) (3,360) 10,184 2,136 (3,230) 9,090
Total pre-tax adjustments (46,141) 703 47,746 2,308 (32,841) 2,136 46,395 15,690
Pre-tax distributable earnings $ 84,904 $ 38,319 $ (16,386) $ 106,837 $ 83,012 $ 42,914 $ (26,914) $ 99,012
Q3 2016 Q3 2015

Date
47
47
LIQUIDITY ANALYSIS (IN THOUSANDS) (UNAUDITED)
September 30, 2016 December 31, 2015
Cash and cash equivalents 448,515$ 461,207$
Securities owned (1) 212,056 32,361
Marketable securities (2) (3) 179,904 532,510
Total 840,475$ 1,026,078$
(1) As of September 30, 2016, Securities owned primarily consists of U.S. Treasury bills.
(2) As of December 31, 2015, $117.9 million of Marketable securities on our balance sheet
had been lent out in a Securities Loaned transaction and therefore are not included in
this Liquidity Analysis.
(3) The significant decrease in Marketable securities during the nine months ended
September 30, 2016 was primarily due to selling a portion of our position in ICE.

Date
4848
bgcpartners.com
twitter.com/bgcpartners
linkedin.com/company/bgc-partners
Investor Contact:
Jason McGruder
+1 212-829-4988