Embed Size (px)
Citation preview
© 2015 NEXON Co., Ltd. All Rights Reserved.
NEXON Co., Ltd.
Investor Presentation
Q3 2015
November 13, 2015
© 2015 NEXON Co., Ltd. All Rights Reserved.
Owen MahoneyPresident and Chief Executive Officer
2

© 2015 NEXON Co., Ltd. All Rights Reserved.3
Q3 Key Highlights
Q3 results exceeded our outlook
– PC: Strong execution of key titles in China and Korea, particularly during September
– Mobile:
– Successful launch of DomiNations in Asia, particularly in Korea
– Solid performance of EA SPORTSTM FIFA Online 3 M around September Korean Thanksgiving holiday
Enhanced partnerships
– Mobile games based on TitanfallTM IP with Respawn Entertainment and Particle City
– TERA mobile1 with Bluehole Studio
– Strategic publishing and operation agreement with QC Games
1 Developing mobile games based on the original IPs.
© 2015 NEXON Co., Ltd. All Rights Reserved.
Shiro UemuraChief Financial Officer
4
© 2015 NEXON Co., Ltd. All Rights Reserved.5
Q3 2015 Results

© 2015 NEXON Co., Ltd. All Rights Reserved.6
Q3 Highlights
Revenues: ¥49.8 billion, up 9% year-over-year on an as-reported basis, up 5% on a constant currency1 basis
– Exceeded our outlook
– PC revenues exceeded outlook, driven by higher-than-expected sales from Dungeon&Fighter in China
– Mobile revenues near the high end of outlook, driven by DomiNations in Korea and EA SPORTSTM FIFA Online 3 M
Operating income: ¥18.4 billion, up 22% year-over-year. Exceeded outlook, primarily driven by:
– Strong performance of Dungeon&Fighter in China
– Lower-than-planned HR costs
Net income2: ¥19.2 billion, up 41% year-over-year. Outperformance primarily due to higher-than-expected
operating income and FX gains
1 Constant currency is a non-GAAP measure used to show performance unaffected by fluctuations in foreign currency exchange rates. Constant currency basis amounts are calculated
using the average foreign currency exchange rates for the comparable period in the prior year and applied to the current period. As an example, Neople, the Korean entity that develops
Dungeon&Fighter for China, records its revenues in South Korean Won. The constant currency figures for the third quarter show what Neople revenues would have been had the KRW/JPY
exchange rate not changed from last year’s third quarter.2 Net income refers to net income attributable to owners of the parent, as stated in Nexon’s consolidated financial results.

© 2015 NEXON Co., Ltd. All Rights Reserved.7
Q3 Financial Results
1 PC revenue includes revenues other than PC/mobile revenues.2 Net income refers to net income attributable to owners of the parent, as stated in Nexon’s consolidated financial results.
(Unit: ¥ millions, except per share data)
Q3 2014 Q3 2015 YoY %
Low end High end
Revenues ¥45,613 ¥46,305 ¥49,734 ¥49,811 9%
PC1 35,931 36,875 39,201 39,481 10%
Mobile 9,682 9,430 10,533 10,330 7%
Japan 5,570 3,747 (33%)
ex-Japan 4,112 6,583 60%
Operating income 15,124 14,335 17,254 18,436 22%
Net income2 13,585 12,942 15,327 19,184 41%
Earnings per share 31.49 30.10 35.65 44.47
Cash and cash equivalents 114,155 128,236
Exchange rates
100 KRW/JPY 10.15 10.78 10.78 10.46
CNY/JPY 16.87 20.08 20.08 19.48
USD/JPY 103.92 123.25 123.25 122.23
Q3 2015 Outlook

© 2015 NEXON Co., Ltd. All Rights Reserved.
China41%
Korea 40%
Japan 10%
North America
4%
Europe and Others
5%
2
Q3 2015 Revenue by Region1
1 Based on the regions in which revenues originate; not a representation of revenues according to Nexon entities.2 Europe and Others includes other Asian countries and South American countries.3 PC revenue includes revenues other than PC/mobile revenues.4 Constant currency is a non-GAAP measure used to show performance unaffected by fluctuations in foreign currency exchange rates.
Constant currency basis amounts are calculated using the average foreign currency exchange rates for the comparable period in the prior year
and applied to the current period. As an example, Neople, the Korean entity that develops Dungeon&Fighter for China, records its revenues in
South Korean Won. The constant currency figures for the third quarter show what Neople revenues would have been had the KRW/JPY exchange
rate not changed from last year’s third quarter.5 For the KPIs (MAU, Pay Rate and ARPPU) of PC online games, please refer to appendix of this presentation.
(Unit: ¥ millions)
Regional Revenues
8
Q3 2015 Revenue by Platform
(As-
Reported)
(Constant
Currency4)
(As-
Reported)
(Constant
Currency4)
Revenue by Region1
China ¥15,685 ¥20,247 ¥19,513 29% 24%
Korea 19,976 20,163 19,566 1% (2%)
Japan 7,232 4,972 4,971 (31%) (31%)
North America 1,420 2,045 1,752 44% 23%
Europe and Others2 1,300 2,384 2,234 83% 72%
Nexon Total 45,613 49,811 48,036 9% 5%
Revenue by Platform
PC3 35,931 39,481 38,077 10% 6%
Mobile 9,682 10,330 9,959 7% 3%
Japan 5,570 3,747 3,746 (33%) (33%)
ex-Japan 4,112 6,583 6,213 60% 51%
Nexon Total 45,613 49,811 48,036 9% 5%
FX Rate
100 KRW/JPY 10.15 10.46 10.15
CNY/JPY 16.87 19.48 16.87
USD/JPY 103.92 122.23 103.92
YoY % Change
Q3 2014
Q3 2015
PC79%
Mobile21%
3
© 2015 NEXON Co., Ltd. All Rights Reserved.
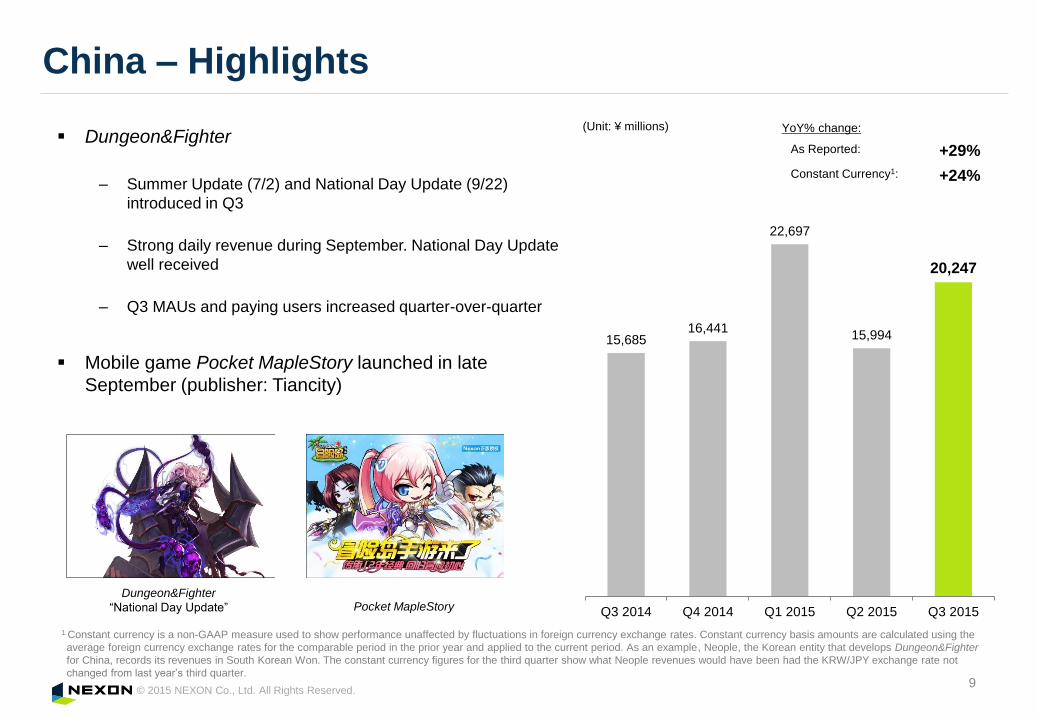
Dungeon&Fighter
– Summer Update (7/2) and National Day Update (9/22)
introduced in Q3
– Strong daily revenue during September. National Day Update
well received
– Q3 MAUs and paying users increased quarter-over-quarter
Mobile game Pocket MapleStory launched in late
September (publisher: Tiancity)
China – Highlights
(Unit: ¥ millions)
9
YoY% change:
As Reported: +29%
Constant Currency1: +24%
Pocket MapleStoryDungeon&Fighter
“National Day Update”
1 Constant currency is a non-GAAP measure used to show performance unaffected by fluctuations in foreign currency exchange rates. Constant currency basis amounts are calculated using the
average foreign currency exchange rates for the comparable period in the prior year and applied to the current period. As an example, Neople, the Korean entity that develops Dungeon&Fighter
for China, records its revenues in South Korean Won. The constant currency figures for the third quarter show what Neople revenues would have been had the KRW/JPY exchange rate not
changed from last year’s third quarter.
15,685 16,441
22,697
15,994
20,247
Q3 2014 Q4 2014 Q1 2015 Q2 2015 Q3 2015

© 2015 NEXON Co., Ltd. All Rights Reserved.
4,094 3,257 3,489 3,503
4,740
15,882
13,492
16,975
12,748
15,423
19,976
16,749
20,464
16,251
20,163
Q3 2014 Q4 2014 Q1 2015 Q2 2015 Q3 2015
Delivered solid results despite difficult comparison with
2014 Q3, which benefited significantly from FIFA World Cup
Year-over-year growth from key PC titles including
Dungeon&Fighter, Sudden Attack and MapleStory
Solid performance by EA SPORTSTM FIFA Online 3 /
EA SPORTSTM FIFA Online 3 M, especially during
September Korean Thanksgiving holiday
Solid momentum for DomiNations (8/26)
Launched MapleStory2 (7/7)
Korea – Highlights
(Unit: ¥ millions)
10
YoY% change:
As Reported: +1%
Constant Currency1: -2%
Mobile
MapleStory2 DomiNations
PC2
1 Constant currency is a non-GAAP measure used to show performance unaffected by fluctuations in foreign currency exchange rates. Constant currency basis amounts are calculated
using the average foreign currency exchange rates for the comparable period in the prior year and applied to the current period. As an example, Neople, the Korean entity that develops
Dungeon&Fighter for China, records its revenues in South Korean Won. The constant currency figures for the third quarter show what Neople revenues would have been had the
KRW/JPY exchange rate not changed from last year’s third quarter.2 PC revenue includes revenues other than PC/mobile revenues.

© 2015 NEXON Co., Ltd. All Rights Reserved.
5,570 5,384
4,487 4,073 3,747
1,662 1,545
1,371 1,382
1,225
7,232 6,929
5,858 5,455
4,972
Q3 2014 Q4 2014 Q1 2015 Q2 2015 Q3 2015
Mobile revenue was ¥3.7 billion, down 8% quarter-over-
quarter primarily due to declining browser game revenues
PC revenue was ¥1.2 billion, down 11% quarter-over-quarter
Launched mobile native game MapleStory Pocket (8/5) and
DomiNations (8/26)
Japan – Highlights
11
YoY% change:
As Reported: -31%
Constant Currency1: -31%
(Unit: ¥ millions)
Mobile
MapleStory Pocket DomiNations
PC2
2
1 Constant currency is a non-GAAP measure used to show performance unaffected by fluctuations in foreign currency exchange rates. Constant currency basis amounts are calculated using
the average foreign currency exchange rates for the comparable period in the prior year and applied to the current period. As an example, Neople, the Korean entity that develops
Dungeon&Fighter for China, records its revenues in South Korean Won. The constant currency figures for the third quarter show what Neople revenues would have been had the
KRW/JPY exchange rate not changed from last year’s third quarter.2 PC revenue includes revenues other than PC/mobile revenues.

© 2015 NEXON Co., Ltd. All Rights Reserved.
Soft launch of mobile game Legacy Quest by Socialspiel
Launched mobile game DomiNations in Taiwan, Hong Kong and Macau (8/26)
North America, Europe and Others1 – Highlights
12
(Unit: ¥ millions)(Unit: ¥ millions) YoY% change:
As Reported: +44%
Constant Currency2: +23%
1 Europe and Others includes Asian countries (excluding Japan, Korea and China) and South American countries.2 Constant currency is a non-GAAP measure used to show performance unaffected by fluctuations in foreign currency exchange rates. Constant currency basis amounts are calculated using
the average foreign currency exchange rates for the comparable period in the prior year and applied to the current period. As an example, Neople, the Korean entity that develops
Dungeon&Fighter for China, records its revenues in South Korean Won. The constant currency figures for the third quarter show what Neople revenues would have been had the KRW/JPY
exchange rate not changed from last year’s third quarter.
YoY% change:
As Reported: +83%
Constant Currency2: +72%
1,420 1,623 1,695
2,814
2,045
Q3 2014 Q4 2014 Q1 2015 Q2 2015 Q3 2015
North America
1,300 1,190 1,258
2,150 2,384
Q3 2014 Q4 2014 Q1 2015 Q2 2015 Q3 2015
Europe and Others1
© 2015 NEXON Co., Ltd. All Rights Reserved.
Q4 2015 Outlook

© 2015 NEXON Co., Ltd. All Rights Reserved.14
Q4 2015 Outlook
(Unit: ¥ millions, except per share data)
1 PC revenue includes revenues other than PC/mobile revenues.2 Net income/(loss) refers to net income/(loss) attributable to owners of the parent, as stated in Nexon’s consolidated financial results.3 In most situations, the exchange rates of both the South Korean won and the Chinese yuan are linked to the U.S. dollar.
Expect revenues to be down 7% to 0% year-over-year on an as-reported basis
Forex sensitivity: every one Japanese yen move against the U.S. dollar would have the following impact
on our financials for the fourth quarter of 20153
Revenue 0.3 billion yen
Operating Income 0.1 billion yen
Q4 2014
Revenues ¥42,932 ¥40,060 ~ ¥42,865 (7%) ~ (0%)
PC1 34,041 30,189 ~ 31,871 (11%) ~ (6%)
Mobile 8,891 9,871 ~ 10,994 11% ~ 24%
Operating income/(loss) (748) 9,692 ~ 11,831 n/a ~ n/a
Net income/(loss)2 (4,498) 7,795 ~ 9,527 n/a ~ n/a
Earnings/(loss) per share (10.45) 17.99 ~ 21.99
FX Rate Assumptions
100 KRW/JPY 10.55 10.50 10.50
CNY/JPY 18.59 18.91 18.91
USD/JPY 114.54 120.07 120.07
Q4 2015 Outlook YoY %
© 2015 NEXON Co., Ltd. All Rights Reserved.
Expect 30+% YoY decrease on an as-reported basis
PC- Announced new publishing title Devil’s Third Online, developed
by Valhalla Game Studios. Scheduled for CBT (Nov)
- Conducted CBT for Tree of Savior (Oct)
Mobile- Scheduled to launch Mabinogi Duel / Fantasy War Tactics (Nov)
- Pre-registration started for gloops’ new browser game LAPLACE
LINK (Nov)
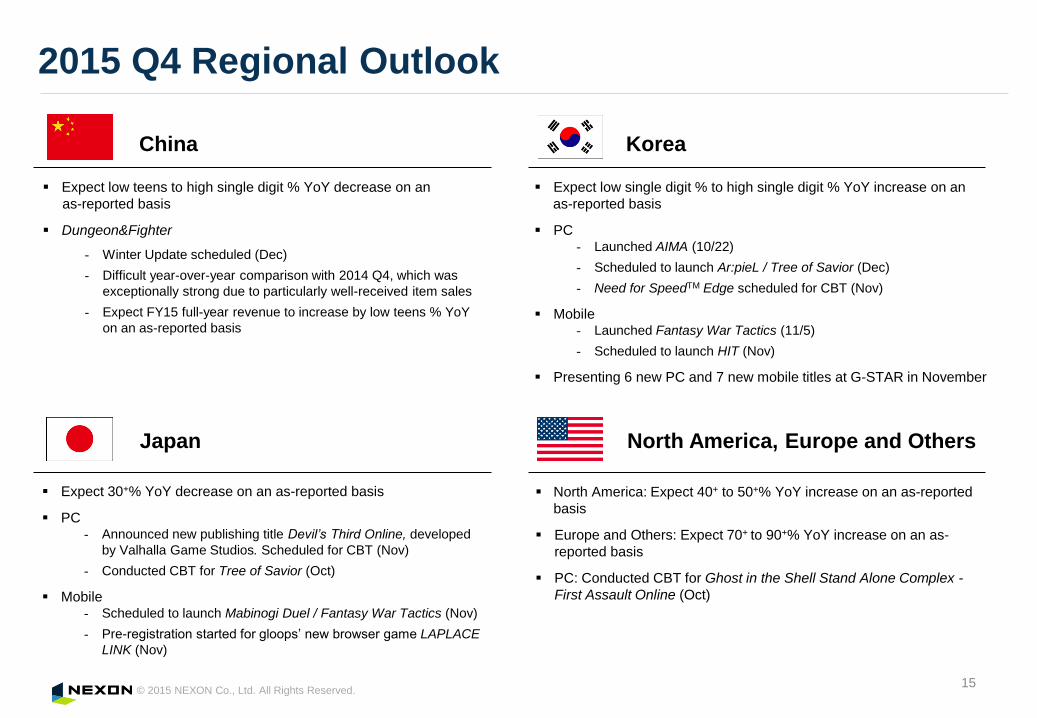
2015 Q4 Regional Outlook
15
China
Expect low teens to high single digit % YoY decrease on an
as-reported basis
Dungeon&Fighter
- Winter Update scheduled (Dec)
- Difficult year-over-year comparison with 2014 Q4, which was
exceptionally strong due to particularly well-received item sales
- Expect FY15 full-year revenue to increase by low teens % YoY
on an as-reported basis
Expect low single digit % to high single digit % YoY increase on an
as-reported basis
PC - Launched AIMA (10/22)
- Scheduled to launch Ar:pieL / Tree of Savior (Dec)
- Need for SpeedTM Edge scheduled for CBT (Nov)
Mobile- Launched Fantasy War Tactics (11/5)
- Scheduled to launch HIT (Nov)
Presenting 6 new PC and 7 new mobile titles at G-STAR in November
North America: Expect 40+ to 50+% YoY increase on an as-reported
basis
Europe and Others: Expect 70+ to 90+% YoY increase on an as-
reported basis
PC: Conducted CBT for Ghost in the Shell Stand Alone Complex -
First Assault Online (Oct)
Korea
Japan North America, Europe and Others

© 2015 NEXON Co., Ltd. All Rights Reserved.
11.7 11.8
1.0
1.5 2.2
0.4
AdjustedOperating
Income 2014 Q4
Variable Cost Marketing Amortization Others OperatingIncome 2015 Q4
(High-end)
Q4 2015 Operating Income Outlook
YoY Operating Income Comparison
16
Expect Q4 2015 operating income of ¥9.7 to
¥11.8 billion due to:
Increase in variable costs including:
− Royalty costs associated with third-party
licensed games
− PG fee with growth in mobile business
Increase in marketing costs associated
with multiple new title launches
Decrease in amortization expense due to
completion of amortization associated with
Dungeon&Fighter IP
(Unit: ¥ billions)
2
1 Adjusted Operating Income 2014 Q4 JPY 11,694 million = Operating loss JPY 748 million + Impairment loss JPY 12,442 million2 Others include other costs and other income/expenses above operating income
1
© 2015 NEXON Co., Ltd. All Rights Reserved.17
Disposal of NCSOFT Shares
Disposed of all NCSOFT shares held by Nexon Group on October 16
– Number of shares: 3,306,897 shares (15.08% of outstanding shares)
– Disposal price: KRW 183,000 per share
– Total amount: KRW 605 billion or JPY 64 billion

© 2015 NEXON Co., Ltd. All Rights Reserved.
1 Chart is illustrative excerpt pipeline.2 Title is tentative and may be subject to change.3 Developing mobile games based on the original IPs. 4 The letters, graphics, symbols, logos and other marks shown in this material are trademarks or registered trademarks owned by respective right holders.
Pipeline1(1)
18
PC
On
lin
eM
ob
ile
2016 and onward
Ghost in the Shell Stand Alone
Complex - First Assault Online
2015
LawBreakers by
Boss Key Productions
Sudden Attack 2
LEGO® mobile3
DomiNations
TitanfallTM
Fantasy War Tactics
Sangokushi Sousouden
Online2
Tree of Savior
Devil’s Third Online
Need for SpeedTM Edge Moonlight Blade
HIT
Dungeon&Fighter mobile3
Durango
FINAL FANTASY XI mobile3 TERA mobile3
TitanfallTM mobile3
DIRTY BOMB
MapleStory2 Counter-Strike Online 2
HYPER UNIVERSE
LAPLACE LINK
by gloops
Pocket MapleStory
© 2015 NEXON Co., Ltd. All Rights Reserved.
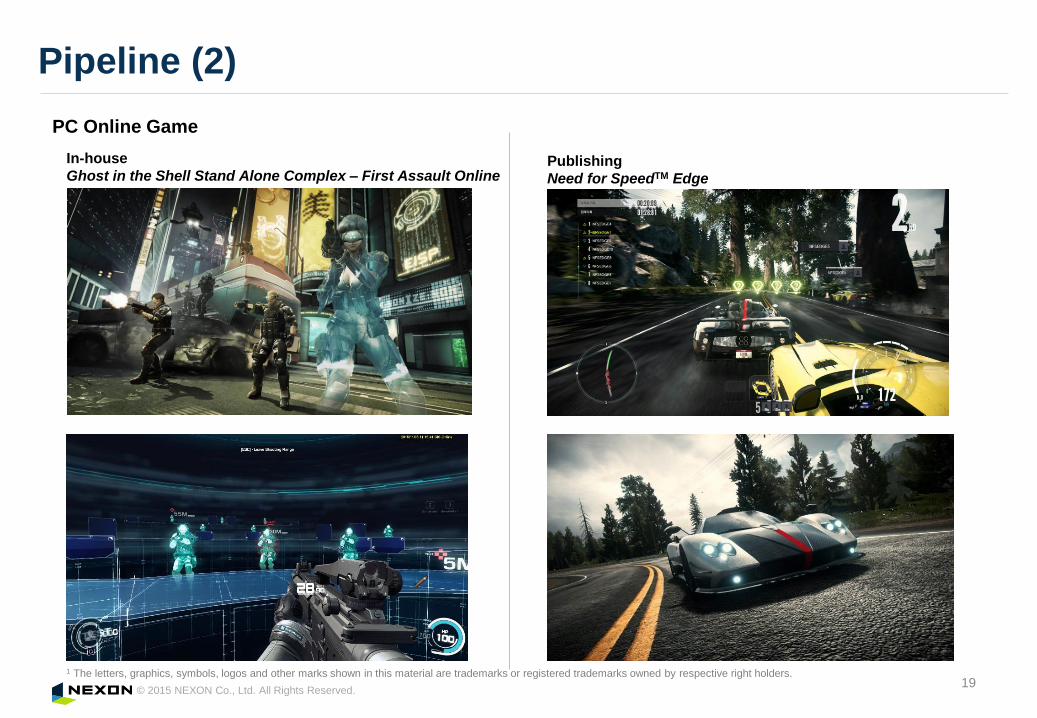
Pipeline (2)
191 The letters, graphics, symbols, logos and other marks shown in this material are trademarks or registered trademarks owned by respective right holders.
PC Online Game
Publishing
Need for SpeedTM Edge
In-house
Ghost in the Shell Stand Alone Complex – First Assault Online
© 2015 NEXON Co., Ltd. All Rights Reserved.
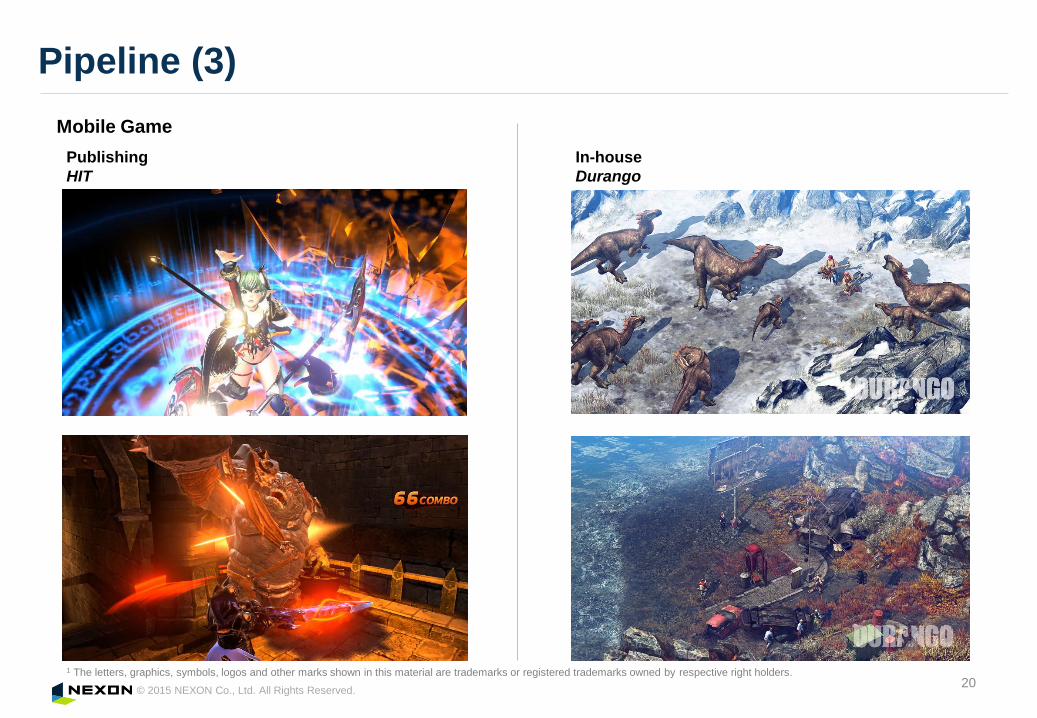
Pipeline (3)
20
Mobile Game
1 The letters, graphics, symbols, logos and other marks shown in this material are trademarks or registered trademarks owned by respective right holders.
In-house
Durango
Publishing
HIT

© 2015 NEXON Co., Ltd. All Rights Reserved.
2015 Tier 1 Content Update Schedule
21
Ch
ina
Game Title 1H 2015 Q3 2015 Q4 2015
Ko
rea
Dungeon&Fighter
Counter-Strike Online
EA SPORTSTM FIFA Online 3
MapleStory
Dungeon&Fighter
Sudden Attack
Summer Update
National Day Update
Q1: Lunar New Year Update
Q1: MapleStory Ice & Burn Update
Q2: 12th Anniversary Update, Summer
Update
Q1: Lunar New Year Update, Roster
Update
Q2: Staff System Update
Q1: Lunar New Year Update
Q2: Children’s day Package
Q1: Winter Update (continued from
Q4 2014)
Q2: Summer Update
Winter Update
Heroes of Maple Update
New Character Update
Rare Avatar & Christmas Package
Knight 2nd Awakening Update
Summer Update (continued from Q2)
New Character Update
10th Anniversary & D&F Fever Update
Korean Thanksgiving Package
ENGINE Update
Q1: Winter Content Update, Lunar New
Year Update
Q2: Labor Day Update, 7th Anniversary
Update
Summer Update
National Day Update
Winter Update
Summer Update (continued from Q2)
10th Anniversary Event
Celebrity Character Update
Celebrity Character Update
Winter Update
1 The letters, graphics, symbols, logos and other marks shown in this material are trademarks or registered trademarks owned by respective right holders.
.
LIVE & BROAD Update
Korean Thanksgiving Package

© 2015 NEXON Co., Ltd. All Rights Reserved.22
Appendix

© 2015 NEXON Co., Ltd. All Rights Reserved.23
Summary of Results and Key Operational Metrics
(Unit: ¥ millions except per share data)
1 PC revenue includes revenues other than PC/mobile revenues.2 Net income/(loss) refers to net income/(loss) attributable to owners of the parent, as stated in Nexon’s consolidated financial results.
Q1 2014 Q2 2014 Q3 2014 Q4 2014 Q1 2015 Q2 2015 Q3 2015 YoY%
(By Region)
China ¥21,302 ¥13,530 ¥15,685 ¥16,441 ¥22,697 ¥15,994 ¥20,247 29%
Korea 15,251 13,433 19,976 16,749 20,464 16,251 20,163 1%
Japan 8,121 7,656 7,232 6,929 5,858 5,455 4,972 (31%)
North America 1,345 1,131 1,420 1,623 1,695 2,814 2,045 44%
Europe and Others 1,472 1,144 1,300 1,190 1,258 2,150 2,384 83%
(By Platform)
PC 1 40,297 28,459 35,931 34,041 43,602 32,511 39,481 10%
Mobile 7,194 8,435 9,682 8,891 8,370 10,153 10,330 7%
Japan 6,100 5,959 5,570 5,384 4,487 4,073 3,747 (33%)
ex-Japan 1,094 2,476 4,112 3,507 3,883 6,080 6,583 60%
Revenue 47,491 36,894 45,613 42,932 51,972 42,664 49,811 9%
Operating income/(loss) 21,171 9,962 15,124 (748) 22,219 11,320 18,436 22%
Net income/(loss) 2 16,144 4,085 13,585 (4,498) 18,539 13,010 19,184 41%
Earnings/(loss) per share 36.74 9.33 31.49 (10.45) 43.05 30.35 44.47
Cash and deposits 149,040 140,157 114,155 117,729 120,990 116,261 128,236
FX rate
100 KRW/JPY 9.63 9.95 10.15 10.55 10.85 11.07 10.46
CNY/JPY 16.83 16.54 16.87 18.59 19.32 19.76 19.48
USD/JPY 102.78 102.16 103.92 114.54 119.09 121.36 122.23
Key Performance (Excluding Mobile)
MAU (millions) 55.9 51.9 52.7 50.5 48.9 48.2 49.1
Pay Rate 11.0% 10.2% 9.7% 9.3% 10.0% 10.0% 10.1%
ARPPU (as-reported) 3,639 2,781 3,476 3,776 4,805 3,508 4,470

© 2015 NEXON Co., Ltd. All Rights Reserved.
COGS and SG&A
24
(Unit: ¥ millions)
1 Breakdown of COGS and SG&As are unaudited.2 “Royalty” includes royalties paid to third-party developers in order for us to obtain the right to publish their games.3 “HR cost” includes salaries, bonuses and benefits for our live game developers, who support post launch servicing, updating and support for our games.4 “Other (COGS)” primarily consists of depreciation and amortization of assets related to existing games, connection fees (mainly comprised of co-location and datacenter fees, internet
bandwidth and access fees), and the costs of purchasing and maintaining our servers and computer equipment. 5 “PG Fee” in SG&A includes commissions made to external payment gateway companies when users purchase in-game items in PC Online games that we service. It also includes mobile
carrier-related commissions we pay regarding our Japanese mobile browser games, commissions we pay to Apple/Google regarding our mobile native games globally, and platform
commission fees related to mobile browser games. Before 2014 Q4, platform commission fees related to mobile browser games are included in Other in SG&A.6 “Other Income” includes other non-operating income, reversal of deferred revenue, gain on sale of properties, and gain on change in equity. 7 “Other Expense” includes other non-operating expenses, loss on sale/disposal of properties, loss on impairment of tangible fixed assets, loss on impairment of intangible assets, loss on
impairment of other fixed assets, loss on change in equity, and loss on liquidation of subsidiaries. Q1 2014, Q2 2014, Q3 2014,Q4 2014, Q1 2015, Q2 2015, and Q3 2015 Other Expense
includes impairment of game IP and impairment of goodwill.
Q1 Q2 Q3 Q4 Q1 Q2 Q3
Total Cost of Revenue 1 ¥10,249 ¥9,839 ¥12,731 ¥11,516 ¥12,602 ¥11,092 ¥12,552
Royalty 2 4,055 3,317 6,606 4,448 5,621 4,263 5,355
HR cost (COGS) 3 3,461 3,580 3,372 3,811 4,022 3,950 4,334
Other (COGS) 4 2,733 2,942 2,753 3,257 2,959 2,879 2,863
Total SG&A 1 14,855 16,788 17,401 19,556 16,776 19,585 18,269
HR cost 3,602 4,758 4,025 4,202 3,695 3,738 3,428
PG fee 5 2,661 2,649 3,645 3,542 4,631 4,813 5,128
R&D 1,120 1,533 1,645 1,533 1,963 1,971 1,729
Marketing/advertising expenses 1,382 2,069 2,051 3,468 1,630 3,728 3,921
Depreciation and amortization 2,802 2,792 2,914 2,958 3,026 3,176 2,275
Other 3,288 2,987 3,121 3,853 1,831 2,159 1,788
Other Income 6 208 209 180 613 124 90 101
Other Expense 7 1,424 514 537 13,221 499 757 655
FY2014 FY2015

© 2015 NEXON Co., Ltd. All Rights Reserved.25
P&L Below Operating Income
1 2014 Q3, Q4 and 2015 Q1, Q2, Q3 Finance Income include FX conversion gain related to foreign currency deposits & A/R. In addition, 2015 Q1 Finance Income includes dividend
received from investee.2 2014 Q2 Finance Costs are primarily caused by FX conversion loss related to foreign currency deposits & A/R.3 2015 Q2 Tax Expense was small because of the partial reversal of income taxes payable due to the difference in opinion between the tax authorities being resolved during 2015 Q2
with regards to the estimate of income taxes payable recorded in FY2014 at a Korean subsidiary based on findings from tax inspection by the tax authorities.4 Net income/(loss) refers to net income/(loss) attributable to owners of the parent, as stated in Nexon’s consolidated financial results.
(Unit: ¥ millions)
Q1 Q2 Q3 Q4 Q1 Q2 Q3
Operating Income/(Loss) ¥21,171 ¥9,962 ¥15,124 (¥748) ¥22,219 ¥11,320 ¥18,436
Finance Income 1 1,014 1,024 5,122 5,381 2,576 2,331 4,277
Finance Costs 2 385 3,655 360 781 117 97 234
Equity income/(losses) of affiliates,
equity method companies(32) (73) (93) 0 4 11 11
Income/(Loss) before Income Tax 21,768 7,258 19,793 3,852 24,682 13,565 22,490
Tax expense 3 (5,446) (3,089) (6,132) (8,583) (5,835) (452) (3,239)
Net Income/(loss) 4 16,144 4,085 13,585 (4,498) 18,539 13,010 19,184
FY2014 FY2015

© 2015 NEXON Co., Ltd. All Rights Reserved.26
Key Cash Flow Statement Items
(Unit: ¥ millions)
9 months ended
September 30, 2014
9 months ended
September30, 2015
Cash flows from operating activities ¥41,930 ¥45,016
Cash flows from investing activities (43,376) (13,258)
Cash flows from financing activities (26,147) (16,263)
Net increase/(decrease) in cash and cash equivalents (27,593) 15,495
Cash and cash equivalents at beginning of fiscal year 138,843 117,729
Effect of exchange rate change on cash and cash equivalents 2,905 (4,988)
Cash and cash equivalents at end of fiscal year 114,155 128,236
© 2015 NEXON Co., Ltd. All Rights Reserved.27
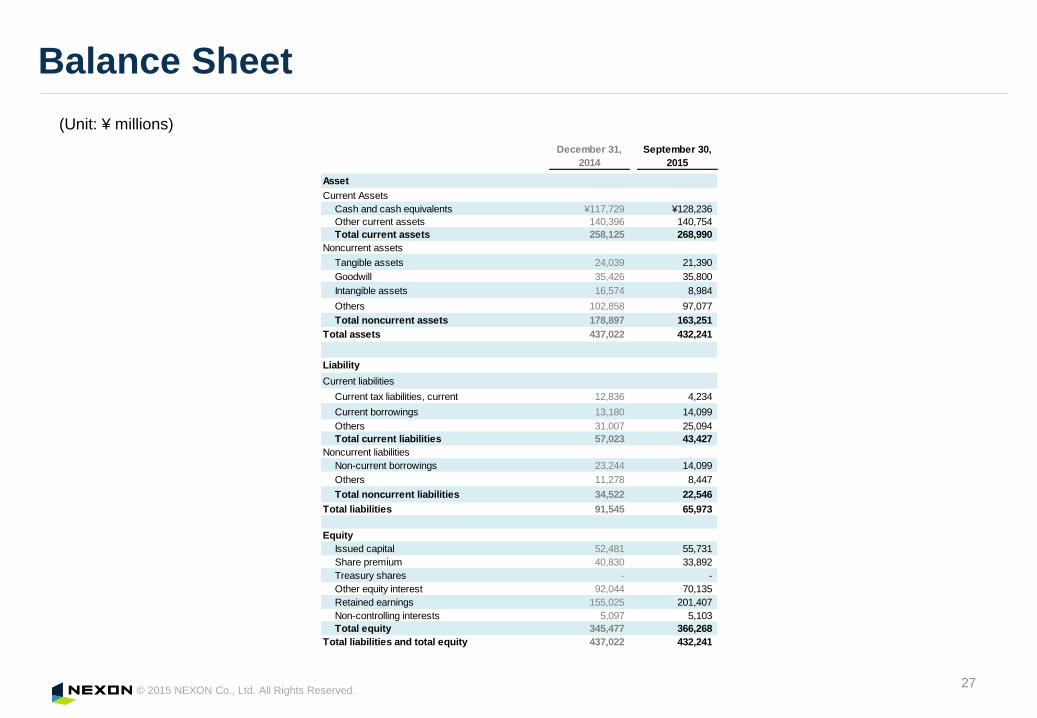
Balance Sheet
Update
5/7
(Unit: ¥ millions)
December 31,
2014
September 30,
2015
Asset
Current Assets
Cash and cash equivalents ¥117,729 ¥128,236
Other current assets 140,396 140,754
Total current assets 258,125 268,990
Noncurrent assets
Tangible assets 24,039 21,390
Goodwill 35,426 35,800
Intangible assets 16,574 8,984
Others 102,858 97,077
Total noncurrent assets 178,897 163,251
Total assets 437,022 432,241
Liability
Current liabilities
Current tax liabilities, current 12,836 4,234
Current borrowings 13,180 14,099
Others 31,007 25,094
Total current liabilities 57,023 43,427
Noncurrent liabilities
Non-current borrowings 23,244 14,099
Others 11,278 8,447
Total noncurrent liabilities 34,522 22,546
Total liabilities 91,545 65,973
Equity
Issued capital 52,481 55,731
Share premium 40,830 33,892
Treasury shares - -
Other equity interest 92,044 70,135
Retained earnings 155,025 201,407
Non-controlling interests 5,097 5,103
Total equity 345,477 366,268
Total liabilities and total equity 437,022 432,241

© 2015 NEXON Co., Ltd. All Rights Reserved.
2014
Re
ve
nu
e
Year
Existing New PC / mobile the West
M&A
Our Business Continues to Evolve
28
Long-term Growth Vision and Evolution1
1 Above graph is illustrative and not to scale.
© 2015 NEXON Co., Ltd. All Rights Reserved.
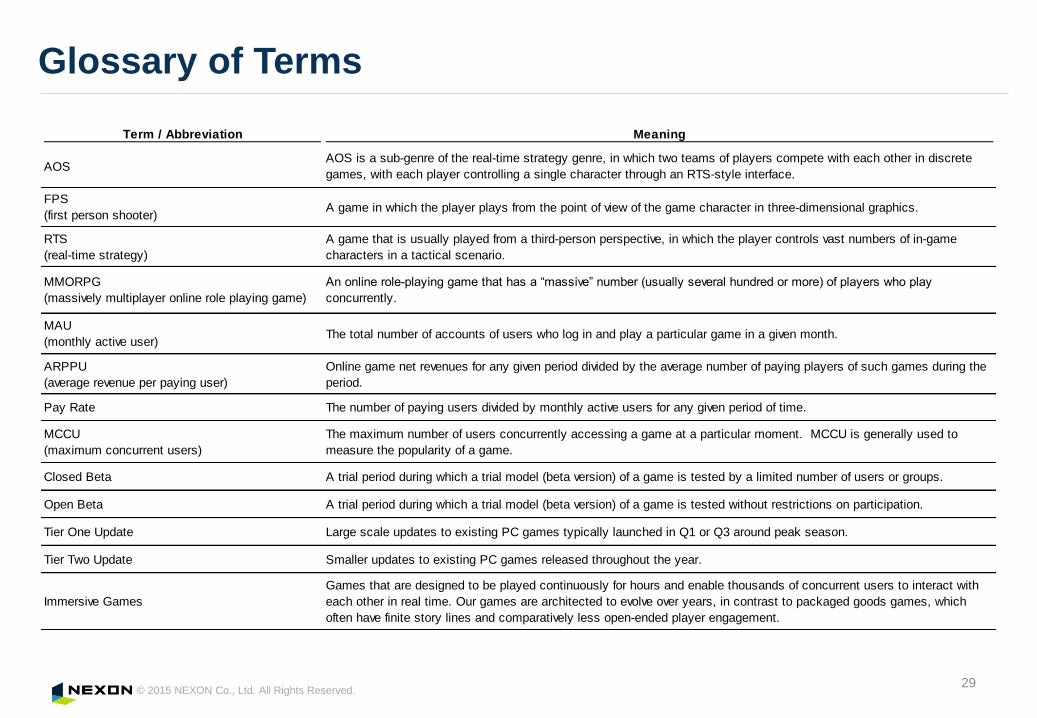
Glossary of Terms
29
Update
5/7
Term / Abbreviation Meaning
AOSAOS is a sub-genre of the real-time strategy genre, in which two teams of players compete with each other in discrete
games, with each player controlling a single character through an RTS-style interface.
FPS
(first person shooter)A game in which the player plays from the point of view of the game character in three-dimensional graphics.
RTS
(real-time strategy)
A game that is usually played from a third-person perspective, in which the player controls vast numbers of in-game
characters in a tactical scenario.
MMORPG
(massively multiplayer online role playing game)
An online role-playing game that has a “massive” number (usually several hundred or more) of players who play
concurrently.
MAU
(monthly active user)The total number of accounts of users who log in and play a particular game in a given month.
ARPPU
(average revenue per paying user)
Online game net revenues for any given period divided by the average number of paying players of such games during the
period.
Pay Rate The number of paying users divided by monthly active users for any given period of time.
MCCU
(maximum concurrent users)
The maximum number of users concurrently accessing a game at a particular moment. MCCU is generally used to
measure the popularity of a game.
Closed Beta A trial period during which a trial model (beta version) of a game is tested by a limited number of users or groups.
Open Beta A trial period during which a trial model (beta version) of a game is tested without restrictions on participation.
Tier One Update Large scale updates to existing PC games typically launched in Q1 or Q3 around peak season.
Tier Two Update Smaller updates to existing PC games released throughout the year.
Immersive Games
Games that are designed to be played continuously for hours and enable thousands of concurrent users to interact with
each other in real time. Our games are architected to evolve over years, in contrast to packaged goods games, which
often have finite story lines and comparatively less open-ended player engagement.

© 2015 NEXON Co., Ltd. All Rights Reserved.
This presentation is prepared to offer reference information about NEXON group to the investors and is intended to generally provide investors and analysts with financial and operational information about Nexon, but not to solicit or recommend any sale or purchase of stock or other securities of Nexon. NEXON Co., Ltd. (“Nexon”) has not verified and would assume no responsibility for the accuracy, appropriation, or completeness thereof. This presentation does not contain all relevant information relating to Nexon or the sale of its shares, including, without limitation, the information that would be stated under the captions “Risk Factors”, “Management’s Discussion and Analysis of Financial Condition and Results of Operations” and “Business” in an annual report. Any investment decision with respect to any shares of Nexon should be made solely upon the basis of the information contained in the disclosure documents and is qualified in its entirety by reference to the detailed information appearing in the disclosure documents.
This presentation includes non-GAAP and non-IFRS financial measures, including but not limited to key performance indicators, as well as ratios calculated on the basis thereof. These non-GAAP and non-IFRS financial measures should not be considered in isolation or as a substitute for the most directly comparable financial measures included in our consolidated financial statements and presented in accordance with IFRS.
This presentation includes forward-looking statements. In some cases, you can identify forward-looking statements by terms such as “anticipate”, “assume”, “believe”, “estimate”, “expect”, “forecast”, “may”, “plan”, “potential”, “predict”, “seek”, “should”, or “will”, or by other similar terminology. These statements discuss expectations, identify strategies, contain projections of Nexon’s financial condition or results of operations or state other forward-looking information. The forward-looking statements in this presentation are subject to various risks, uncertainties and assumptions about Nexon’s business and results of operations. The expectations expressed in these forward-looking statements may not be achieved, and actual results could differ materially from and be worse than expectations. Potential risks and uncertainties that could cause actual results to differ materially from expectations include, without limitation:
Continued growth and popularity of Nexon’s key titles;
Nexon’s ability to maintain favorable relationships with key licensing partners;
Nexon’s continued ability to offer games in China, through local partners or otherwise;
Nexon’s ability to compete effectively in the online games industry;
Nexon’s ability to address hacking, viruses, security breaches and other technical challenges;
Fluctuations in currency exchange rates;
Nexon’s ability to maintain and further develop its brand name;
Effective acquisition of new companies, businesses, technologies and games from third parties and the possibility of recognizing impairment losses;
Continued growth of the online games market, including the underlying infrastructure, and free-to-play/item-based revenue generation model;
Nexon’s ability to adapt to new technologies;
Nexon’s ability to enter into licensing arrangements for third-party titles on terms favorable to it;
Effective defense of Nexon’s intellectual property; and
Legislative, regulatory, accounting and taxation changes in the countries in which Nexon operates.
Nexon does not intend, and disclaims any duty, to update or revise any forward-looking statements contained in this presentation to reflect new
information, future events or otherwise. We caution you not to place undue reliance on the forward-looking statements contained in this presentation.
30
Disclaimer