Embed Size (px)
Citation preview

London Stock Exchange
Group plc
Preliminary results – period ended 31
December 2014
5 March 2015
London Stock Exchange Group Page 1
Agenda
London Stock Exchange Group
Introduction
Financial Review David Warren, Chief Financial Officer
CEO Overview Xavier Rolet, Chief Executive
Q&A
Page 2

David Warren
London Stock Exchange Group Page 3

Key financial highlights
London Stock Exchange Group
• Strong financial performance, on a 12 month basis:
• revenue up 32%
• organic and acquisitions both delivering
• organic revenue up 12% - growth across each business area
• adjusted total income up 26%
• continued focus on cost control, expenses on organic basis up 5%1
• adjusted operating profit up 16% to £558.0m
• AEPS of 103.3p up 7%2
• Final dividend up 6.5%3 (pro-rata) to 12.8p per share - equivalent total dividend
up 5.6% to 22.5p per share (equal to 75% of a full year payment)
1 including inflation, cost of sales, LCH OTC service changes and one-time items, excluding FX
2 Versus 2013 12 months adjusted for rights issue
3 Adjusted for rights issue shares and for 9 month period
Page 4

Overview of results
London Stock Exchange Group Page 5
1 Unaudited
2 Excluding amortisation of purchased intangibles (£122.0m) , non-recurring items (£67.5m), Impairment (£22.0m), charge for new revolving credit facility (£1.8m) and LCH.Clearnet unrealised loss (£0.5m) 3 Excluding adjustments in respect of previous years 4 2013 dividend adjusted for rights issue, 5 Adjusted basic share count 2013: 293.1m, 2014: 317.1m
A €10c movement in the average £/€ rate for the year would have changed the Group’s operating profit for
the year before amortisation of purchased intangibles and non-recurring items by approximately £26m.
Organic and
constant currency
2014 2013 Change variance
£m £m % %
Revenue 1,283.2 974.0 32% 12%
Adjusted total income2 1,381.1 1,096.4 26% 7%
Profit from JV / associates 0.1 -
Adjusted operating expenses2 (823.2) (616.5) 34% 5%
Adjusted operating profit2 558.0 479.9 16% 8%
Non-recurring items and amortisation (211.5) (147.6)
Operating profit 346.0 329.4 5% 13%
Net finance expense (68.1) (67.2) 1%
Adjusted profit before tax2 491.7 412.7 19%
Underlying effective tax rate325.6% 27.1%
Basic earnings per share (p) 56.5 64.2 (12%)
Adjusted earnings per share (p)2,5 103.3 96.5 7%
Dividend per share (p)4 22.5 28.4 6%
31 December
Twelve months ended1

Income growth
London Stock Exchange Group
Strategy delivering – both organically and from acquisitions
Page 6

Capital Markets - Primary
London Stock Exchange Group
Annual fee revenue up 10%
Admission fee revenues up 20%
• 219 new issues, up 30% (169) • highest since 2007 • UK Main Markets: 75 - up 47% • UK AIM: 118 - up 18% • Italy: 26 - up 44%
• £42.6bn raised via equity issuance,
up 40% (£30.4bn) • highest since 2008
• Good pipeline of companies
looking to join both our UK and
Italian AIM and main markets
Revenue up 15%; up 14% at constant currency
Notes - Revenues and KPIs shown for 12 months period unless stated . Minor rounding differences, chart figures may not cast down
Page 7

Capital Markets - Secondary
London Stock Exchange Group
Revenue up 12%; up 12% at organic and constant currency
• UK equities Average Daily Value
(ADV) up 15%
• Turquoise equities ADV up 42%
• Italy equities average daily number
of trades up 16%
• Derivatives volumes unchanged
• Fixed Income revenue up 20%; up
12% at organic and constant
currency
• MTS Repo value traded up 3%
• MTS Cash value traded up 32%
Note: Minor rounding differences, figures may not cast down
Page 8

Post Trade Services – CC&G and MT
London Stock Exchange Group
CC&G
Clearing revenues up 1%
• Clearing volumes up 18%
Monte Titoli
Settlement revenues up 9%
• Settlement instructions up 14%
Custody revenues up 2%
• Assets under Custody up 2% to
€3.35 trillion
NTI down as expected (down 42%)
• Lower margin held and lower
European yields All above revenue comparisons at organic constant
currency.
Revenue down 2%; up 3% at constant currency (excl NTI), Income down 14%
Note: Minor rounding differences, figures may not cast down
Page 9

Post Trade Services - LCH.Clearnet
London Stock Exchange Group
OTC revenue up 34%
SwapClear:
• $642 trillion notional cleared (up
26%)
• 114 members (103)
Non-OTC clearing revenue up 8%
Volumes:
• Fixed Income up 1%
• Commodity unchanged
• Equity up 30%
• Listed derivatives up 1%
Net Treasury Income down 13% at
organic and constant currency All above revenue comparisons at organic and constant
currency.
Volume comparisons to equivalent 12 month period.
Adjusted Income up 23% at organic and constant currency
Note: Minor rounding differences, figures may not cast down
Page 10

Information Services
London Stock Exchange Group
FTSE revenue up 14%; • ETF AUM benchmarked up 16% to
$216bn (2013: $186bn)
• FTSE China Indices AUM
benchmarked grew to $24bn
Russell Indexes acquired
3 December 2014, revenue £10.0m
• ETF AUM benchmarked up 19% to
$153bn (2013: $129bn)
Real time data revenue down 11% • lower number of UK real time
professional users
Revenue from other information products up 14% • Strong growth at UnaVista and SEDOL
Revenue up 10%; up 8% on organic and constant currency
Note: Minor rounding differences, figures may not cast down
Page 11

Technology Services
London Stock Exchange Group
MillenniumIT revenues up 1%; up 8%
constant currency
• Aequitas Innovations Inc selects
suite of MillenniumIT products to
power new exchange in Canada
• MillenniumIT to provide a suite
of capital markets technology to
Casablanca Stock Exchange
• India’s NCDEX commodity
exchange selects Millennium
Exchange and Millennium
Surveillance
Other technology revenues up 10%
• including contribution from new
services
Revenue up 6%; up 11% on organic and constant currency
Note: Minor rounding differences, figures may not cast down
Page 12

Russell Investment Management
London Stock Exchange Group
• High quality, solutions-based investment management
• Revenue shown gross
• £79.7m for December 2014 (since acquisition date)
• £80.4m monthly run-rate last 6 months1 (H1 £77.9m)
• Assets under management
• $273 bn (31 Dec 2013: $257 bn)
• Continued focus on client service, growth and innovation during
sale process
Page 13
1 Using monthly average GBP:USD exchange rates

LCH.Clearnet
London Stock Exchange Group
• Increased cost synergy target successfully reached
• €45m achieved programme to date, with €30m achieved in 2014
• Costs to achieve synergies of €38m
• €60m full run-rate will be delivered in 2015:
• Staffing reduced by almost 200 - including contractors
• Consolidation of property and contracts with third parties
• Next phase efficiencies – work underway
• Further communication later in H1
• Multi-year change and efficiency programme
Page 14
Good control of operating expenses
London Stock Exchange Group
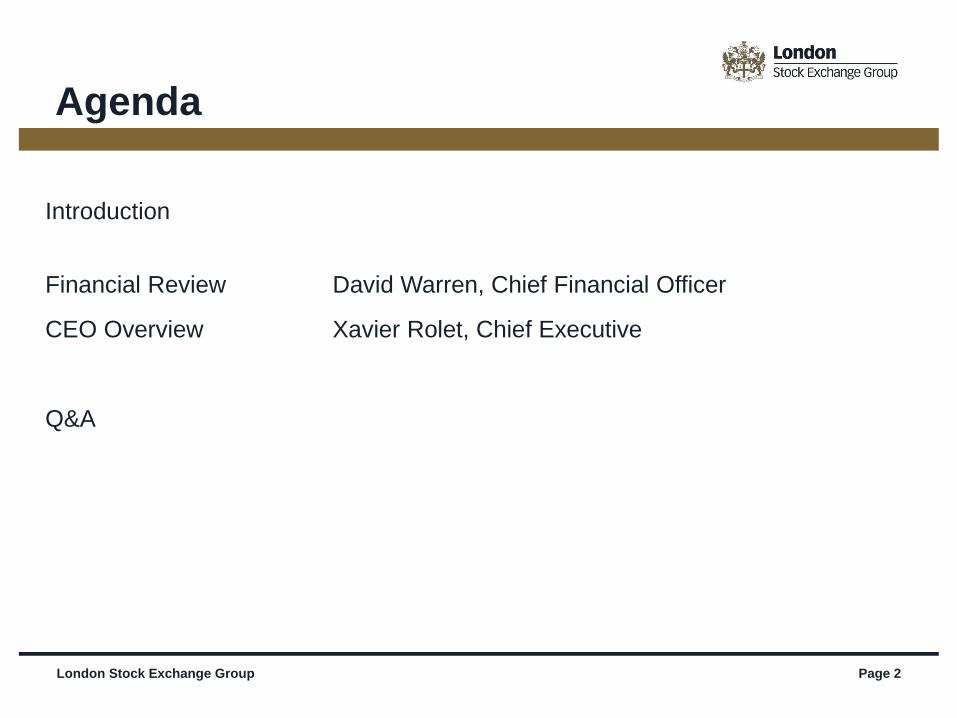
Note: Excluding amortisation of purchased intangibles and non-recurring items.
Page 15
• Organic costs up 5% include:
• Change to LCH.Clearnet OTC service arrangements
• Cost of sales and project spend

Summarised cash flow
London Stock Exchange Group
Good cash generation
• £84m capex – mainly
technology upgrades, new
projects and integration of
LCH
• Discretionary free cash
flow after investment
activities remains strong at
79.5p per share1 (FY 2014 : 89.5p)
£ million
1 Based on weighted average shares in issue for the period of 317.1m
* Excludes investment in acquisitions, includes dividends received
Page 16

London Stock Exchange Group
Borrowings
London Stock Exchange Group Page 17
• Operating net debt £1,587m (£1,023m
30 June 2014)
• Net debt: Pro forma EBITDA 2.1x
(excluding £1bn restricted cash)
• Committed undrawn credit lines available
for Group purposes at 31 December 2014
totalled £0.5 billion, extending out to 2018
Ratings:
• LSEG: S&P BBB+ and Moody’s Baa2
• LCH.Clearnet Group: A+
*FY 2012 Pro forma as if FTSE owned for whole year, FY 2014 pro forma as if LCH.Clearnet owned for whole year, 31 December 2014 pro forma as if Frank Russell Co owned for whole
year. Operating Net debt : Adjusted EBITDA. Net debt excludes all cash and cash equivalents of LCH.Clearnet and Frank Russell Company and £200m of further Group cash and cash
equivalents held locally for regulatory purposes
Facilities
Leverage
Page 17

Capital allocation
London Stock Exchange Group
Current considerations:
• Leverage / debt position
• Long term range 1.0x – 2.0x net debt : EBITDA
• Under 2.0x within 12 months of completion of Russell acquisition
• Investment opportunities
• Capex for organic developments, plus flexibility for inorganic opportunities
• Ordinary dividend
• Sustainable progressive policy - strong track record of dividend increases
• Final dividend - increased 6.5%
• Other returns
• Distribution options if surplus cash (taking account of regulatory cash
requirements)
Page 18

Xavier Rolet
London Stock Exchange Group Page 19

Strategy delivering strong results
London Stock Exchange Group
• Delivering organic and inorganic growth as we develop global leadership
positions
• Successful geographic and product diversification strategy - expanded
footprint established in US
• Valuable international franchise:
• Indices – FTSE and Russell
• Post Trade - LCH.Clearnet
• Global listings business – 837 international companies listed
• Unique open-access model; close partnership with customers
• Complementary products and services positioned around:
• Capital formation (primary and secondary markets)
• Intellectual property (indices, data and technology)
• Risk and balance sheet management (clearing, settlement and CSD
services)
Page 20

Developing organically and through M&A
London Stock Exchange Group
Enlarged Group Adjusted Total Income
CY 2014: £1,381.1m
Page 21
FY 2009: £671.4m
Chart excludes Russell Investment Management revenues
• Resilient and interconnected markets infrastructure business
• All parts of Group delivering growth
• Broad spread of international businesses

Diversified income by currency
Page 22
CY 2014 Total income including Frank Russell Company (pro forma)
FTSE – strong track record of achievement
London Stock Exchange Group
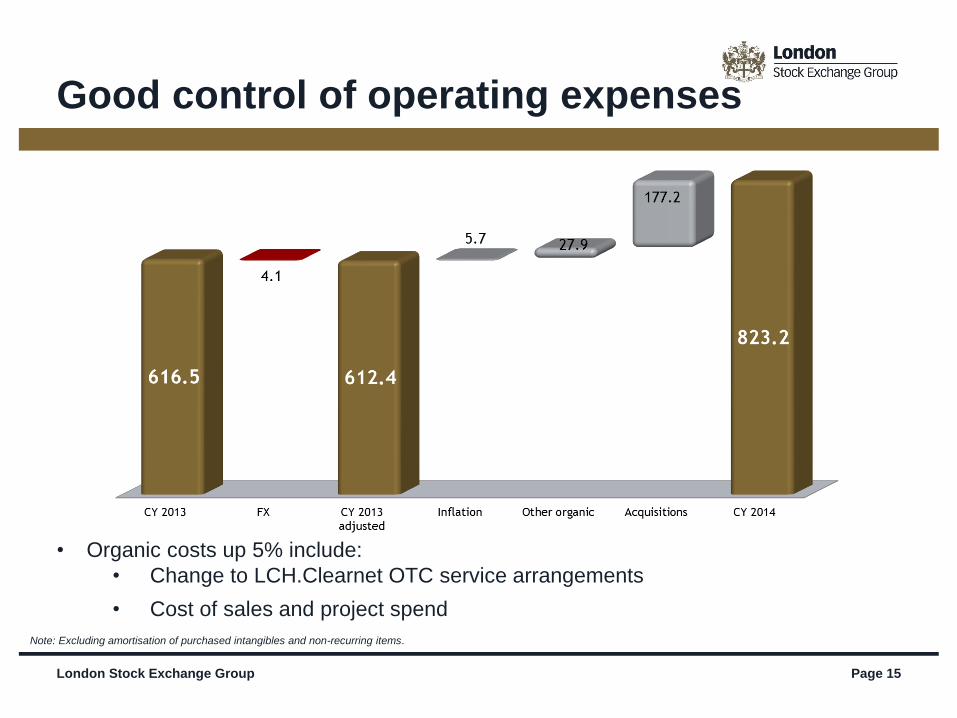
• Acquired the remaining 50% of FTSE in
December 2011
• Delivered strong revenue growth from 2011
to 2014 - CAGR of 16%
• Achieved target £28m cost and revenue
synergies.
• Exceeded our WACC in year 2 (one year
ahead of schedule) and return on invested
capital continues to grow
Page 23

FTSE/Russell - creating a global
leader in indices
London Stock Exchange Group
• Opportunities to drive growth:
• Cost synergies underway
• Revenue synergies - cross selling and extended product range
• Strong international market positions – well placed for growth in passive and smart
beta strategies
• Integration of indices businesses underway
• Russell & FTSE sales teams integration under way
• December 2014 revenues
• Russell Indexes £10.0m – included in Information Services
Page 24

CBOE to list FTSE and Russell
index options in the US
London Stock Exchange Group Page 25
• CBOE to trade the highly liquid Russell 2000 index
options after a competitive tender process
• Agreement also licenses CBOE to list and trade
index options on the Russell 1000, FTSE Emerging
Index, FTSE Developed Europe Index, FTSE China
50 Index and the FTSE 100 Index - demonstrates
early synergies from the combination of FTSE and
Russell
• Increased volumes and revenues for LSEG
• LSEG and CBOE to work together on developing
further new and innovative index-based cash option
products
• CBOE is #1 globally (notional value of index
options) - preferred venue in the US for Russell and
FTSE options users seeking deep liquidity pools
and breadth of market makers
852
377 372
250
130
0
100
200
300
400
500
600
700
800
900
S&P DowJones
MSCI FTSE +Russell
Barclays CRSP
Top 5 ETF index providers by AUM Dec 2014 (US$ bn)
Russell 2000 Index Options ADV (contracts)
Source: OCC data
71,126 74,951
87,800 86,400
0
10,000
20,000
30,000
40,000
50,000
60,000
70,000
80,000
90,000
100,000
2012 2013 2014 2015 YTD
Source: ETFGI report

LCH.Clearnet – building global
positions
London Stock Exchange Group
• Well placed in evolving regulatory landscape
• Leveraging new opportunities in FX, Repo, equities and derivatives
• Positioning to be global leader in portfolio margining
LCH.Clearnet to launch new, open access portfolio margining tool for users
• Maximise margin efficiencies across cleared listed Interest Rate Derivatives
(IRD) and Over The Counter (OTC) portfolios
• Using the world’s largest IRD liquidity pool from SwapClear
• Open access for increased customer margin efficiency
Page 26

2 5 30 10 50 Years
DSFs SwapClear OTC
Rate Derivatives
Cash Bonds 3M Futures
Government Bond Futures
The global rates market has a variety of products to access interest rate exposures
Some or all of these products potentially provide margin offset
Portfolio margining – LCH covers entire curve
Key rates products to hedge interest rate risk or speculate on rates
Leadership Positions:
LCH.Clearnet: OTC IR Derivatives– 17 currencies, GBP and Euro repo clearing
CME: USD - 3M futures, Treasury Futures, Deliverable Swap Futures (DSFs)
LIFFE: GBP and EURO 3M futures and Long dated Gilt Futures
EUREX: Long dated Bund futures
London Stock Exchange Group Page 27

SwapClear – Clearing more, compressing more
2014 Highlights:
• Record year for cleared swap volume on SwapClear
• $64 trn reduction in total notional outstanding.
• $292 trn net notional compressed across products
• Introduction of new Solo with Blended Rate in
September 2014 - $23 trn compressed
Compression reduces notional and trade count with the
following benefits :
• Reduced leverage ratio and capital requirements for members
• Reduced portfolio line items and operational risk /cost
• More efficient default management and client porting
2014 Compression Impact
$ trillion
Page 28 London Stock Exchange Group

Innovation – leveraging Group’s
enhanced product and geographic range
London Stock Exchange Group
Fixed Income offering, consistent with open-access principles:
• Listing
• Trading in Europe and US (MTS, MOT, ORB, EuroTLX, Bonds.Com)
• Clearing – CC&G and LCH.Clearnet RepoClear
• Indices – FTSE TMX Global Debt Capital Markets
• Data products
New products - Fixed Income ETFs
Fixed Income products contribute over 10% of Group income
Page 29

Outlook
London Stock Exchange Group
• Strong financial performance
• Delivering organic and inorganic growth as we develop global
leadership positions
• Leveraging opportunities from Group’s enhanced scale and scope
• Focus on integration of Russell and FTSE indices to achieve
synergies
• Continued product innovation e.g. Compression and Portfolio
Margining
• Further efficiencies at LCH.Clearnet
• Realising value with sale of Russell Investment Management
• Well positioned for evolving regulatory landscape
• Strongly placed to develop further through unique open-access,
customer partnership model
Page 30

Appendices
London Stock Exchange Group Page 31

Notes
Adjusted operating profit - excludes amortisation of purchased intangible assets, non-recurring
items and unrealised gains/losses at LCH.Clearnet, to enable comparison of the underlying earnings of
the business with prior periods.
Adjusted earnings per share Based on number of shares 317.1m (CY 2013 : 293.1m), excludes ESOP and adjusted for September
2014 rights issue bonus factor
Exchange rates
A €10c movement in the average £/€ rate for the year would have changed the Group’s operating profit for the year before
amortisation of purchased intangibles and non-recurring items by approximately £26 million.
London Stock Exchange Group Page 32
Exchange rates GBP : USD GBP : EUR
Average 12 months
2013 1.56 1.19
2014 1.65 1.25
Period closing
31-Dec-2013 1.65 1.21
31-Dec-2014 1.56 1.28

Operating expenses
London Stock Exchange Group
Excluding amortisation of purchased intangibles and non-recurring items
Cost : Income ratio 60% (CY 2013 56%)
Note: Minor rounding differences, figures may not cast down
Page 33

Key performance indicators
London Stock Exchange Group
Note: Minor rounding differences may mean quarterly and other segmental figures may differ slightly.
Page 34
Capital Markets - Secondary Markets
Twelve months ended
31 December Variance
Equity 2014 2013 %
Totals for period
UK value traded (£bn) 1,165 1,023 14%
Borsa Italiana (no of trades m) 66.6 57.1 17%
Turquoise value traded (€bn) 944.2 655.4 44%
SETS Yield (basis points) 0.63 0.67 (6%)
Average daily
UK value traded (£bn) 4.6 4.0 15%
Borsa Italiana (no of trades '000) 264 227 16%
Turquoise value traded (€bn) 3.7 2.6 42%
Derivatives (contracts m)
LSE Derivatives 11.4 17.8 (36%)
IDEM 39.0 32.5 20%
Total 50.4 50.3 0%
Fixed Income
MTS cash and BondVision (€bn) 4,185 3,169 32%
MTS money markets (€bn term adjusted) 74,396 72,345
3%
Capital Markets - Primary Markets
Twelve months ended
31 December Variance 2014 2013 %
New Issues
UK Main Market, PSM & SFM 75 51 47%
UK AIM 118 100 18%
Borsa Italiana 26 18 44%
Total 219 169 30%
Company Numbers (as at period end)
UK Main Market, PSM & SFM 1,342 1,359 (1%)
UK AIM 1,104 1,087 2%
Borsa Italiana 306 290 6%
Total 2,752 2,736 1%
Market Capitalisation (as at period end)
UK Main Market (£bn) 2,219 2,307 (4%)
UK AIM (£bn) 71 76 (7%)
Borsa Italiana (€bn) 468 447 5%
Borsa Italiana (£bn) 364 372 (2%)
Total (£bn) 2,654 2,755 (4%)
Money Raised (£bn)
UK New 15.2 12.7 20%
UK Further 17.0 15.8 8%
Borsa Italiana new and further 10.4 1.9 447%
Total (£bn) 42.6 30.4 40%

Key performance indicators
London Stock Exchange Group
Note: Minor rounding differences may mean quarterly and other segmental figures
may differ slightly.
Page 35
Post Trade Services - CC&G and Monte Titoli
Twelve months ended
31 December Variance 2014 2013 %
CC&G Clearing (m)
Equity clearing (no of trades) 69.7 60.0 16%
Derivative clearing (no of contracts) 39.0 32.5 20%
Total 108.7 92.5 18%
Initial margin held (average €bn) 9.9 11.6 (15%)
Monte Titoli
Settlement instructions (trades m) 64.8 56.8 14% Custody assets under management
(average €tn) 3.35 3.30 2%
Information Services As at
31 December Variance 2014 2013 %
Terminals
UK 76,000 80,000 (5%)
Borsa Italiana Professional Terminals 131,000 131,000 0%
ETFs assets under management
benchmarked ($bn)
FTSE 216 186 16%
Russell Indexes 153 129 19%
Russell Investment Management AuM
($bn) 273 257 6%
Post Trade Services - LCH.Clearnet Twelve months ended
31 December Variance 2014 2013 %
OTC derivatives
SwapClear
IRS notional outstanding ($trn) 362 426 (15%)
IRS notional cleared ($trn) 642 508 26%
SwapClear members 114 103 11%
CDSClear
Open interest (€bn) 36.0 23.0 57%
Notional cleared (€bn) 61.9 167.6 (63%)
CDSClear members 10 11 (9%)
ForexClear
Notional value cleared ($bn) 907 888 2%
ForexClear members 21 20 5%
Non-OTC
Fixed income - Nominal value (€trn) 73.4 72.8 1%
Commodities (lots m) 123.6 123.3 0%
Listed derivatives (contracts m) 176.8 174.3 1%
Cash equities trades (m) 452.3 347.5 30%
Average cash collateral (€bn) 47.1 39.4 20%

Revenues - Quarterly
London Stock Exchange Group
Note: Minor rounding differences may mean quarterly and other segmental figures may differ slightly.
Page 36
CY 2013 CY 2014
£ millions Q1 Q2 Q3 Q4 CY 2013 Q1 Q2 Q3 Q4 CY 2014
Annual Fees 9.7 10.0 10.3 10.2 40.2 10.7 11.0 11.3 11.2 44.2
Admission Fees 7.3 9.5 7.6 12.8 37.2 10.0 14.3 8.8 11.5 44.6
Cash equities UK & Turquoise 23.3 24.2 22.2 21.7 91.4 26.4 24.5 23.8 26.5 101.2
Cash equities Italy 9.4 8.6 8.6 9.0 35.6 9.9 10.0 8.7 9.4 38.0
Derivatives 4.9 5.0 4.7 4.9 19.5 5.0 4.9 4.6 5.5 20.0
Fixed Income 14.8 15.5 14.5 18.4 63.2 19.7 19.9 18.2 18.1 75.9
Other 2.1 2.2 2.3 3.1 9.7 2.5 2.4 2.2 2.2 9.3
Capital Markets 71.5 75.0 70.2 80.1 296.8 84.2 87.0 77.6 84.4 333.2
Clearing 10.4 10.1 9.0 10.4 39.9 10.5 10.2 8.2 9.3 38.2
Settlement 4.6 4.4 3.5 4.2 16.7 4.4 5.0 3.8 4.2 17.4
Custody & other 10.3 10.6 10.6 10.6 42.1 10.2 10.8 10.0 9.9 40.9
Post Trade Services - CC&G and Monte Titoli 25.3 25.1 23.0 25.2 98.7 25.1 26.0 22.0 23.4 96.5
2 months
OTC - SwapClear - 14.9 26.3 24.5 65.7 25.8 26.8 27.6 29.4 109.6
OTC - ForexClear / CDSClear - 2.7 4.0 4.0 10.7 7.4 7.3 6.9 7.0 28.6
Fixed income - 5.4 8.4 7.0 20.8 11.0 11.6 11.0 9.3 42.9
Commodities - 4.4 9.1 9.3 22.8 11.3 14.1 12.2 -0.1 37.5
Listed derivatives - 12.4 11.2 11.5 35.1 12.9 9.5 10.3 11.7 44.4
Cash equities - 6.2 8.2 8.7 23.1 9.3 8.4 8.3 9.0 35.0
Other - 3.0 (5.0) (3.9) (5.9) 12.9 5.5 6.2 6.8 31.4
Post Trade Services - LCH.Clearnet - 49.0 62.2 61.1 172.3 90.6 83.2 82.5 73.1 329.4

Revenues – Quarterly (continued)
London Stock Exchange Group
Note: Minor rounding differences may mean quarterly and other segmental figures may differ slightly.
Page 37
CY 2013 CY 2014
£ millions Q1 Q2 Q3 Q4 CY 2013 Q1 Q2 Q3 Q4 CY 2014
FTSE 36.4 41.7 42.2 44.2 164.5 45.9 44.4 48.3 48.2 186.8
Russell Indexes - - - - - - - - 10.0 10.0
Real time data 26.9 22.4 22.2 23.0 94.5 23.3 21.3 21.3 18.4 84.3
Other information 19.4 19.8 20.1 21.2 80.5 22.8 22.3 23.4 23.4 91.9
Information Services 82.7 83.9 84.5 88.4 339.5 92.0 88.0 93.0 100.0 373.0
MillenniumIT 8.8 7.4 5.7 7.9 29.8 10.5 6.0 6.9 6.3 29.7
Technology 8.0 8.1 8.2 8.1 32.4 8.1 8.3 9.6 10.3 36.3
Technology Services 16.8 15.5 13.9 16.0 62.2 18.6 14.3 16.5 16.6 66.0
Russell Investment Management (gross) 79.7 79.7
Other 1.2 1.2 0.7 1.5 4.5 1.3 1.4 1.1 1.6 5.4
Total Revenue 197.5 249.7 254.5 272.3 974.0 311.8 299.9 292.7 378.8 1,283.2
Net treasury income through CCP:
CC&G 20.9 16.7 11.4 10.1 59.2 9.4 7.5 8.0 7.7 32.6
LCH.Clearnet - 11.8 18.7 17.6 48.1 14.1 15.1 17.2 13.6 60.0
Other income 2.0 2.1 2.2 8.9 15.1 1.9 1.4 0.7 1.3 5.3
LCH.Clearnet unrealised gain / (loss) - (1.2) (0.8) (0.9) (2.9) (0.6) 0.7 -0.3 -0.3 (0.5)
Total income including unrealised 220.4 279.1 286.0 308.0 1,093.5 336.5 324.6 318.3 401.1 1,380.6
Total income excluding unrealised 220.4 280.3 286.8 308.9 1,096.4 337.1 323.9 318.6 401.4 1,381.1

Contacts
London Stock Exchange Group
Paul Froud Tom Woodley
Head of Investor Relations Investor Relations Manager
Tel: +44 (0)207 797 1186 Tel: +44 (0)207 797 1293
email: [email protected]
email: [email protected]
London Stock Exchange Group plc
10 Paternoster Square
London
EC4M 7LS
For information on the Group: www.lseg.com
Page 38

London Stock Exchange Group
No representation or warranty, expressed or implied, is made or given by or on behalf of London
Stock Exchange Group plc (the “Company”) or any of its directors or any other person as to the
accuracy, completeness or fairness of the information or opinions contained in this presentation and
no responsibility or liability is accepted for any such information or opinions. This presentation does
not constitute an offer of securities by the Company and no investment decision or transaction in the
securities of the Company should be made on the basis of the information or opinions contained in
this presentation.
The content of this presentation includes statements that are, or may deemed to be, "forward-looking
statements". These forward-looking statements can be identified by the use of forward-looking
terminology, including the terms "believes", "estimates", "anticipates", "expects", "intends", "may",
"will" or "should". By their nature, forward-looking statements involve risks and uncertainties and
readers are cautioned that any such forward-looking statements are not guarantees of future
performance. The Company's actual results and performance may differ materially from the
impression created by the forward-looking statements. The Company undertakes no obligation to
update or revise any forward-looking statements, except as may be required by applicable law and
regulation (including the Listing Rules).
This presentation and its contents are confidential and should not be distributed, published or
reproduced (in whole or in part) or disclosed by recipients to any other person.
Page 39