Embed Size (px)
Citation preview

1.Your Secure Application Services Company
Investor PresentationDecember 2017

2.
Cautionary Statements and DisclosuresThis presentation and the accompanying oral presentation contain “forward-looking” statements that are based on our management’s beliefs andassumptions and on information currently available to management, including statements regarding our projections for our fourth quarter 2017 operatingresults, our expectations for future revenue growth and market opportunities, the performance of our products, profitability, operating margin and operatingexpenses, our ability to penetrate certain markets, anticipated customer needs, expected product launches and the general growth of our business.
We operate in very competitive and rapidly changing environments, and new risks may emerge from time to time. It is not possible for our management topredict all risks, nor can we assess the impact of all factors on our business or the extent to which any factor, or combination of factors, may cause actualresults to differ materially from those contained in any forward-looking statements we may make. Forward-looking statements are subject to known andunknown risks, uncertainties, assumptions and other factors including, but not limited to, those related to execution risks related to closing key deals and improving our execution, the continued market adoption of our products, our ability to successfully anticipate market needs and opportunities, our timely development of new products and features, our ability to achieve or maintain profitability, any loss or delay of expected purchases by our largest end-customers, our ability to attract and retain new end-customers, our ability to maintain and enhance our brand and reputation, continued growth in markets relating to network security, management and analysis, the success of any future acquisitions or investments in complementary companies, products, services or technologies, the ability of our sales team to execute well, our ability to shorten our close cycles, the ability of our channel partners to sell our products, variations in product mix or geographic locations of our sales and risks associated with our presence in international markets.
These factors, together with those described in our quarterly reports on Form 10-Q, annual reports on Form 10-K and other filings made with theSecurities and Exchange Commission (“SEC”), may cause our actual results, performance or achievements to differ materially and adversely from thoseanticipated or implied by our forward-looking statements.
You should not rely upon forward-looking statements as predictions of future events. Although our management believes that the expectationsreflected in our forward-looking statements are reasonable, we cannot guarantee that the future results, levels of activity, performance or events andcircumstances described in the forward-looking statements will be achieved or occur. Moreover, neither we, nor any other person, assumeresponsibility for the accuracy and completeness of the forward-looking statements. We disclaim any obligation to update information contained inthese forward-looking statements whether as a result of new information, future events, or otherwise.

3.
Cautionary Statements and Disclosures
In addition to the U.S. GAAP financials, this presentation includes certain non-GAAP financial measures. The non-GAAP measures have limitations asanalytical tools and you should not consider them in isolation or as a substitute for an analysis of our results under U.S. GAAP. There are a number oflimitations related to the use of these non-GAAP financial measures versus their nearest GAAP equivalents. For example, other companies maycalculate non-GAAP financial measures differently or may use other measures to evaluate their performance, all of which could reduce the usefulnessof our non-GAAP financial measures as tools for comparison.
A10 Networks considers these non-GAAP financial measures to be important because they provide useful measures of the operating performance ofthe company, exclusive of unusual events or factors that do not directly affect what we consider to be our core operating performance, andare used by the company's management for that purpose.
With the exception of revenue, all financial measures discussed today are on a non-GAAP basis and have been adjusted to exclude certain charges. Theuse of non-GAAP measures is further discussed in the accompanying quarterly financial results press release, which has been furnished to the SEC onForm 8-K and posted on A10 Networks’ website. The press release also defines our non-GAAP financial measures.
A reconciliation between GAAP and non-GAAP measures for historical periods can also be found in the appendix to this document, in the accompanyingpress release and on the trended quarterly financial statements posted on the company’s website. A reconciliation of non-GAAP guidance measures tocorresponding GAAP measures on a forward-looking basis is not available, due to high variability and low visibility with respect to the charges whichare excluded from these non-GAAP measures.

4.
Investment Highlights
Agile, flexible, scalable and secure ACOS Platform
Experienced Management Team
Large, Growing Customer Base
Security & Cloud Driving Revenue Growth
$12B+ Secure Application Services Market
Cloud-ready and Threat-smart solutions
2011 2016
20% CAGR
REVENUE
$91 M
$230 M

5.
~5,800+ Customers in 80+ Countries
SERVICE PROVIDERS ENTERPRISE & TECHNOLOGY
Top 4U.S. WIRELESS CARRIERS
7 of Top 9U.S. CABLE PROVIDERS
Top 3WIRELESS CARRIERSin JAPAN and Korea
6.
Addressing Market Challenges
Connected Devices
Increased Traffic
1
SSL Tsunami
Increased Security Risk
3 Internet of Things
Increased Cyber Attack
4
Cloud Migration2Increased Flexibility, Analytics, Automation

7.
Security Solutions
O N P R E M I S E
C L O U D
Harmony Controller
ManagementAnalytics, Configuration
aGalaxy
Centralized ManagementReporting, Control
SSLi CFWTPS
SECURITY
• DDoS Mitigation• Detection, traffic
baselining, auto-learning
• SSL visibility• Policy Enforcement• Dynamic web category
classification
• Firewall platform• DC Firewall / Gi Firewall• Secure Web Gateway• Site to Site IPSec VPN

8.
The New Opportunity for Secure Application Services
CLOUD
MicroServices
Application Services Analytics, Configuration, Orchestration
DATA CENTER
MonolithicServices
Security

9.
Harmony Controller
ANY USER. ANY APP. ANY WHERE.
PRIVATE CLOUD
DATA CENTERHACKER
DDOS ATTACK
HOME OFFICE
REMOTE USER
PUBLIC CLOUD
SAAS CLOUD
AVAILABILITY
SECURITY VISIBILITY

10.
A10 Porfolio
O N P R E M I S E
C L O U D
Harmony Controller
Cloud Native Appliances
CloudInstances Virtual C H O I C E
BareMetal
aGalaxy
CGNSSLi CFW ADCTPS
SECURITY APPLICATION DELIVERY

11.
Relentless Pursuit of Innovation
Compact ADC, All Inclusive Pricing
1st Virtual Chassis ADC & Soft ADC
1st SSL Intercept & 4k-bit SSL keys
1st Scalable Shared Memory OS: ACOS
1st 64-bit ADC OS ACOS 2.0
1st Standalone CGN & IPv4/IPv6 Solution
1st ADC with Integrated Security Module (UASG)
1st High Performance DDoS Solution
Cloud-ready ACOS 4.0
1st High Performance Convergent Firewall
2007 2008 2009 2010 2011 2012 2013 2014 2015 2016
Application-centric, Cloud-native Platform
Platform
Flexible Solutions
Security & App Delivery
Cloud
Harmony ControllerIntelligent Automation
2017

12.
Third Quarter 2017 SummaryThird quarter revenue increased 12% y/y to reach $61.4 Million
• Driven by:
• Solid demand and the team’s improved execution
• Strength with our marquee service provider customers
• Product revenue grew 12% y/y to $39.4 M, or 64% of total revenue
• Achieved strong product bookings for Thunder ADC and record product bookings for our Thunder SSLi and Thunder CFW solutions
• Strong performance in U.S. & Japan
Continued bottom-line improvement• Reported GAAP net loss of $2.7 M, or $0.04 per basic share
• Achieved non-GAAP net income of $2.1 M or $0.03 on a per share basis, compared with break-even on a per share basis in last year’s third quarter

13.
Revenue Trend
QUARTERLY $M
$179
$199
$230
2014 2015 2016
ANNUAL$M
Annual
$51
$57 $54
$57 $55
$64 $60
$54
$61
Q3 Q4 Q1 Q2 Q3 Q4 Q1 Q2 Q3
2015 2016 2017

14.
Revenue Mix
$ MILLIONS / % REVENUE
Product Geography Verticals
Numbers may not total to 100% due to rounding.

15.
Non-GAAP Gross Profit
*Non-GAAP rounded financial measures. For reconciliation see Appendix.
0%
10%
20%
30%
40%
50%
60%
70%
80%
90%
100%
$-
$10
$20
$30
$40
$50
$60
$70
Q1'15 Q2'15 Q3'15 Q4'15 Q1'16 Q2'16 Q3'16 Q4'16 Q1'17 Q2'17 Q3'17
$ M
illio
ns
Product GP $ Service GP $ Total GM %

16.
Summary Financial Results
NON-GAAP* FINANCIAL MEASURES ($M) Q1’16 Q2’16 Q3’16 Q4’16 Q1’17 Q2’17 Q3’17
Sales & Marketing $24.7 $25.0 $22.6 $25.1 $24.7 $23.7 $25.2
Research & Development $13.3 $13.4 $14.0 $13.7 $15.1 $14.4 $14.2
General, Administrative & Litigation $6.9 $6.6 $5.6 $6.1 $6.3 $6.1 $6.0
Income (Loss) from Operations $(4.0) $(1.9) $0.3 $4.7 $0.2 $(2.8) $2.7
Net income (loss) Per share $(0.06) $(0.02) $0.00 $0.03 $0.01 $(0.04) $0.03
*Non-GAAP rounded financial measures. For reconciliation see Appendix.

17.
NON-GAAP FINANCIAL MEASURES FY 2014 FY 2015 FY 2016 TARGET
Gross Margin 77% 76% 77% 78-79%
Sales & Marketing 51% 49% 42% 31-34%
Research & Development 26% 25% 24% 15-18%
General, Administrative & Litigation
14% 13% 11% 7-9%
Operating Margin (14%) (11%) (0.4%) 21-25%
* The company plans to reach it’s target model by the end of 2019. Please refer to reconciliation of GAAP to Non-GAAP measures in Appendix and commentary regarding forward looking statements.
Target Model
17

18.
Balance Sheet & Cash Flow
SELECTED GAAP FINANCIAL MEASURES ($M) Q1’16 Q2’16 Q3’16 Q4’16 Q1’17 Q2’17 Q3’17
Cash and Marketable Securities $107.5 $113.7 $116.8 $114.3 $116.2 $132.2 $123.9
Accounts Receivable $41.9 $39.3 $48.9 $66.8 $61.8 $41.4 $49.9
Deferred Revenue (total) $74.8 $75.8 $83.2 $92.9 $93.1 $92.5 $91.0
Cash Flow Provided by (Used in) Ops $10.4 $8.8 $2.0 $(2.5) $0.5 $13.2 $(3.8)

19.
Appendix

20.
Non-GAAP Reconciliation – Gross Profit
QUARTERLY Q1’16 Q2’16 Q3’16 Q4’16 Q1’17 Q2’17 Q3’17
Gross Profit Margin (GAAP) 75% 75% 76% 77% 77% 76% 78%
SBC* included in COGS 1% 1% 1% —% —% 1% 1%
Gross Profit Margin (Non-GAAP) 76% 76% 77% 78% 77% 77% 78%
* SBC stands for stock-based compensation.
QUARTERLY ($M) Q1’16 Q2’16 Q3’16 Q4’16 Q1’17 Q2’17 Q3’17
Gross Profit (GAAP) $40.6 $42.9 $42.1 $49.5 $46.1 $41.0 $47.7
SBC* included in COGS $0.3 $0.2 $0.3 $0.2 $0.3 $0.4 $0.4
Gross Profit (Non-GAAP) $40.9 $43.1 $42.4 $49.7 $46.4 $41.4 $48.1

21.
Non-GAAP Reconciliation – Expense Items$ Millions Q1’16 Q2’16 Q3’16 Q4’16 Q1’17 Q2’17 Q3’17Sales & Marketing (GAAP) $26.8 $26.8 $24.3 $26.5 $26.3 $25.6 $26.9SBC included in Sales & Marketing (2.1) (1.7) (1.7) (1.4) (1.5) (1.9) (1.7)Sales & Marketing (Non-GAAP) $24.7 $25.0 $22.6 $25.1 $24.7 $23.7 $25.2
R&D (GAAP) $14.8 $14.5 $16.0 $15.5 $17.0 $16.5 $16.0SBC included in R&D (1.4) (1.1) (1.7) (1.5) (1.7) (1.8) (1.5)Amortization expense related to acquisition — — (0.3) (0.3) (0.3) (0.3) (0.3)R&D (Non-GAAP) $13.3 $13.4 $14.0 $13.7 $15.1 $14.4 $14.2
G&A (GAAP) $6.7 $7.2 $6.3 $6.9 $7.2 $7.0 $6.9SBC included in G&A (0.7) (0.8) (0.8) (0.8) (0.8) (0.9) (0.9)G&A (Non-GAAP) $5.9 $6.4 $5.5 $6.1 $6.3 $6.1 $6.0
Litigation (GAAP) $1.8 $0.2 $0.1 $— $— $— $—Litigation and Settlement (0.8) — — — — — —Litigation (Non-GAAP) $1.0 $0.2 $0.1 $— $— $— $—
Total Op Exp (GAAP) $50.0 $48.7 $46.7 $48.9 $50.5 $49.0 $49.8SBC included in Total Op Exp (4.3) (3.6) (4.3) (3.7) (4.0) (4.6) (4.1)Amortization expense related to acquisition — — (0.3) (0.3) (0.3) (0.3) (0.3)Litigation Settlement (0.8) — — — — — —Total Op Exp (Non-GAAP) $44.9 $45.0 $42.2 $44.9 $46.2 $44.2 $45.4

22.
Non-GAAP Reconciliation – Income (Loss) Items
$ Millions Q1’16 Q2’16 Q3’16 Q4’16 Q1’17 Q2’17 Q3’17Income (Loss) from Operations (GAAP) $(9.4) $(5.8) $(4.6) $0.6 $(4.3) $(8.0) $(2.1)
Stock-Based Compensation 4.6 3.9 4.6 3.8 4.3 5.0 4.5Amortization Expense Related to Acquisition — — 0.3 0.3 0.3 0.3 0.3Litigation and Settlement 0.8 — — — — — —
Income (Loss) from Operations (Non-GAAP) $(4.0) $(1.9) $0.3 $4.7 $0.2 $(2.8) $2.7
Net Loss (GAAP) $(9.5) $(4.9) $(4.7) $(1.8) $(3.9) $(8.3) $(2.7)Stock-Based Compensation 4.6 3.9 4.6 3.8 4.3 5.0 4.5Amortization Expense Related to Acquisition — — 0.3 0.3 0.3 0.3 0.3Litigation and Settlement 0.8 — — — — — —
Net Income (Loss) (Non-GAAP) $(4.1) $(1.1) $0.2 $2.3 $0.7 $(3.1) $2.1
Weighted Average Shares used in per share calculations for non-GAAP net income (loss) per share:
Basic 64.3 64.9 66.3 67.5 68.6 69.8 70.7Diluted 64.3 64.9 72.8 73.1 74.3 69.8 73.6
23.
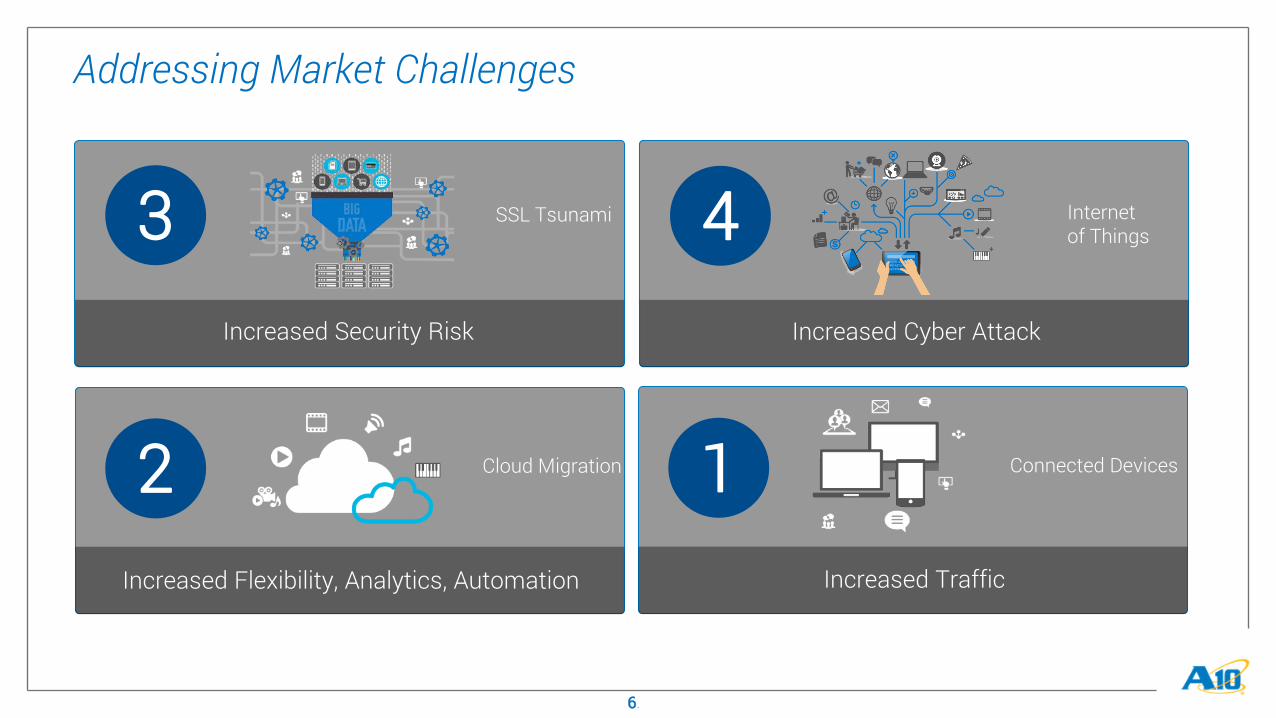
Thunder Security Deployments
DDoS Mitigation ADC Security

24.
ACOS Shared Memory AdvantagesShared Memory Architecture
High-Speed Shared
Memory
L4-7CPU 4
L4-7CPU 3
L4-7CPU 2
L4-7CPU 1
2-5x PERFORMANCE*
IPC Memory ArchitectureCommunication Bus
L4-7CPU 4
L4-7CPU 3
L4-7CPU 2
L4-7CPU 1
AN ANALOGY
Single Simultaneous ResourceShared in Cloud
Synching Multiple Versions Shared via Email
Duplication and Latency
* Measured by web transactions (Layer 4 connections / second) in product comparisons per unit of computing and memory resources, power, rack space or list price.

25.
1971 - 2001 2005 - NOWSINGLE CORE
CPUPerformance = transistor count MULTI-CORE
CPUPerformance Advanced Core OS (ACOS)
Software Optimized Multi-core, Multi-CPU
‘71 ‘76 ‘81 ‘86 ‘91 ‘96
1
10
100
1,000
10,000
100,000
1,000,000
10,000,000
4004
8008
802868080
i386 ProcessorI486 Processor
Pentium II Processor
Pentium Processor
Pentium Pro Processor
The Number of Transistor Per ChipDOUBLE EVERY 18 MONTHS

26.
Notes

27.
Notes

THANK YOU